| Param | Original file | Final file |
|---|---|---|
| Filename | modeM0/AS1G05_237T03_9000000426_03105cztM0_level2.evt | modeM0/AS1G05_237T03_9000000426_03105cztM0_level2_quad_clean.evt |
| Size (bytes) | 724,354,560 | 131,883,840 |
| Size | 690.8 MB | 125.8 MB |
| Events in quadrant A | 4,922,979 | 824,447 |
| Events in quadrant B | 6,101,599 | 808,599 |
| Events in quadrant C | 4,946,969 | 821,434 |
| Events in quadrant D | 5,239,710 | 798,074 |
| Mode M9 | |||
|---|---|---|---|
| Quadrant | BADHDUFLAG | Total packets | Discarded packets |
| A | 0 | 5 | 0 |
| B | 0 | 5 | 0 |
| C | 0 | 5 | 0 |
| D | 0 | 5 | 0 |
| Mode M0 | |||
|---|---|---|---|
| Quadrant | BADHDUFLAG | Total packets | Discarded packets |
| A | 0 | 21964 | 2 |
| B | 0 | 25365 | 1 |
| C | 0 | 22292 | 1 |
| D | 0 | 23327 | 1 |
| Mode SS | |||
|---|---|---|---|
| Quadrant | BADHDUFLAG | Total packets | Discarded packets |
| A | 0 | 216 | 0 |
| B | 0 | 216 | 0 |
| C | 0 | 216 | 0 |
| D | 0 | 216 | 0 |
| Quadrant | Total seconds | Saturated seconds | Saturation percentage |
|---|---|---|---|
| A | 10709 | 51 | 0.476235% |
| B | 10709 | 197 | 1.839574% |
| C | 10709 | 57 | 0.532263% |
| D | 10709 | 84 | 0.784387% |
Noise dominated data is calculated using 1-second bins in cleaned event files. If a bin has >2000 counts, and if more than 50% of those come from <1% of pixels, then it is considered to be noise-dominated and hence unusable.
| Quadrant | # 1 sec bins | Bins with >0 counts | Bins with >2000 counts | High rate bins dominated by noise | Noise dominated (total time) | Noise dominated (detector-on time) | Marked lightcurve |
|---|---|---|---|---|---|---|---|
| A | 11204 | 10710 | 10 | 10 | 0.09% | 0.09% | 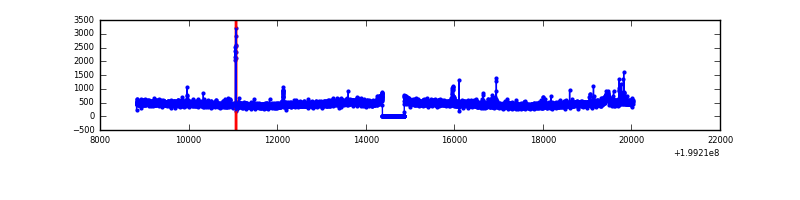 |
| B | 11204 | 10710 | 112 | 112 | 1.00% | 1.05% | 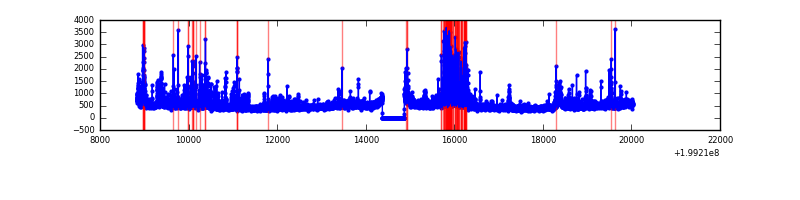 |
| C | 11204 | 10710 | 13 | 13 | 0.12% | 0.12% | 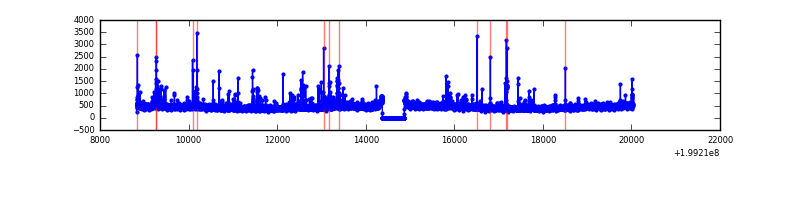 |
| D | 11204 | 10710 | 38 | 38 | 0.34% | 0.35% | 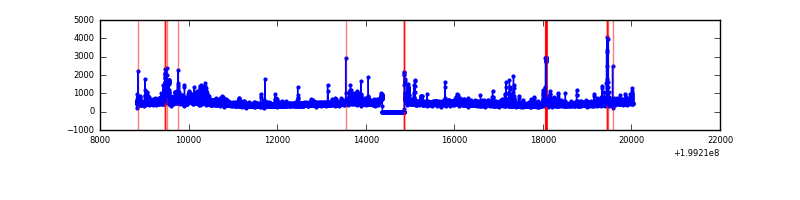 |
Top three noisy pixels from each quadrant. If the there are fewer than three noisy pixels in the level2.evt file, extra rows are filled as -1
| Pixel properties | Quadrant properties | ||||||
|---|---|---|---|---|---|---|---|
| Quadrant | DetID | PixID | Counts | Sigma | Mean | Median | Sigma |
| A | 8 | 15 | 143313 | 576.45 | 1205 | 1180 | 246.6 |
| A | 0 | 5 | 59215 | 235.37 | 1205 | 1180 | 246.6 |
| A | 0 | 117 | 22397 | 86.05 | 1205 | 1180 | 246.6 |
| B | 1 | 223 | 692565 | 2958.68 | 1215 | 1191 | 233.7 |
| B | 15 | 204 | 218222 | 928.77 | 1215 | 1191 | 233.7 |
| B | 0 | 219 | 182190 | 774.57 | 1215 | 1191 | 233.7 |
| C | 1 | 16 | 105251 | 381.53 | 1167 | 1176 | 272.8 |
| C | 6 | 80 | 80891 | 292.23 | 1167 | 1176 | 272.8 |
| C | 14 | 234 | 41323 | 147.18 | 1167 | 1176 | 272.8 |
| D | 13 | 114 | 516906 | 1834.55 | 1156 | 1125 | 281.1 |
| D | 7 | 223 | 64823 | 226.56 | 1156 | 1125 | 281.1 |
| D | 13 | 239 | 51818 | 180.31 | 1156 | 1125 | 281.1 |
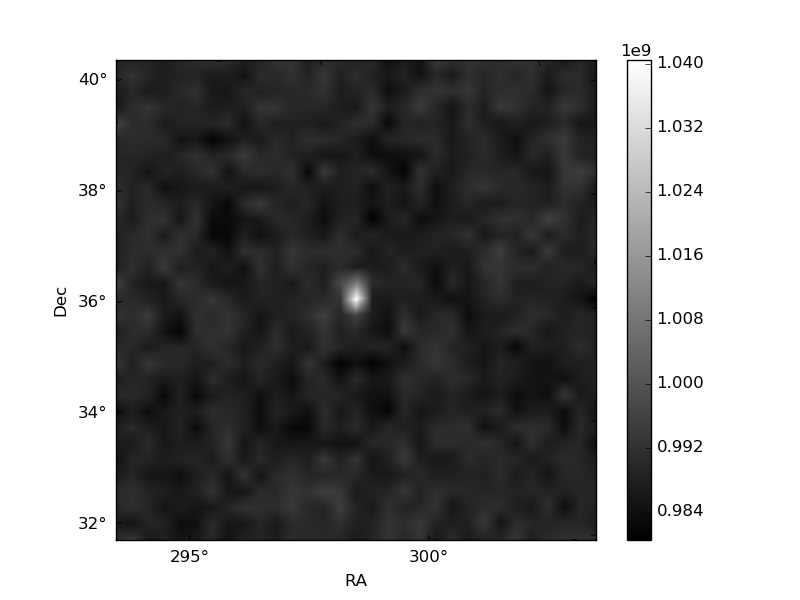
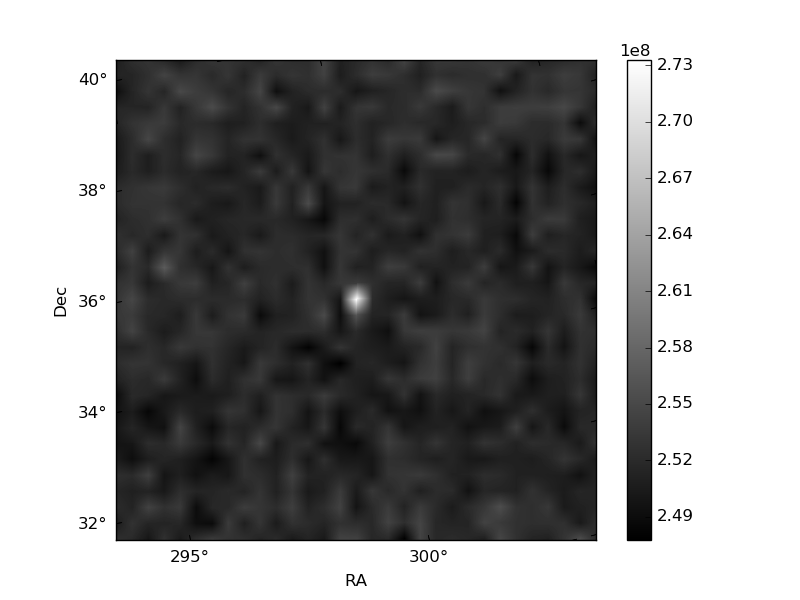
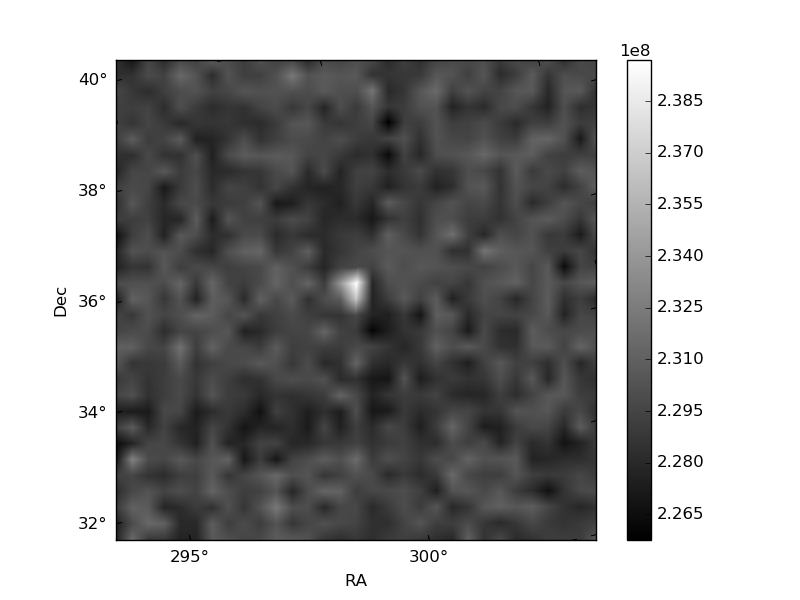
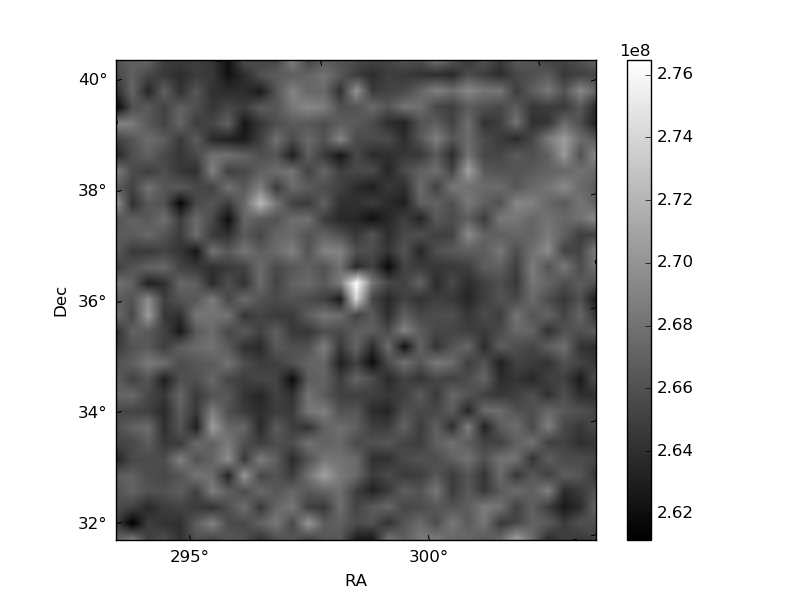
Histogram calculated using DETX and DETY for each event in the final _common_clean file
| Quadrant A | 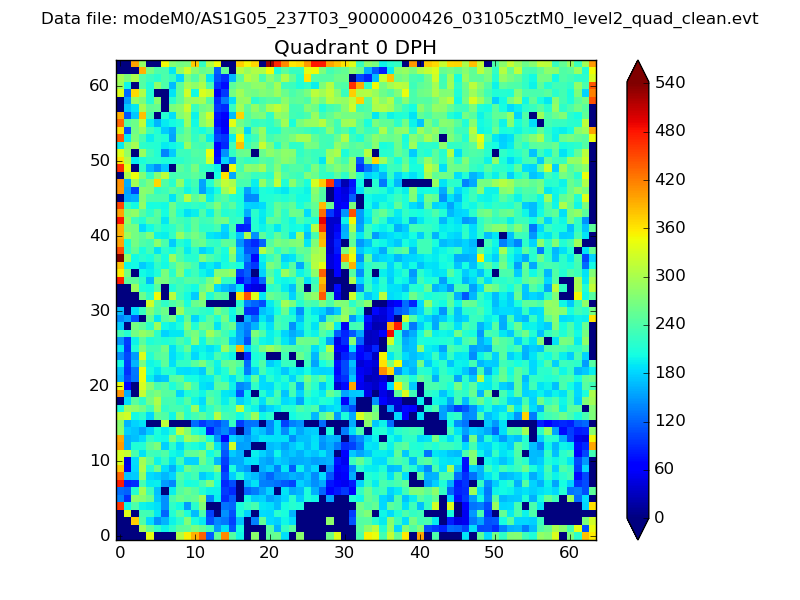 |
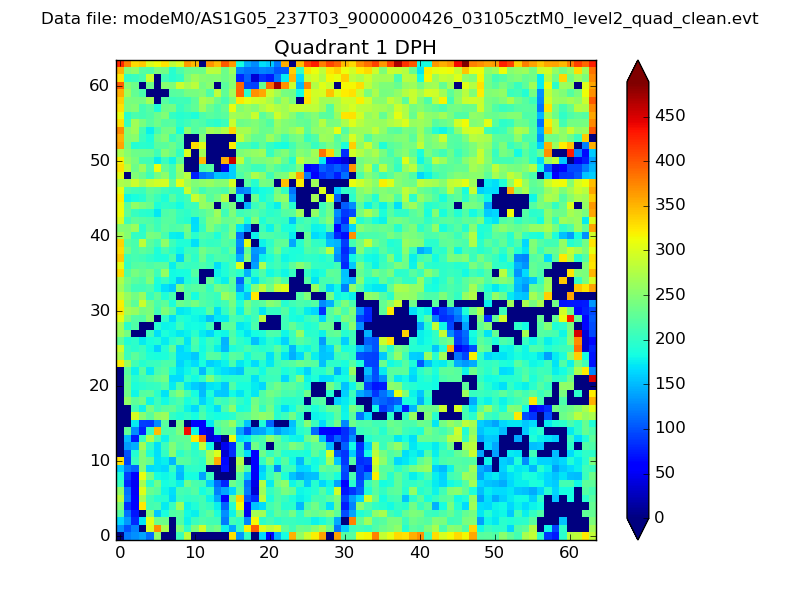 |
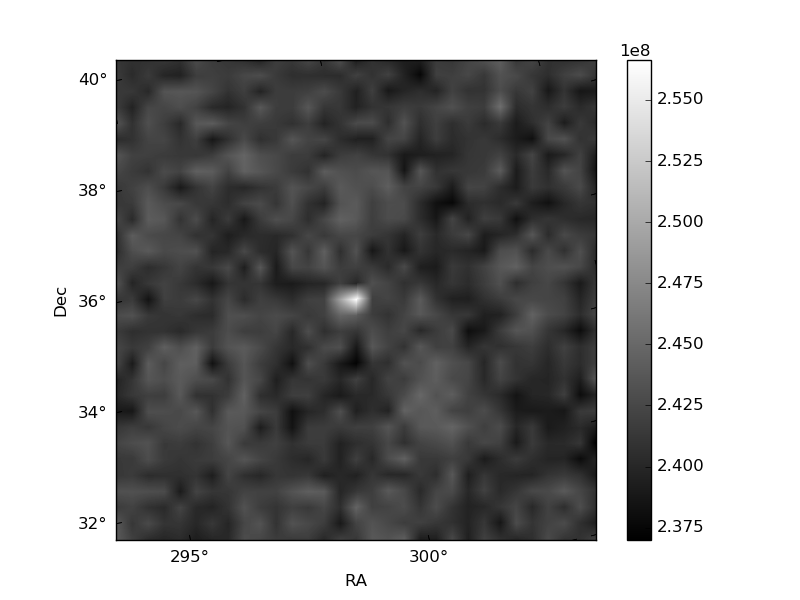
Quadrant B |
|---|---|---|---|
| Quadrant D | 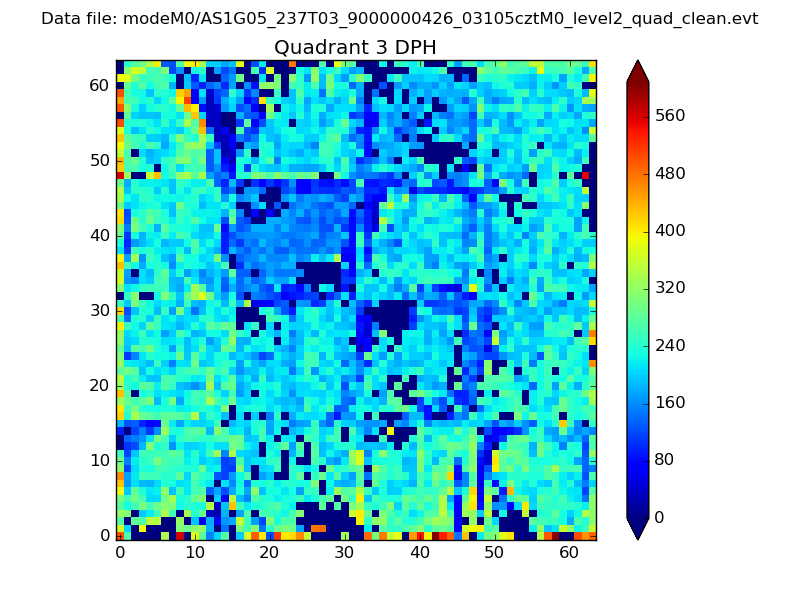 |
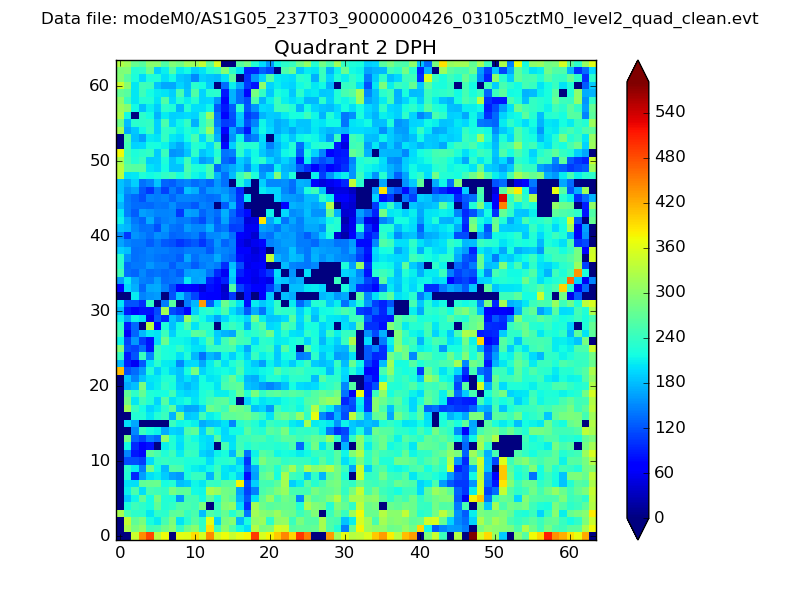 |
Quadrant C |
| Plot type | Count rate plots | Images |
|---|---|---|
| Comparison with Poisson distribution Blue bars denote a histogram of data divided into 1 sec bins. Red curve is a Poisson curve with rate = median count rate of data. |
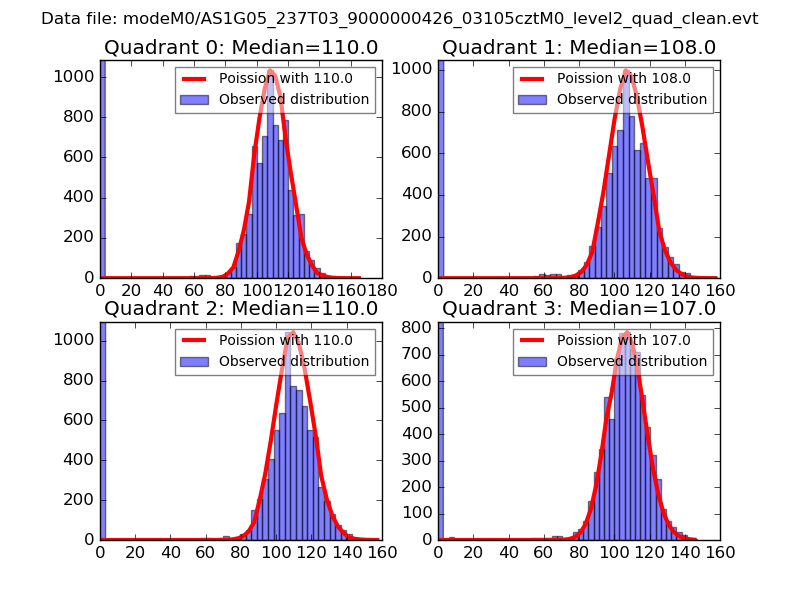 |
 |
| Quadrant-wise count rates Data is divided into 100 sec bins |
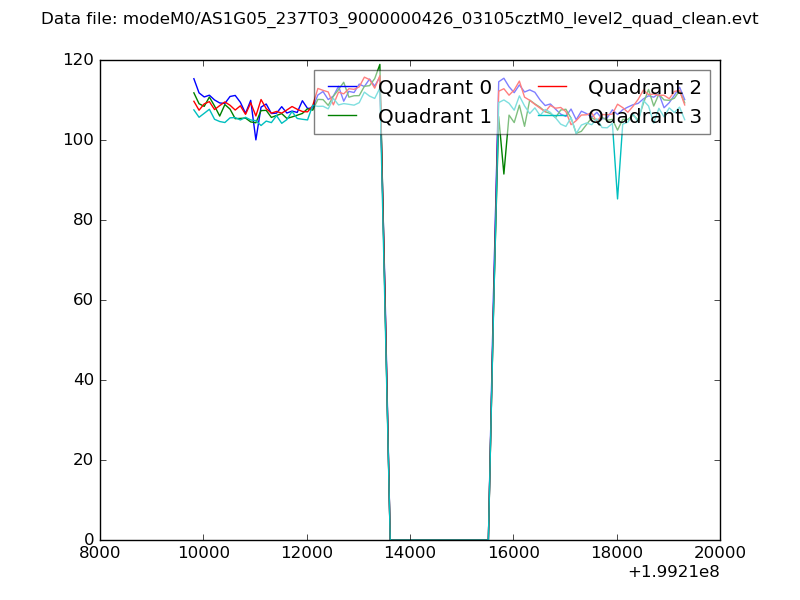 |
|
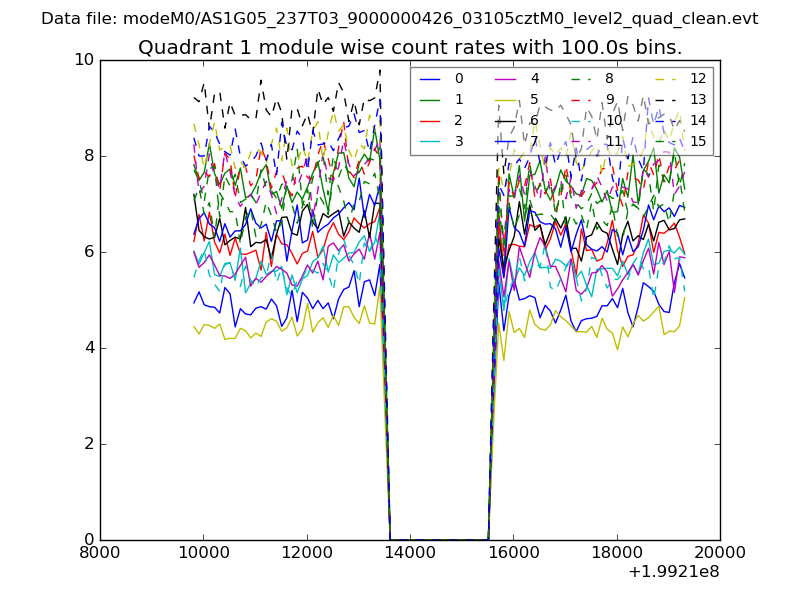
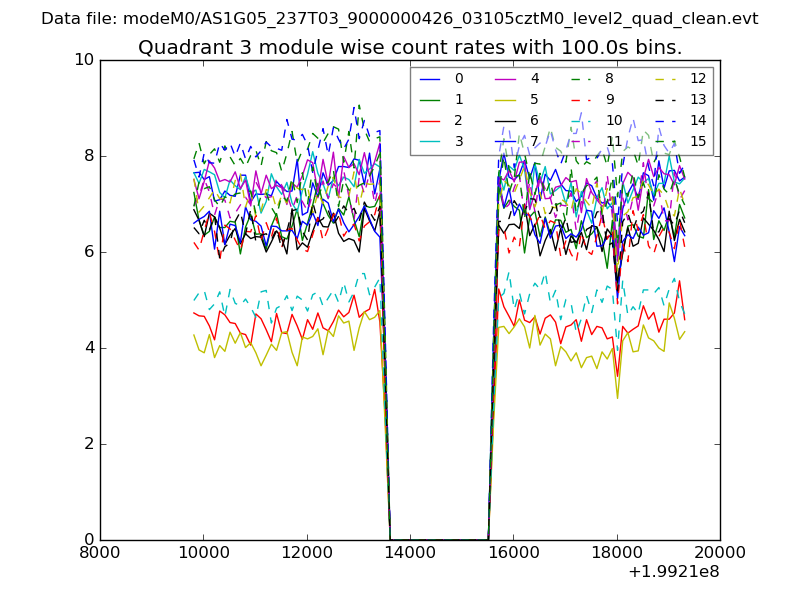
| Module-wise count rates for Quadrant A Data is divided into 100 sec bins |
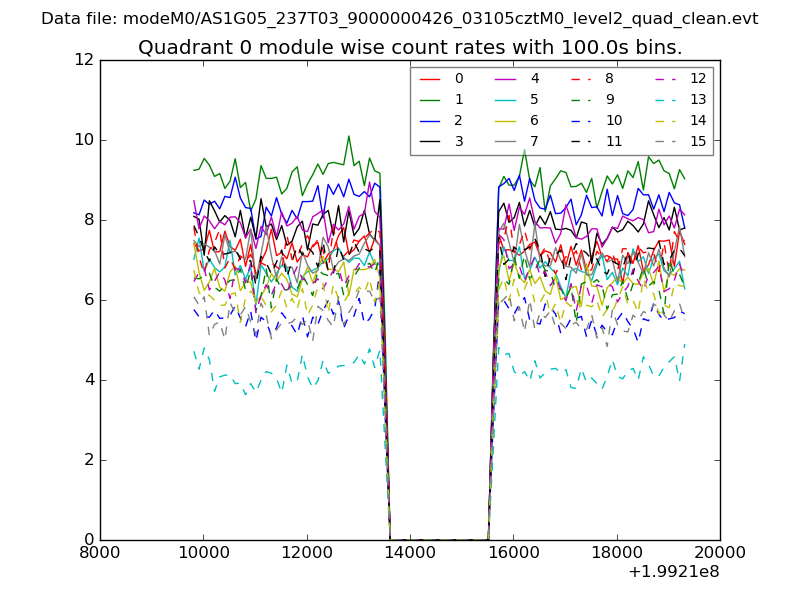 |
 |
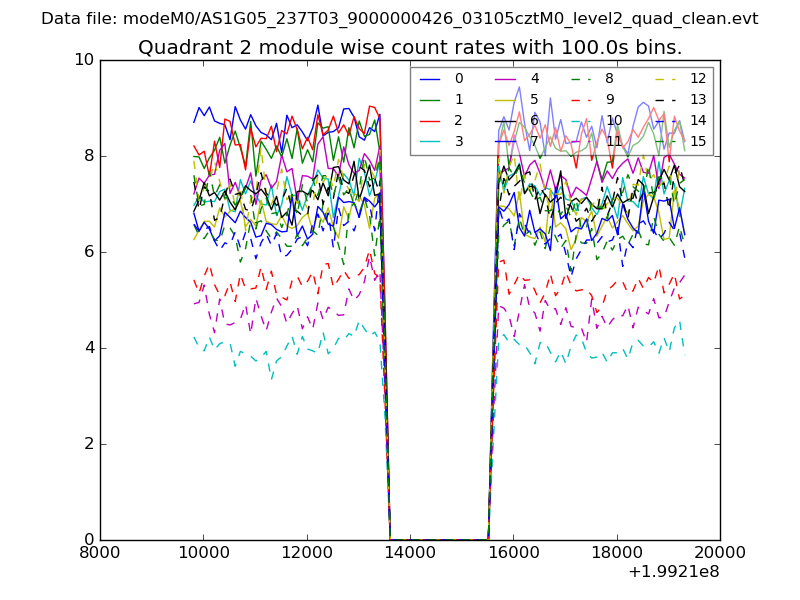
| Module-wise count rates for Quadrant B Data is divided into 100 sec bins |
 |
 |
| Module-wise count rates for Quadrant C Data is divided into 100 sec bins |
 |
 |
| Module-wise count rates for Quadrant D Data is divided into 100 sec bins |
 |
 |
| Parameter | Plot |
|---|---|
| CZT HV Monitor | 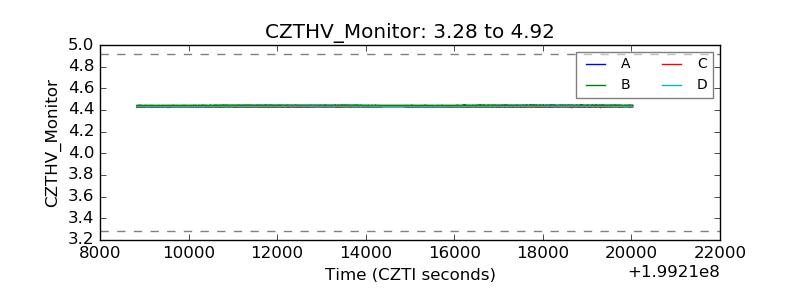 |
| D_VDD |  |
| Temperature 1 | 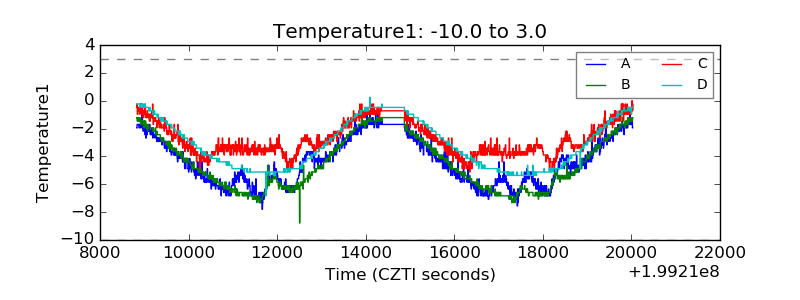 |
| Veto HV Monitor | 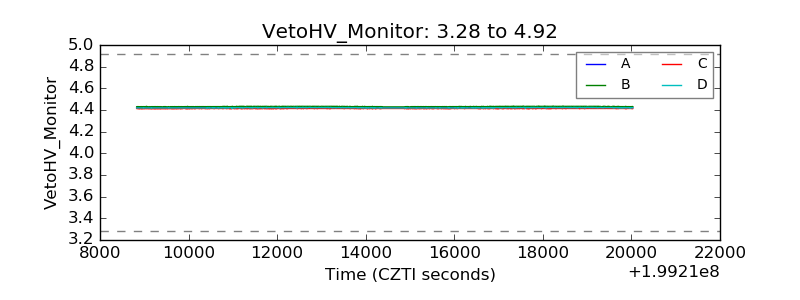 |
| Veto LLD | 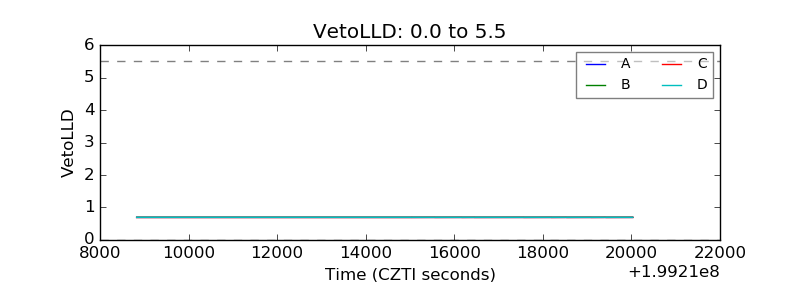 |
| Alpha Counter | 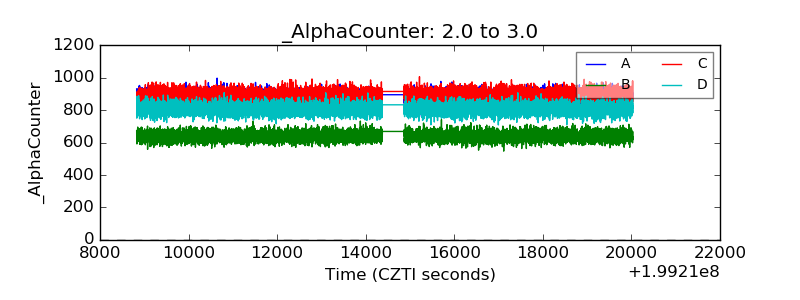 |
| _CPM_Rate | 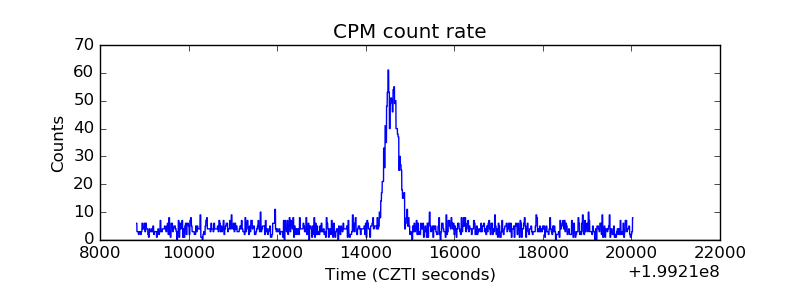 |
| CZT Counter | 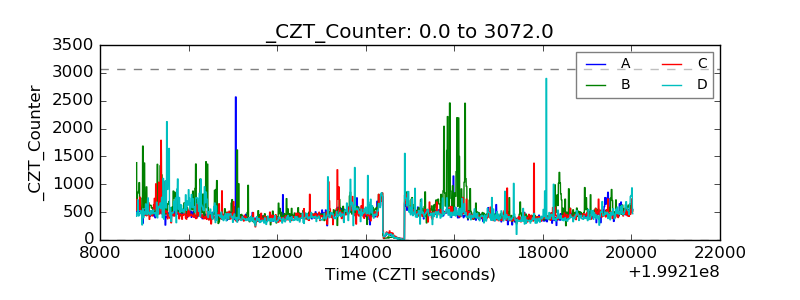 |
| +2.5 Volts monitor |  |
| +5 Volts monitor |  |
| _ROLL_ROT | 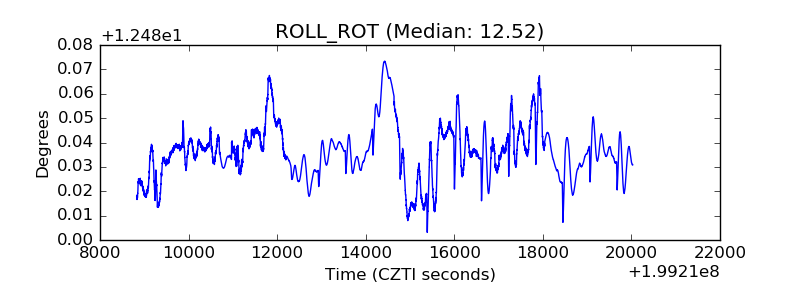 |
| _Roll_DEC | 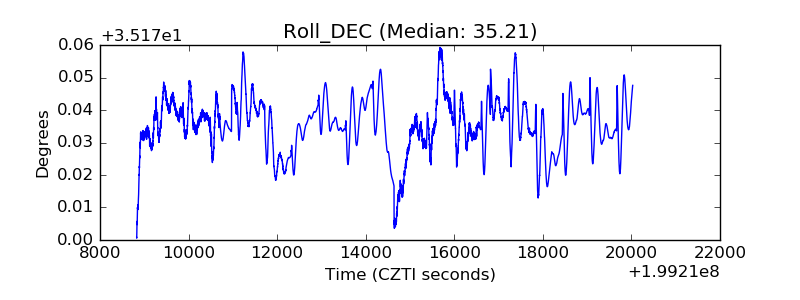 |
| _Roll_RA | 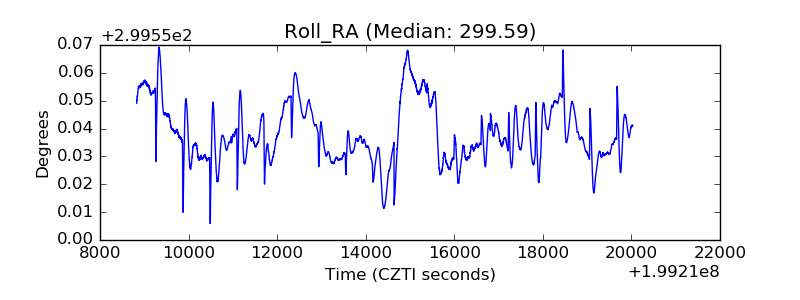 |
| Veto Counter | 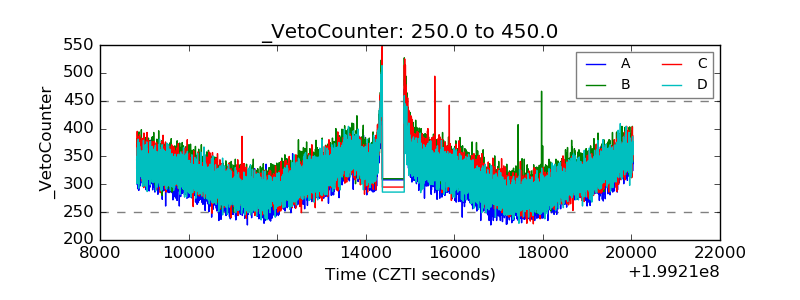 |