| Param | Original file | Final file |
|---|---|---|
| Filename | modeM0/AS1G05_237T03_9000000426_03106cztM0_level2.evt | modeM0/AS1G05_237T03_9000000426_03106cztM0_level2_quad_clean.evt |
| Size (bytes) | 591,632,640 | 101,283,840 |
| Size | 564.2 MB | 96.6 MB |
| Events in quadrant A | 3,980,034 | 628,103 |
| Events in quadrant B | 4,758,753 | 623,773 |
| Events in quadrant C | 4,248,043 | 626,536 |
| Events in quadrant D | 4,360,354 | 604,589 |
| Mode M9 | |||
|---|---|---|---|
| Quadrant | BADHDUFLAG | Total packets | Discarded packets |
| A | 0 | 15 | 0 |
| B | 0 | 15 | 0 |
| C | 0 | 15 | 0 |
| D | 0 | 15 | 0 |
| Mode M0 | |||
|---|---|---|---|
| Quadrant | BADHDUFLAG | Total packets | Discarded packets |
| A | 0 | 17544 | 3 |
| B | 0 | 19866 | 2 |
| C | 0 | 18424 | 2 |
| D | 0 | 18871 | 2 |
| Mode SS | |||
|---|---|---|---|
| Quadrant | BADHDUFLAG | Total packets | Discarded packets |
| A | 0 | 172 | 0 |
| B | 0 | 172 | 0 |
| C | 0 | 172 | 0 |
| D | 0 | 172 | 0 |
| Quadrant | Total seconds | Saturated seconds | Saturation percentage |
|---|---|---|---|
| A | 8410 | 25 | 0.297265% |
| B | 8410 | 146 | 1.736029% |
| C | 8410 | 94 | 1.117717% |
| D | 8410 | 111 | 1.319857% |
Noise dominated data is calculated using 1-second bins in cleaned event files. If a bin has >2000 counts, and if more than 50% of those come from <1% of pixels, then it is considered to be noise-dominated and hence unusable.
| Quadrant | # 1 sec bins | Bins with >0 counts | Bins with >2000 counts | High rate bins dominated by noise | Noise dominated (total time) | Noise dominated (detector-on time) | Marked lightcurve |
|---|---|---|---|---|---|---|---|
| A | 9935 | 8412 | 2 | 2 | 0.02% | 0.02% | 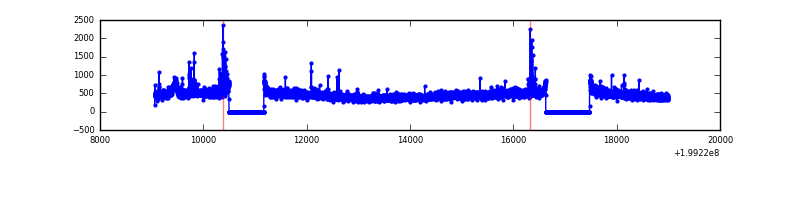 |
| B | 9935 | 8412 | 30 | 30 | 0.30% | 0.36% | 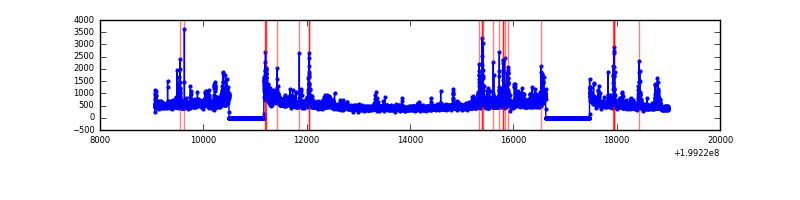 |
| C | 9935 | 8412 | 42 | 42 | 0.42% | 0.50% | 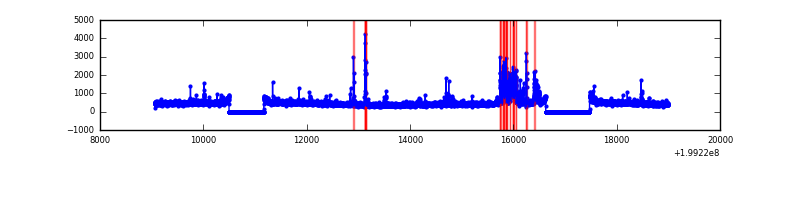 |
| D | 9935 | 8412 | 71 | 71 | 0.71% | 0.84% | 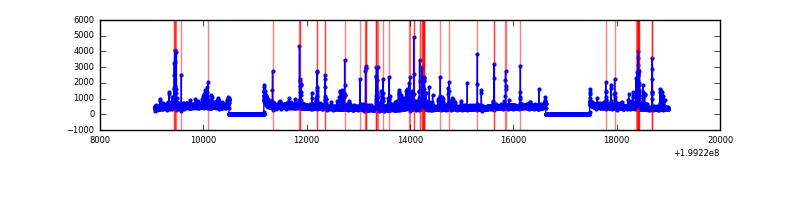 |
Top three noisy pixels from each quadrant. If the there are fewer than three noisy pixels in the level2.evt file, extra rows are filled as -1
| Pixel properties | Quadrant properties | ||||||
|---|---|---|---|---|---|---|---|
| Quadrant | DetID | PixID | Counts | Sigma | Mean | Median | Sigma |
| A | 0 | 5 | 81027 | 393.27 | 978 | 955 | 203.6 |
| A | 8 | 15 | 72781 | 352.77 | 978 | 955 | 203.6 |
| A | 0 | 226 | 18042 | 83.92 | 978 | 955 | 203.6 |
| B | 15 | 204 | 336428 | 1761.12 | 989 | 967 | 190.5 |
| B | 0 | 219 | 258571 | 1352.38 | 989 | 967 | 190.5 |
| B | 1 | 223 | 135122 | 704.29 | 989 | 967 | 190.5 |
| C | 1 | 192 | 354696 | 1596.2 | 948 | 955 | 221.6 |
| C | 6 | 80 | 66129 | 294.09 | 948 | 955 | 221.6 |
| C | 0 | 219 | 48485 | 214.47 | 948 | 955 | 221.6 |
| D | 13 | 223 | 231657 | 993.58 | 936 | 914 | 232.2 |
| D | 13 | 239 | 206198 | 883.96 | 936 | 914 | 232.2 |
| D | 13 | 114 | 197223 | 845.31 | 936 | 914 | 232.2 |
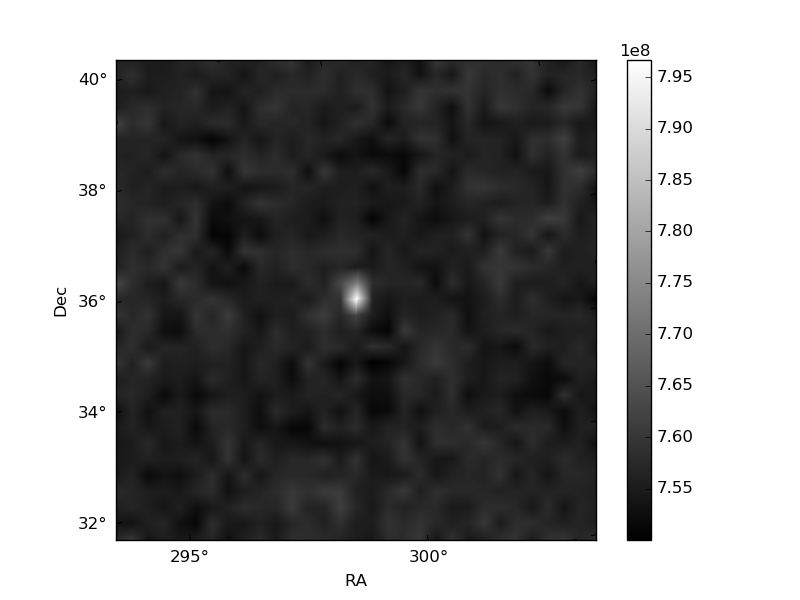
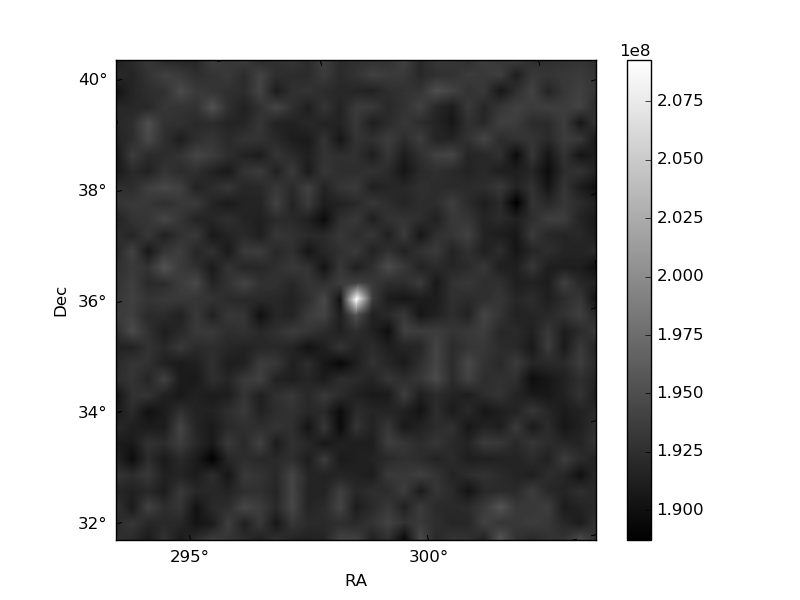
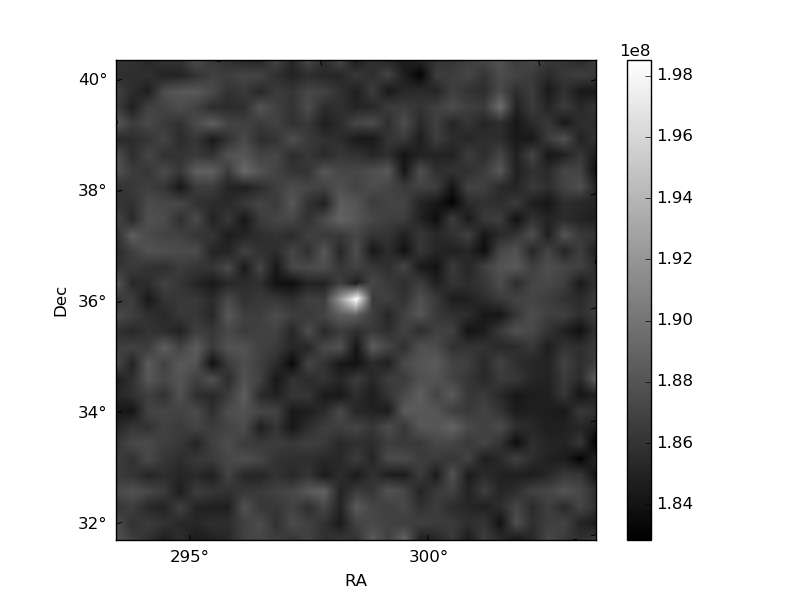
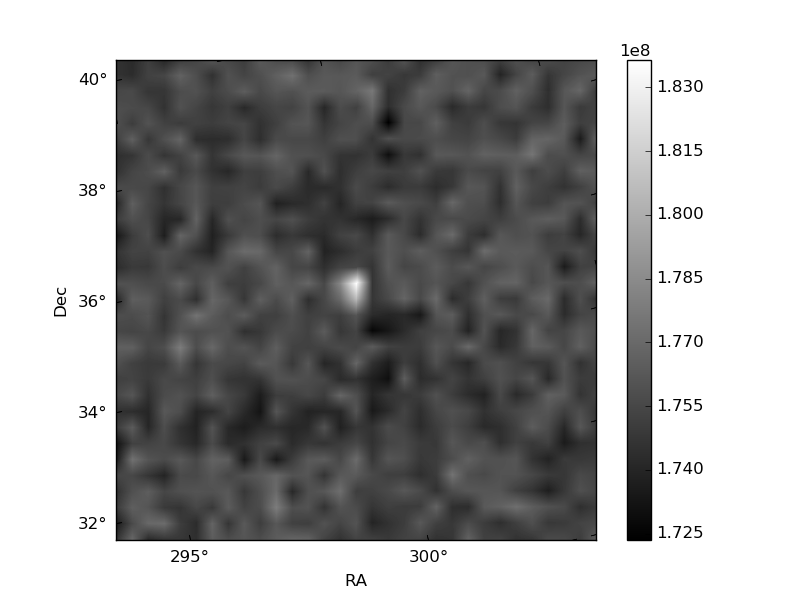
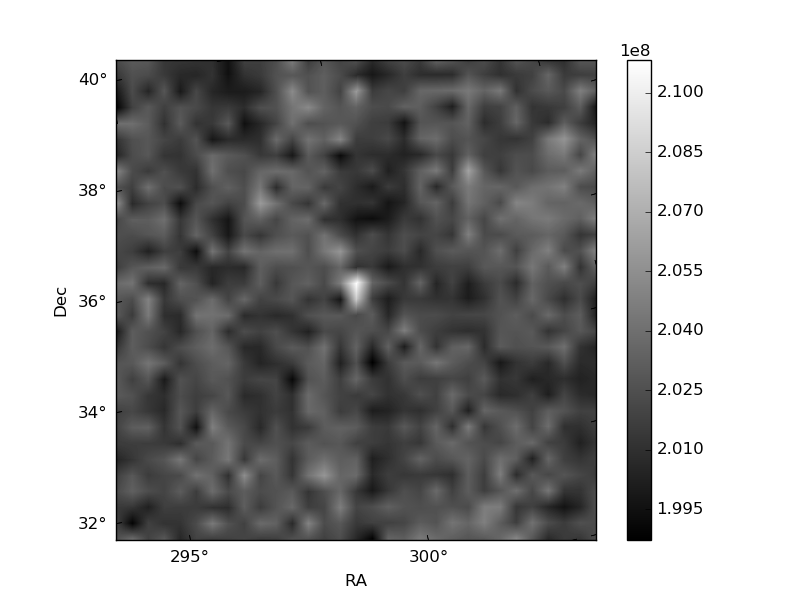
Histogram calculated using DETX and DETY for each event in the final _common_clean file
| Quadrant A | 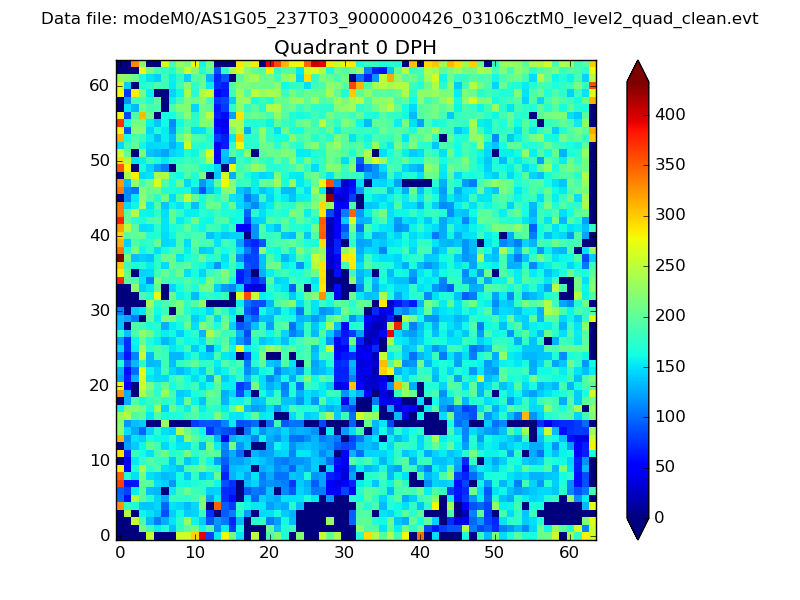 |
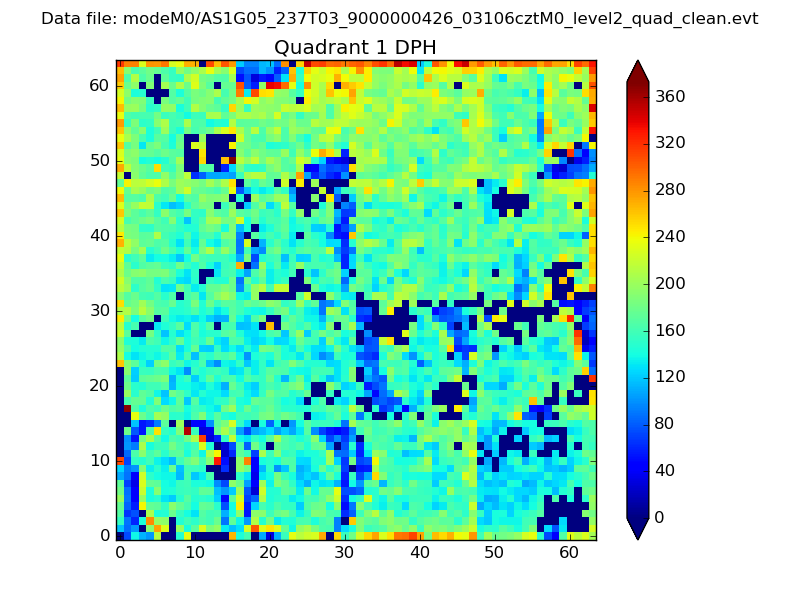 |
Quadrant B |
|---|---|---|---|
| Quadrant D | 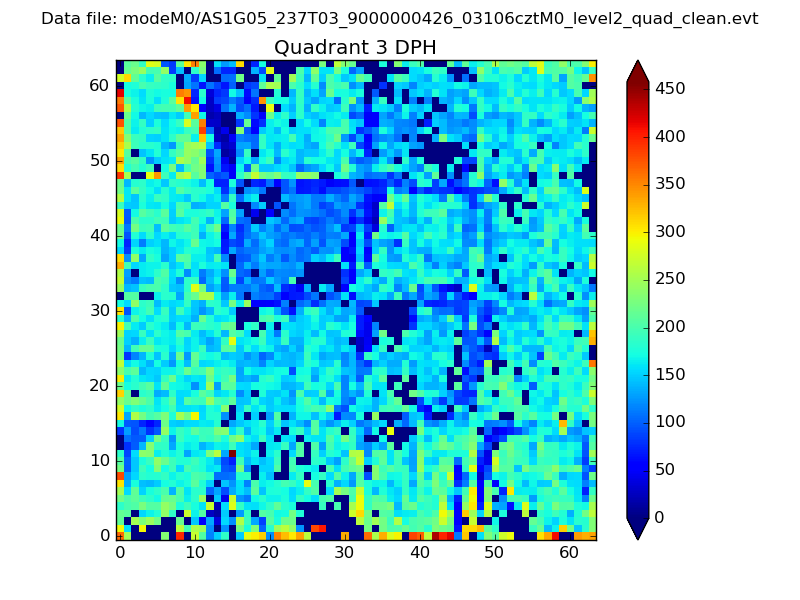 |
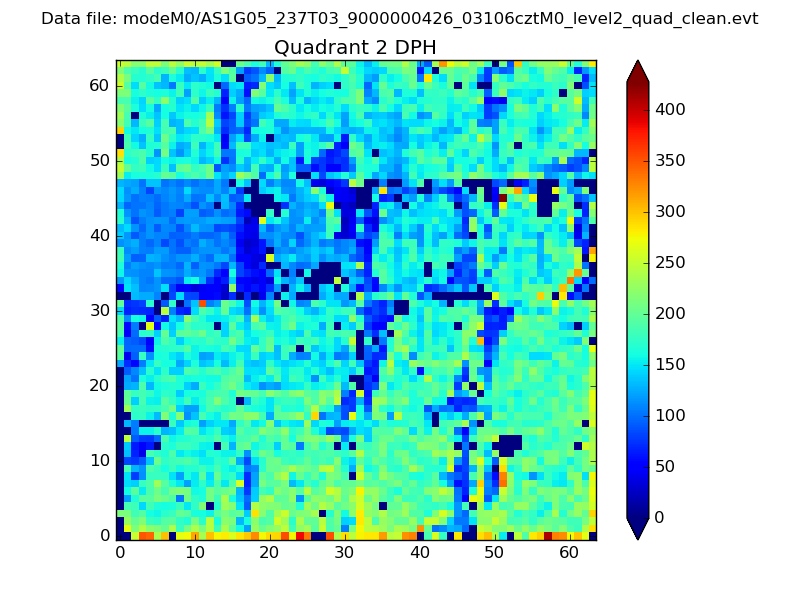 |
Quadrant C |
| Plot type | Count rate plots | Images |
|---|---|---|
| Comparison with Poisson distribution Blue bars denote a histogram of data divided into 1 sec bins. Red curve is a Poisson curve with rate = median count rate of data. |
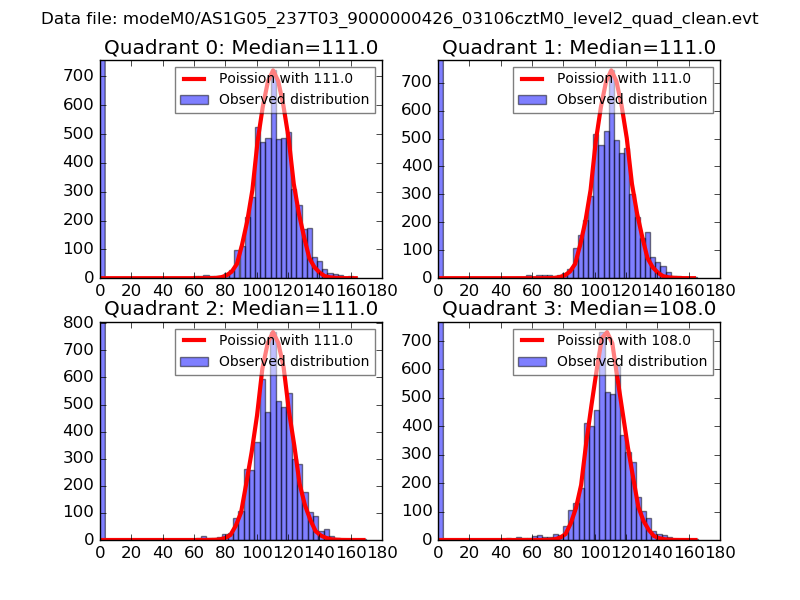 |
 |
| Quadrant-wise count rates Data is divided into 100 sec bins |
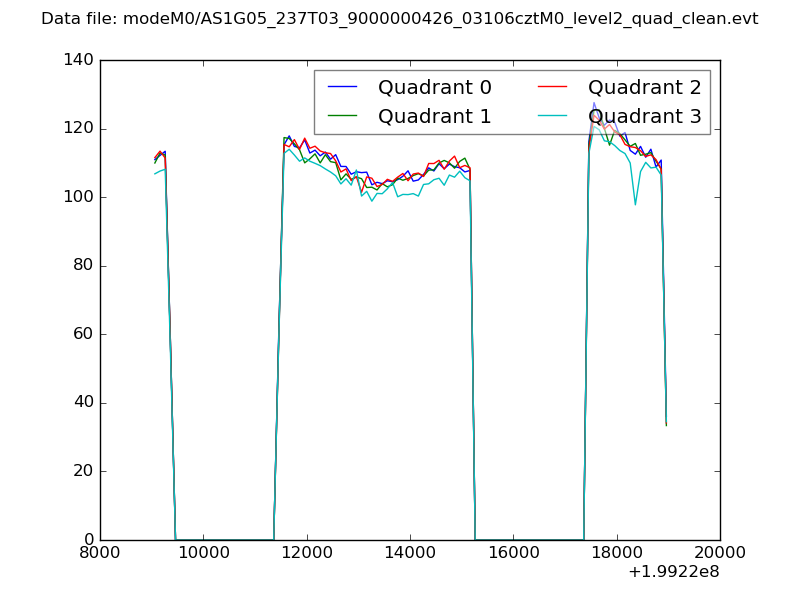 |
|
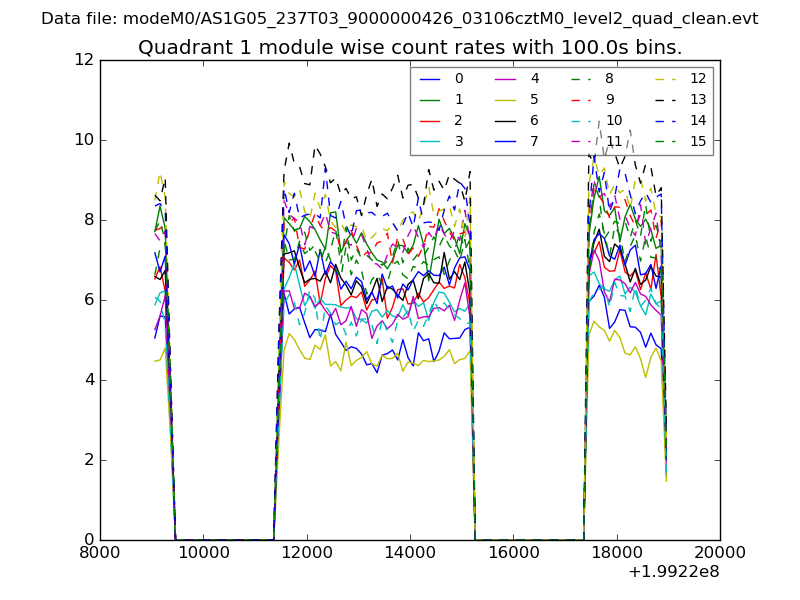
| Module-wise count rates for Quadrant A Data is divided into 100 sec bins |
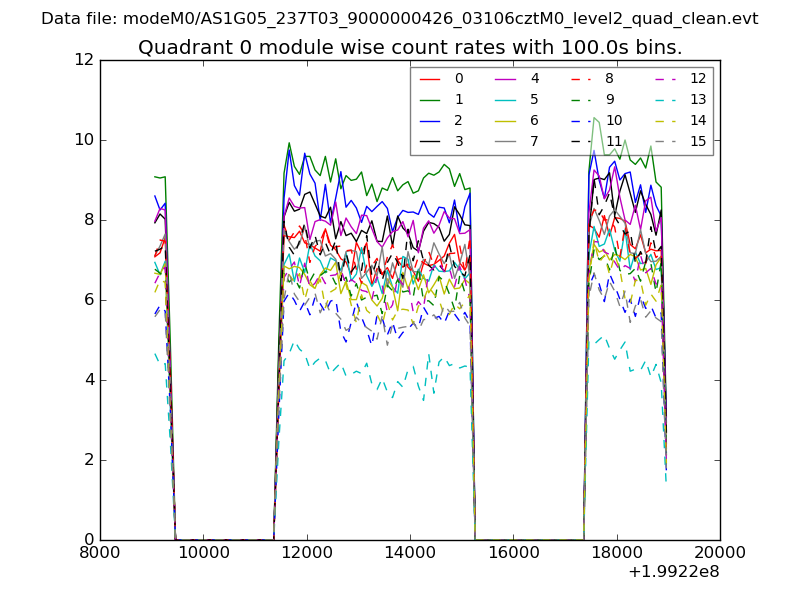 |
 |
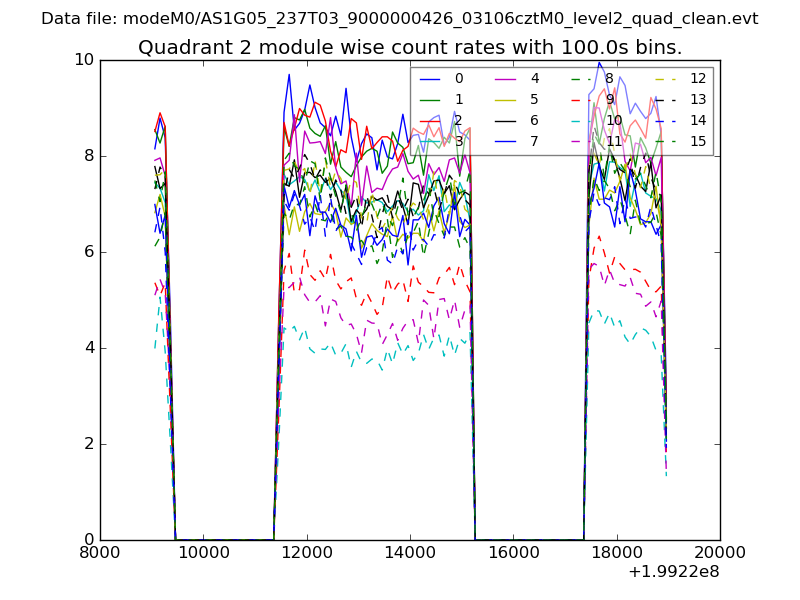
| Module-wise count rates for Quadrant B Data is divided into 100 sec bins |
 |
 |
| Module-wise count rates for Quadrant C Data is divided into 100 sec bins |
 |
 |
| Module-wise count rates for Quadrant D Data is divided into 100 sec bins |
 |
 |
| Parameter | Plot |
|---|---|
| CZT HV Monitor | 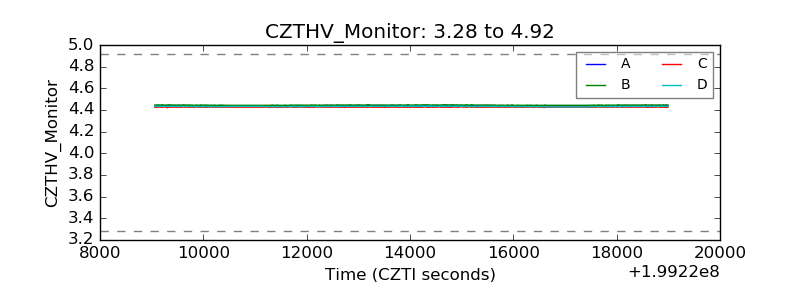 |
| D_VDD | 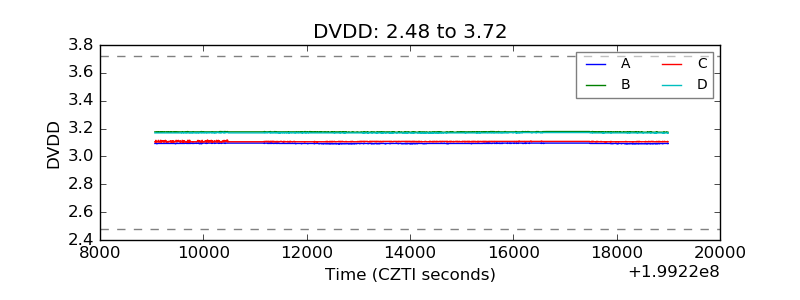 |
| Temperature 1 | 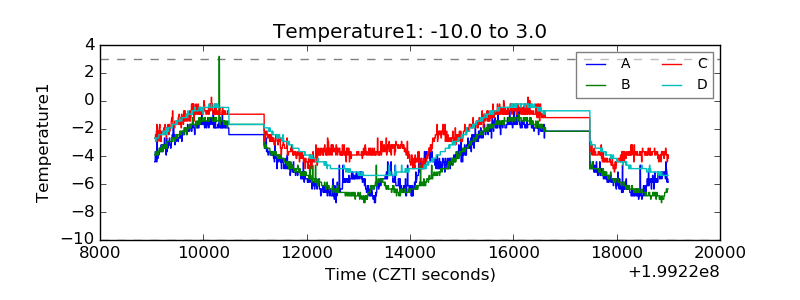 |
| Veto HV Monitor | 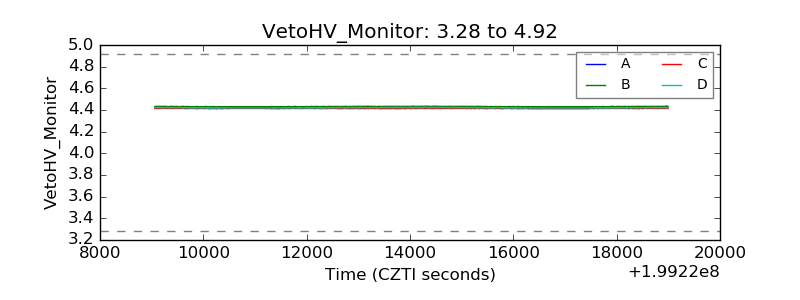 |
| Veto LLD | 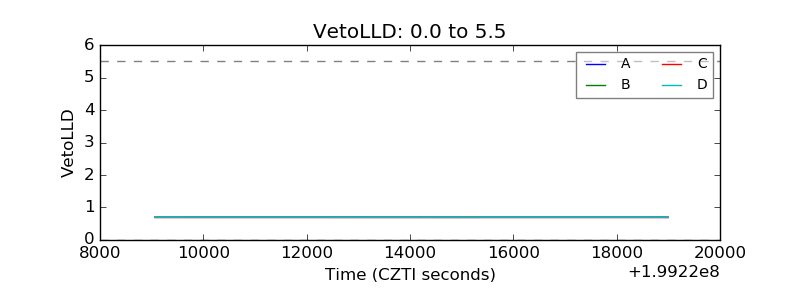 |
| Alpha Counter | 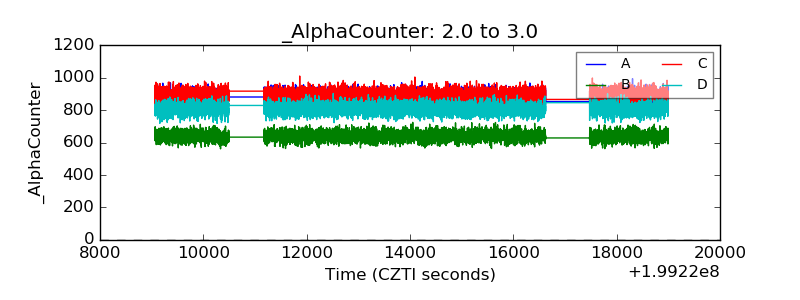 |
| _CPM_Rate | 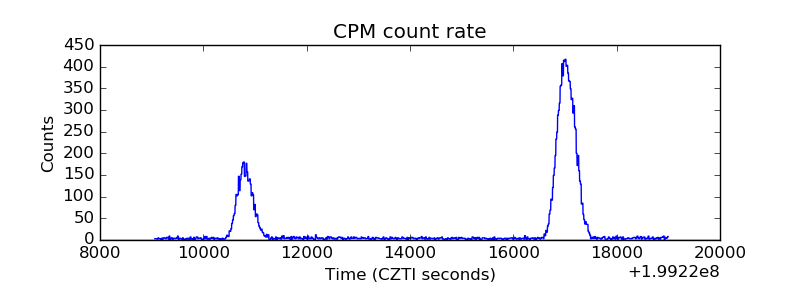 |
| CZT Counter | 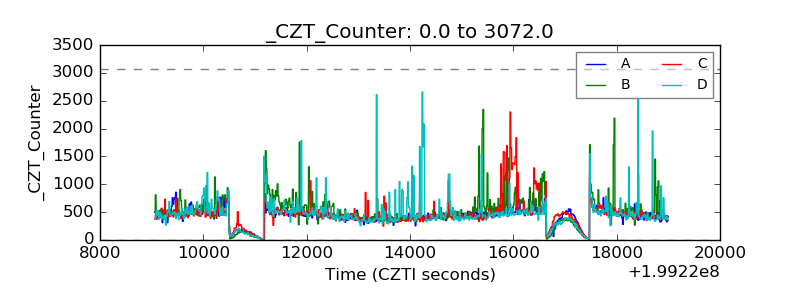 |
| +2.5 Volts monitor | 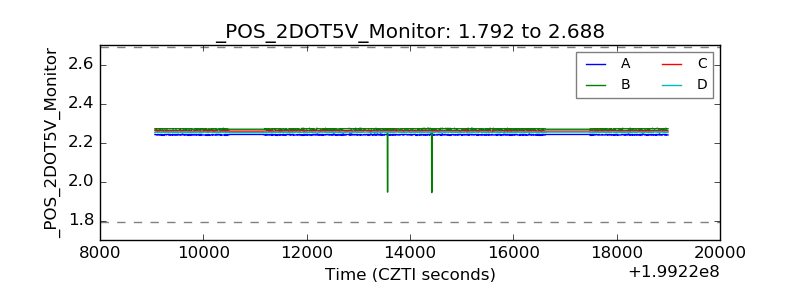 |
| +5 Volts monitor | 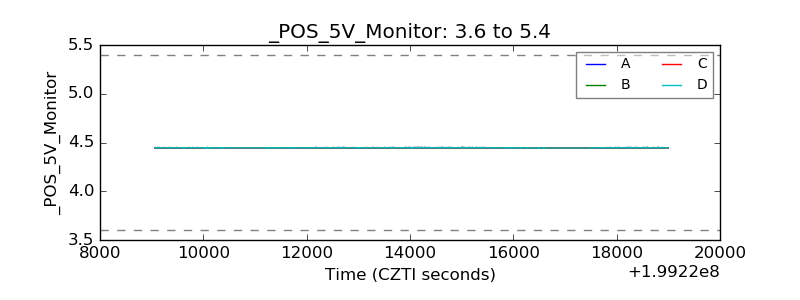 |
| _ROLL_ROT | 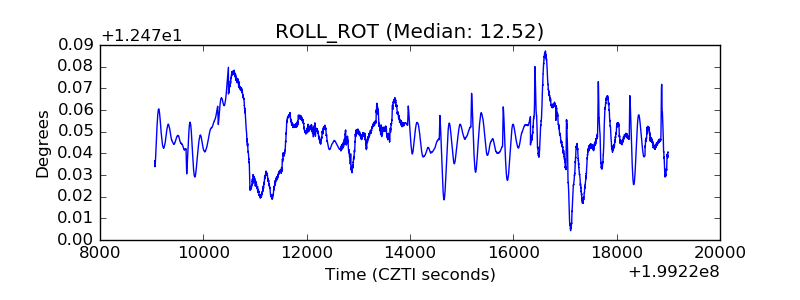 |
| _Roll_DEC | 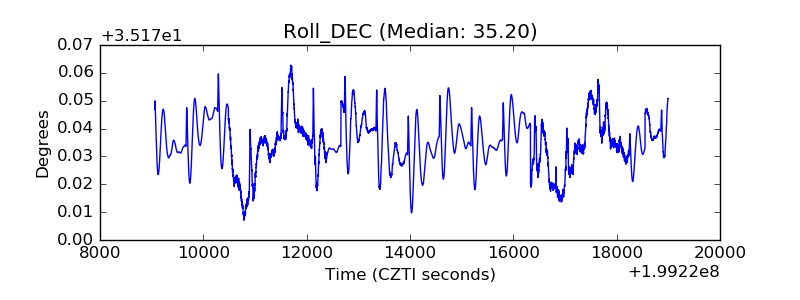 |
| _Roll_RA | 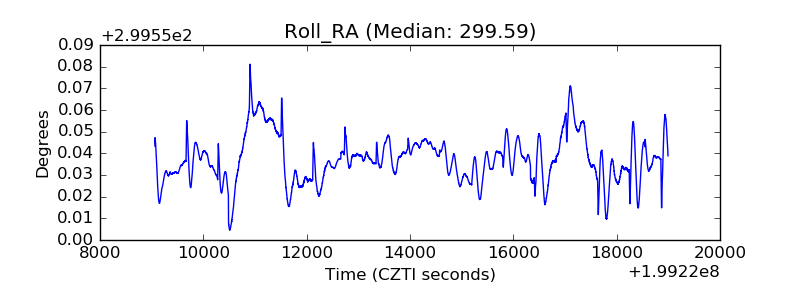 |
| Veto Counter | 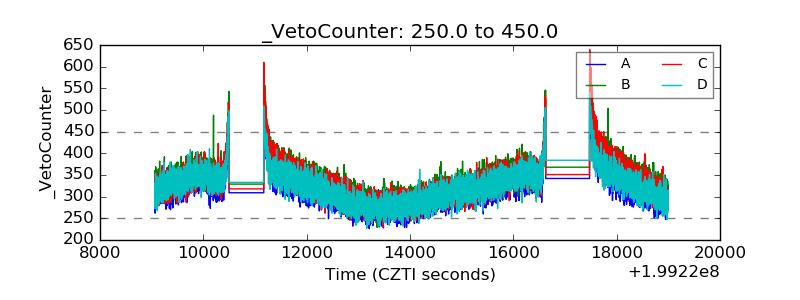 |