| Param | Original file | Final file |
|---|---|---|
| Filename | modeM0/AS1G05_237T03_9000000426_03107cztM0_level2.evt | modeM0/AS1G05_237T03_9000000426_03107cztM0_level2_quad_clean.evt |
| Size (bytes) | 450,328,320 | 90,250,560 |
| Size | 429.5 MB | 86.1 MB |
| Events in quadrant A | 3,016,347 | 571,991 |
| Events in quadrant B | 3,417,376 | 570,250 |
| Events in quadrant C | 3,087,505 | 575,245 |
| Events in quadrant D | 3,664,448 | 551,518 |
| Mode M9 | |||
|---|---|---|---|
| Quadrant | BADHDUFLAG | Total packets | Discarded packets |
| A | 0 | 12 | 0 |
| B | 0 | 12 | 0 |
| C | 0 | 12 | 0 |
| D | 0 | 13 | 0 |
| Mode M0 | |||
|---|---|---|---|
| Quadrant | BADHDUFLAG | Total packets | Discarded packets |
| A | 0 | 13688 | 3 |
| B | 0 | 14777 | 2 |
| C | 0 | 13903 | 2 |
| D | 0 | 15895 | 2 |
| Mode SS | |||
|---|---|---|---|
| Quadrant | BADHDUFLAG | Total packets | Discarded packets |
| A | 0 | 136 | 0 |
| B | 0 | 136 | 0 |
| C | 0 | 136 | 0 |
| D | 0 | 136 | 0 |
| Quadrant | Total seconds | Saturated seconds | Saturation percentage |
|---|---|---|---|
| A | 6652 | 29 | 0.435959% |
| B | 6652 | 39 | 0.586290% |
| C | 6652 | 32 | 0.481058% |
| D | 6652 | 256 | 3.848467% |
Noise dominated data is calculated using 1-second bins in cleaned event files. If a bin has >2000 counts, and if more than 50% of those come from <1% of pixels, then it is considered to be noise-dominated and hence unusable.
| Quadrant | # 1 sec bins | Bins with >0 counts | Bins with >2000 counts | High rate bins dominated by noise | Noise dominated (total time) | Noise dominated (detector-on time) | Marked lightcurve |
|---|---|---|---|---|---|---|---|
| A | 7682 | 6653 | 3 | 3 | 0.04% | 0.05% | 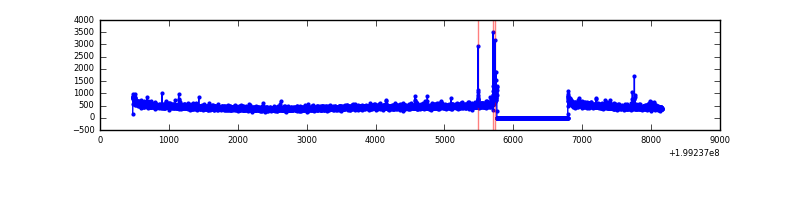 |
| B | 7682 | 6653 | 9 | 9 | 0.12% | 0.14% | 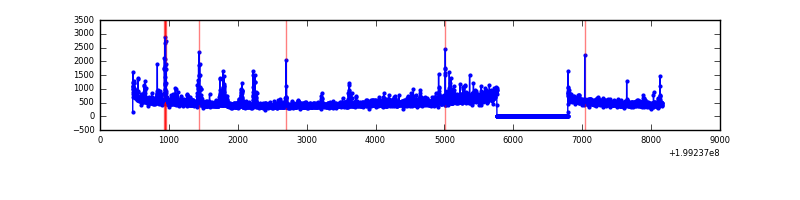 |
| C | 7682 | 6653 | 9 | 9 | 0.12% | 0.14% | 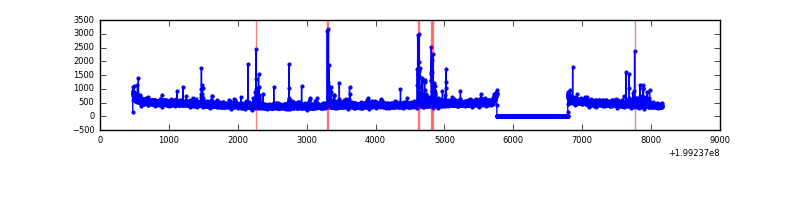 |
| D | 7682 | 6653 | 159 | 159 | 2.07% | 2.39% | 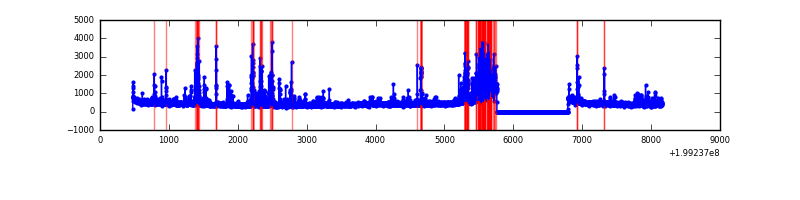 |
Top three noisy pixels from each quadrant. If the there are fewer than three noisy pixels in the level2.evt file, extra rows are filled as -1
| Pixel properties | Quadrant properties | ||||||
|---|---|---|---|---|---|---|---|
| Quadrant | DetID | PixID | Counts | Sigma | Mean | Median | Sigma |
| A | 0 | 31 | 45646 | 288.14 | 757 | 743 | 155.8 |
| A | 13 | 14 | 20640 | 127.68 | 757 | 743 | 155.8 |
| A | 8 | 15 | 11091 | 66.4 | 757 | 743 | 155.8 |
| B | 0 | 219 | 112755 | 754.68 | 774 | 758 | 148.4 |
| B | 10 | 244 | 72710 | 484.84 | 774 | 758 | 148.4 |
| B | 15 | 204 | 65994 | 439.59 | 774 | 758 | 148.4 |
| C | 6 | 80 | 117849 | 674.43 | 740 | 744 | 173.6 |
| C | 5 | 250 | 30056 | 168.81 | 740 | 744 | 173.6 |
| C | 14 | 223 | 16449 | 90.45 | 740 | 744 | 173.6 |
| D | 13 | 120 | 501728 | 2821.7 | 717 | 700 | 177.6 |
| D | 13 | 223 | 130805 | 732.73 | 717 | 700 | 177.6 |
| D | 13 | 239 | 129926 | 727.78 | 717 | 700 | 177.6 |
Histogram calculated using DETX and DETY for each event in the final _common_clean file
| Quadrant A | 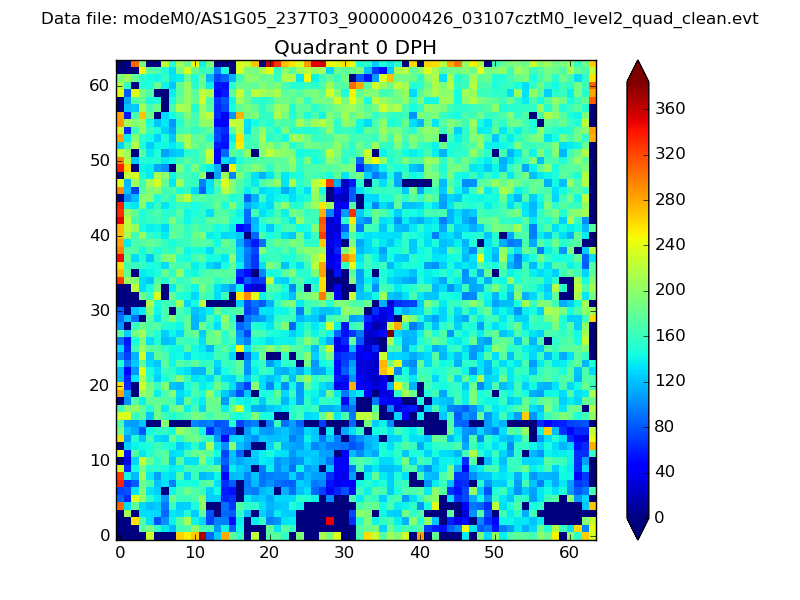 |
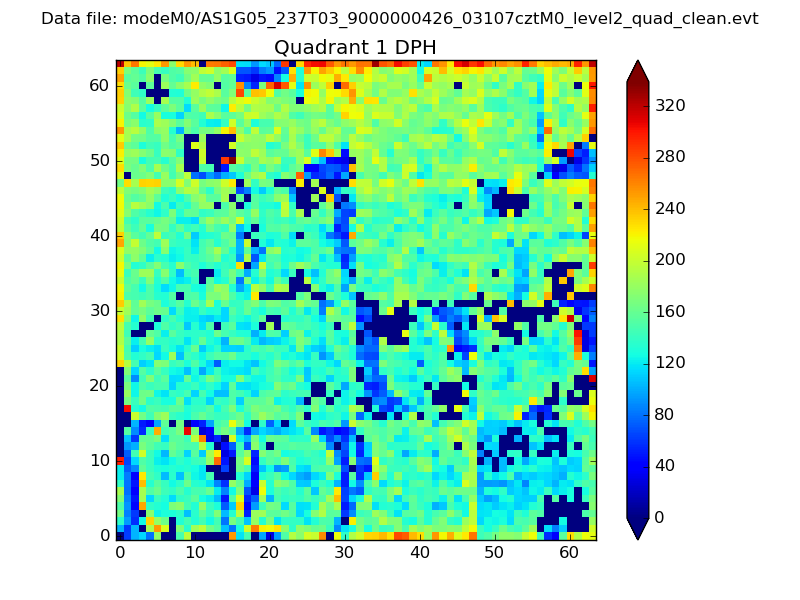 |
Quadrant B |
|---|---|---|---|
| Quadrant D | 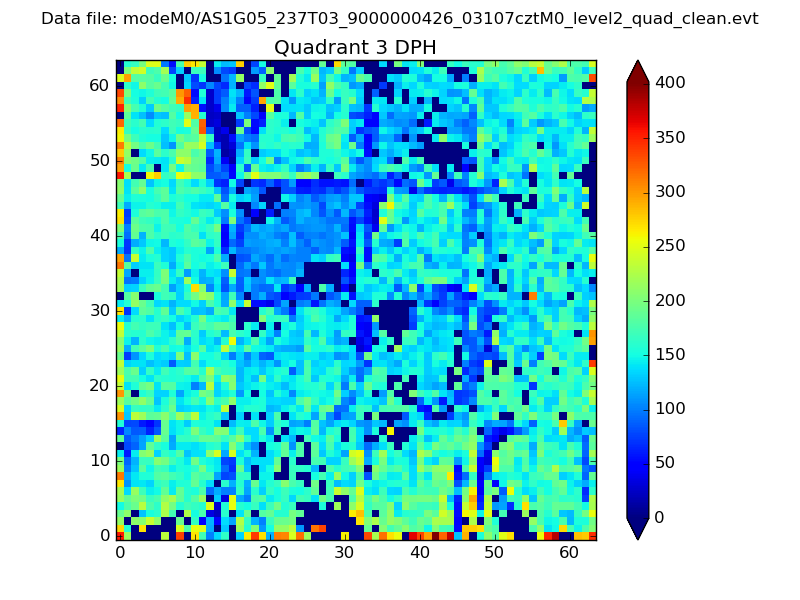 |
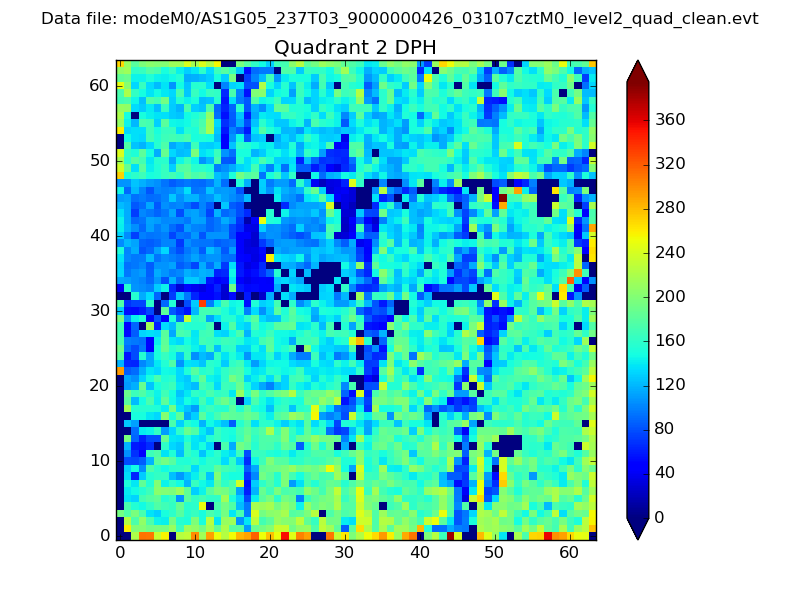 |
Quadrant C |
| Plot type | Count rate plots | Images |
|---|---|---|
| Comparison with Poisson distribution Blue bars denote a histogram of data divided into 1 sec bins. Red curve is a Poisson curve with rate = median count rate of data. |
 |
 |
| Quadrant-wise count rates Data is divided into 100 sec bins |
 |
|
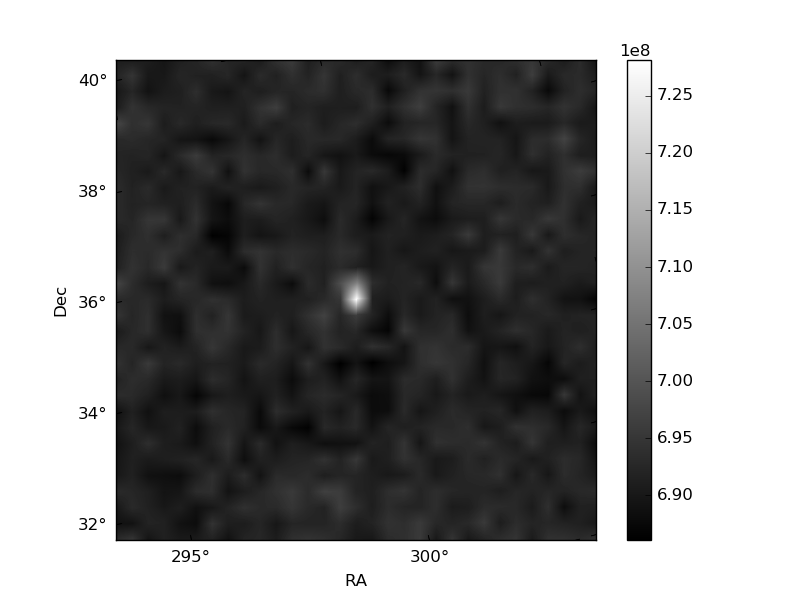
| Module-wise count rates for Quadrant A Data is divided into 100 sec bins |
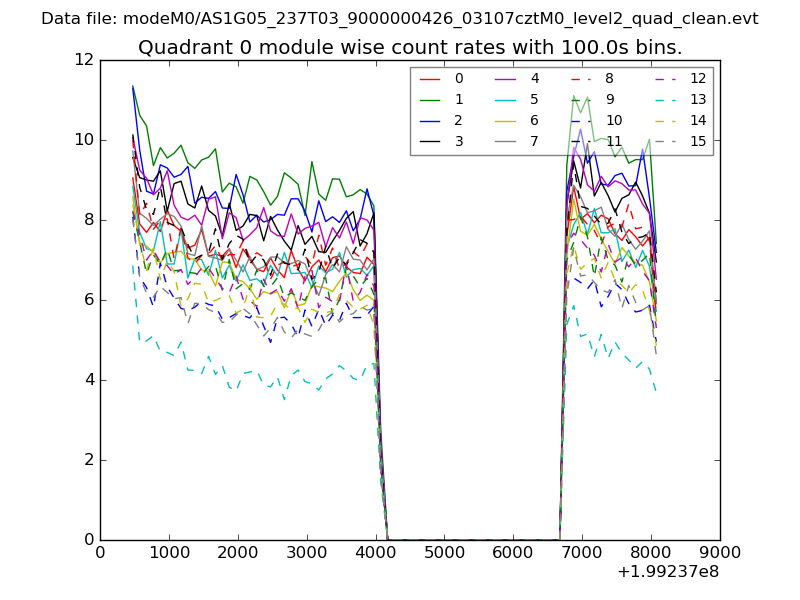 |
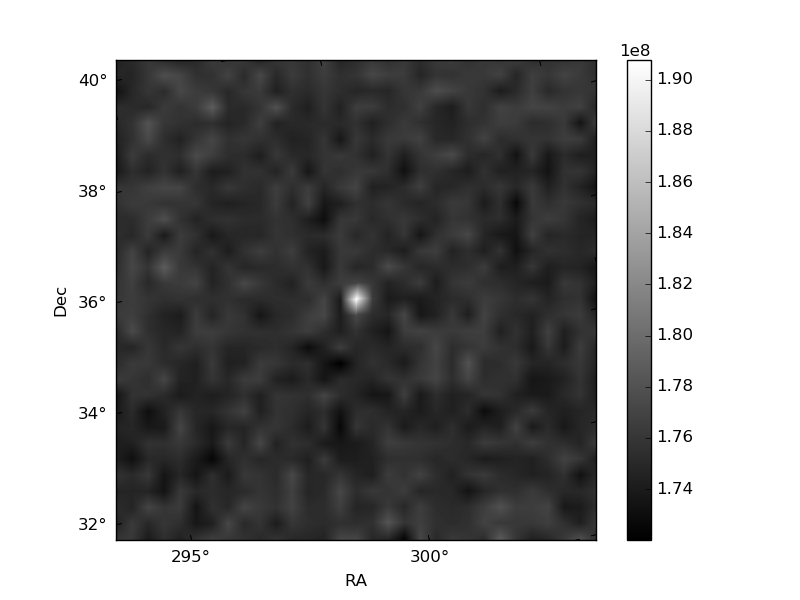 |
| Module-wise count rates for Quadrant B Data is divided into 100 sec bins |
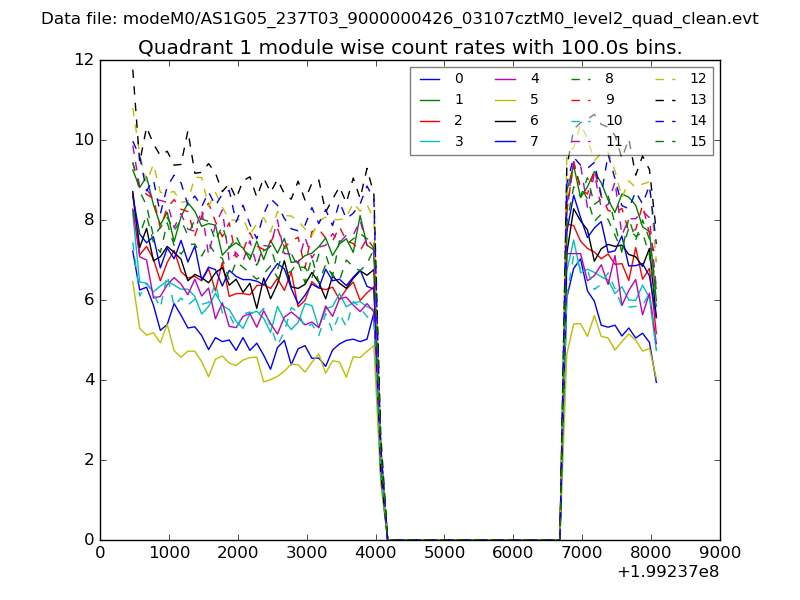 |
 |
| Module-wise count rates for Quadrant C Data is divided into 100 sec bins |
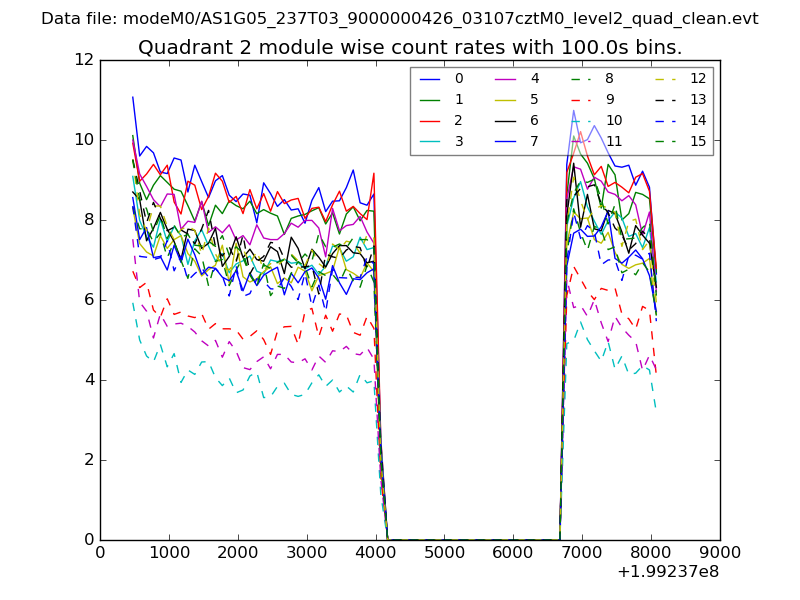 |
 |
| Module-wise count rates for Quadrant D Data is divided into 100 sec bins |
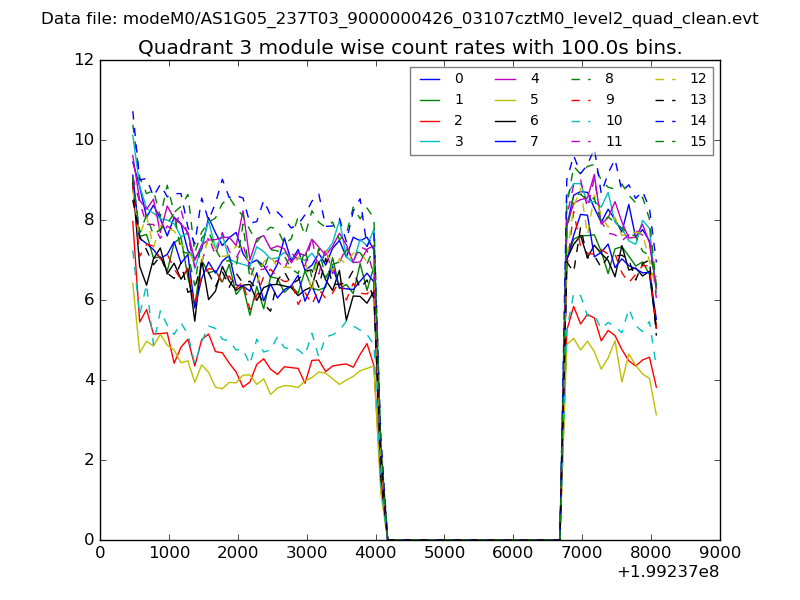 |
 |
| Parameter | Plot |
|---|---|
| CZT HV Monitor |  |
| D_VDD | 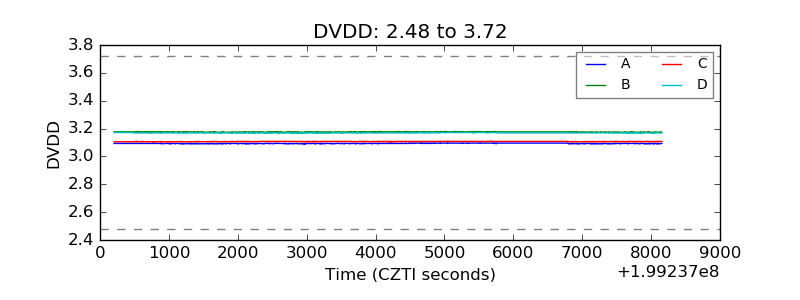 |
| Temperature 1 | 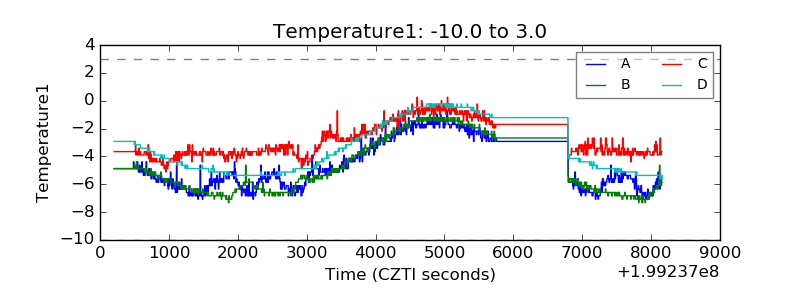 |
| Veto HV Monitor | 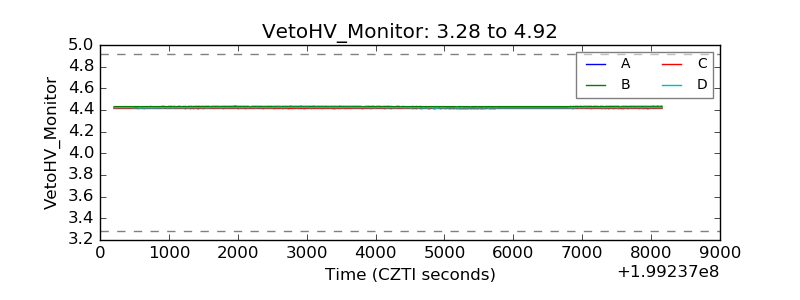 |
| Veto LLD | 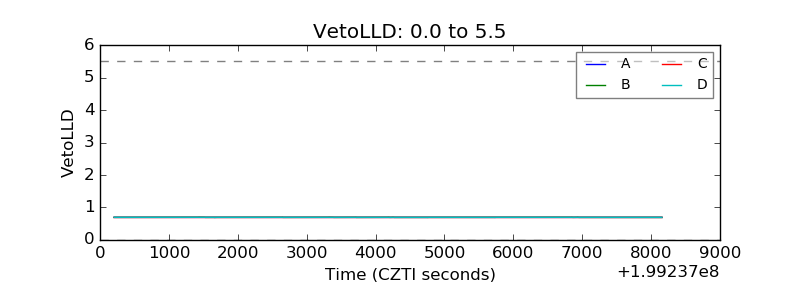 |
| Alpha Counter | 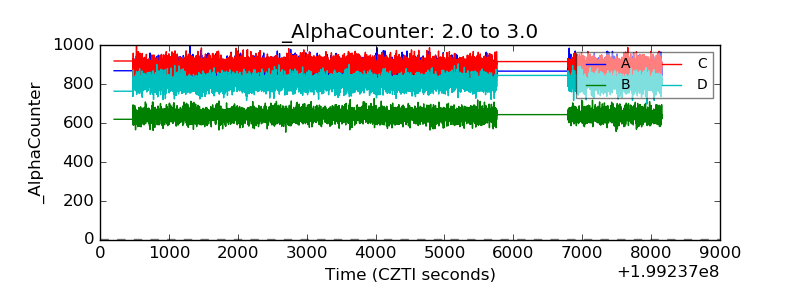 |
| _CPM_Rate | 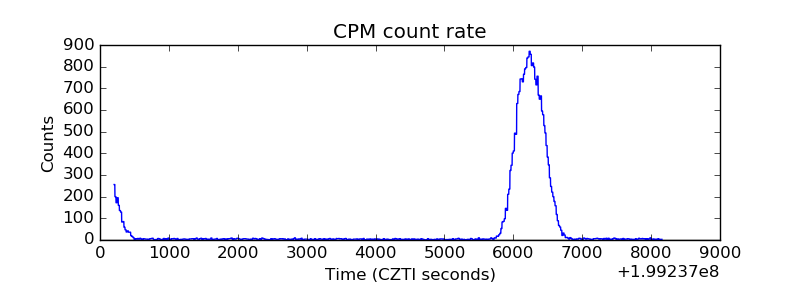 |
| CZT Counter | 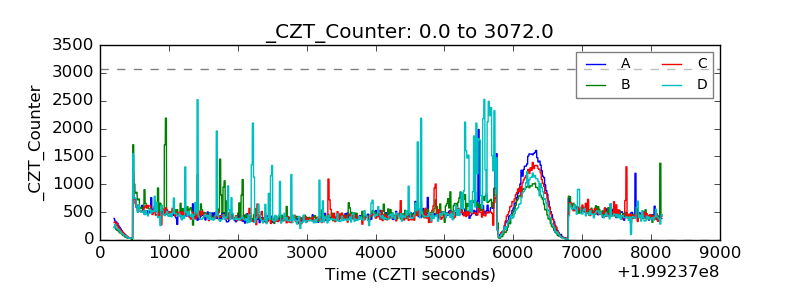 |
| +2.5 Volts monitor |  |
| +5 Volts monitor |  |
| _ROLL_ROT | 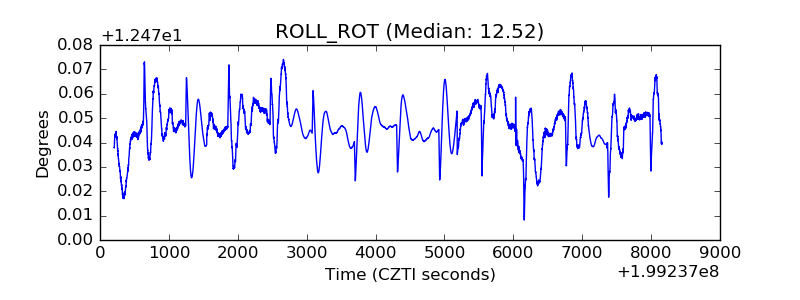 |
| _Roll_DEC | 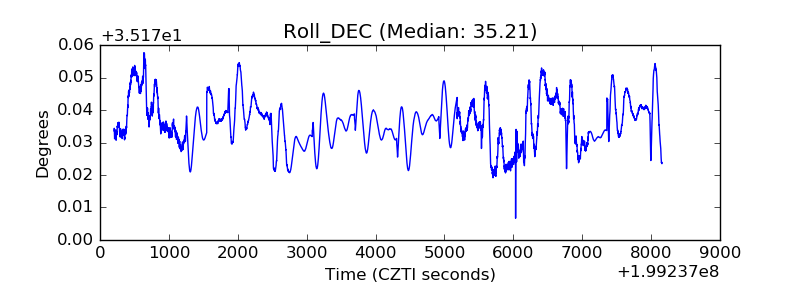 |
| _Roll_RA | 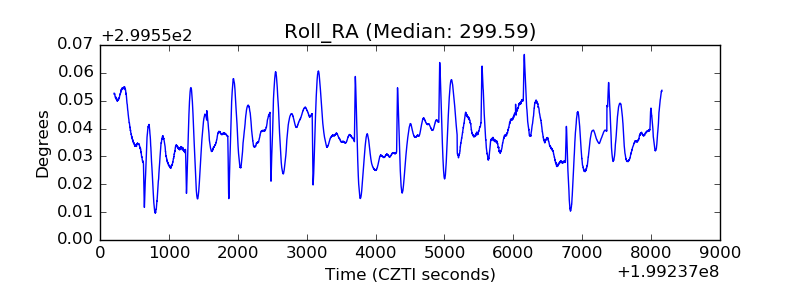 |
| Veto Counter | 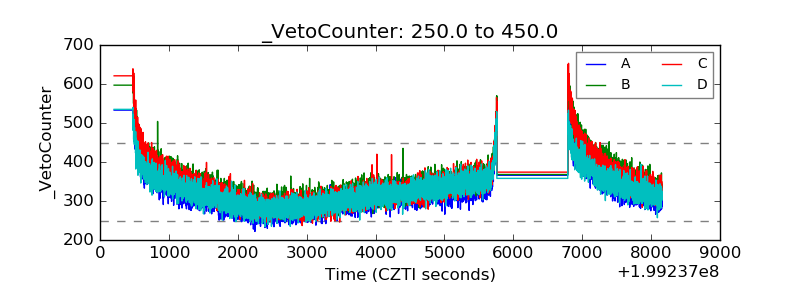 |