| Param | Original file | Final file |
|---|---|---|
| Filename | modeM0/AS1G05_237T03_9000000426_03110cztM0_level2.evt | modeM0/AS1G05_237T03_9000000426_03110cztM0_level2_quad_clean.evt |
| Size (bytes) | 415,411,200 | 68,932,800 |
| Size | 396.2 MB | 65.7 MB |
| Events in quadrant A | 2,724,340 | 430,658 |
| Events in quadrant B | 3,122,791 | 432,325 |
| Events in quadrant C | 2,939,120 | 431,613 |
| Events in quadrant D | 3,416,111 | 403,131 |
| Mode M9 | |||
|---|---|---|---|
| Quadrant | BADHDUFLAG | Total packets | Discarded packets |
| A | 0 | 14 | 0 |
| B | 0 | 14 | 0 |
| C | 0 | 14 | 0 |
| D | 0 | 15 | 0 |
| Mode M0 | |||
|---|---|---|---|
| Quadrant | BADHDUFLAG | Total packets | Discarded packets |
| A | 0 | 11825 | 2 |
| B | 0 | 12772 | 2 |
| C | 0 | 12624 | 2 |
| D | 0 | 14053 | 2 |
| Mode SS | |||
|---|---|---|---|
| Quadrant | BADHDUFLAG | Total packets | Discarded packets |
| A | 0 | 114 | 0 |
| B | 0 | 114 | 0 |
| C | 0 | 114 | 0 |
| D | 0 | 114 | 0 |
| Quadrant | Total seconds | Saturated seconds | Saturation percentage |
|---|---|---|---|
| A | 5564 | 43 | 0.772825% |
| B | 5564 | 100 | 1.797268% |
| C | 5564 | 68 | 1.222142% |
| D | 5564 | 172 | 3.091301% |
Noise dominated data is calculated using 1-second bins in cleaned event files. If a bin has >2000 counts, and if more than 50% of those come from <1% of pixels, then it is considered to be noise-dominated and hence unusable.
| Quadrant | # 1 sec bins | Bins with >0 counts | Bins with >2000 counts | High rate bins dominated by noise | Noise dominated (total time) | Noise dominated (detector-on time) | Marked lightcurve |
|---|---|---|---|---|---|---|---|
| A | 6779 | 5565 | 8 | 8 | 0.12% | 0.14% | 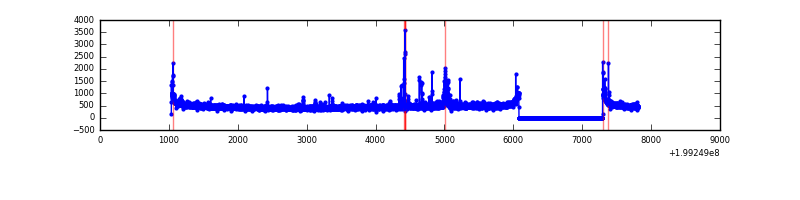 |
| B | 6779 | 5565 | 55 | 55 | 0.81% | 0.99% | 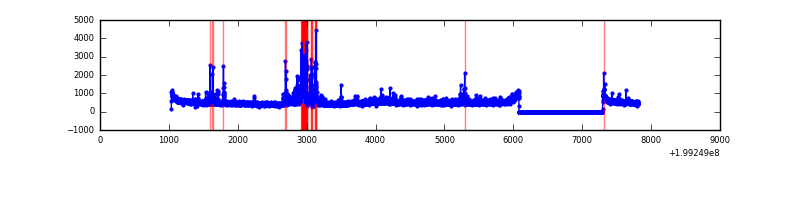 |
| C | 6779 | 5565 | 38 | 38 | 0.56% | 0.68% | 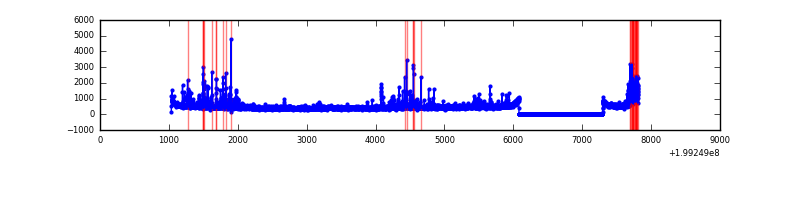 |
| D | 6779 | 5565 | 137 | 137 | 2.02% | 2.46% | 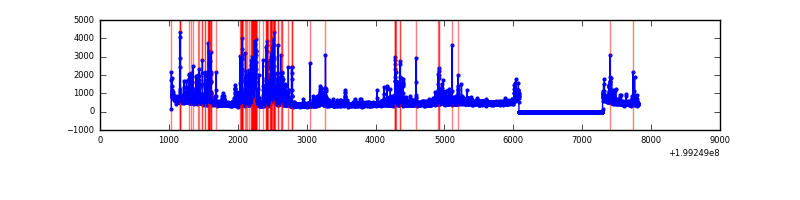 |
Top three noisy pixels from each quadrant. If the there are fewer than three noisy pixels in the level2.evt file, extra rows are filled as -1
| Pixel properties | Quadrant properties | ||||||
|---|---|---|---|---|---|---|---|
| Quadrant | DetID | PixID | Counts | Sigma | Mean | Median | Sigma |
| A | 0 | 13 | 104901 | 774.03 | 660 | 647 | 134.7 |
| A | 13 | 14 | 24900 | 180.07 | 660 | 647 | 134.7 |
| A | 8 | 15 | 20225 | 145.36 | 660 | 647 | 134.7 |
| B | 5 | 70 | 174132 | 1345.01 | 671 | 659 | 129.0 |
| B | 4 | 81 | 155002 | 1196.69 | 671 | 659 | 129.0 |
| B | 15 | 204 | 90347 | 695.39 | 671 | 659 | 129.0 |
| C | 0 | 219 | 270136 | 1814.7 | 638 | 644 | 148.5 |
| C | 6 | 80 | 123693 | 828.58 | 638 | 644 | 148.5 |
| C | 1 | 16 | 38435 | 254.48 | 638 | 644 | 148.5 |
| D | 13 | 120 | 457446 | 2791.58 | 622 | 607 | 163.6 |
| D | 13 | 223 | 273405 | 1666.97 | 622 | 607 | 163.6 |
| D | 13 | 239 | 169944 | 1034.76 | 622 | 607 | 163.6 |
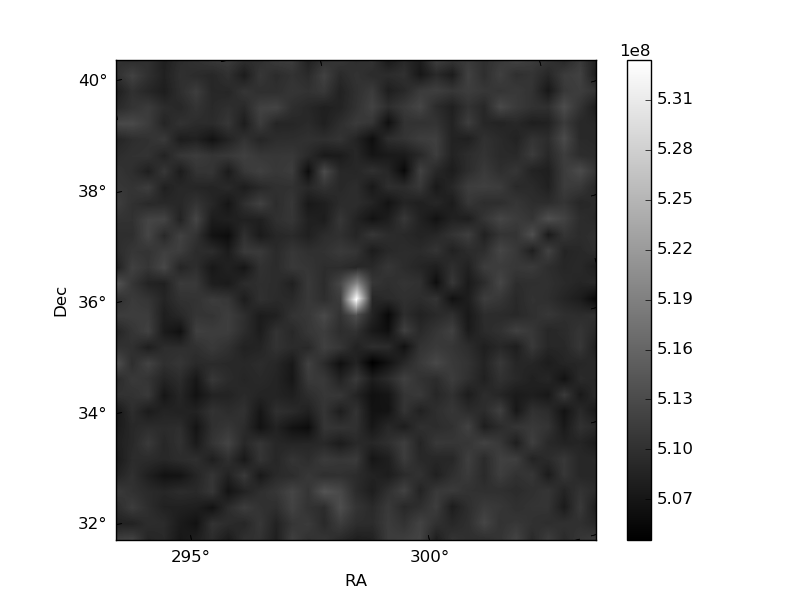
Histogram calculated using DETX and DETY for each event in the final _common_clean file
| Quadrant A | 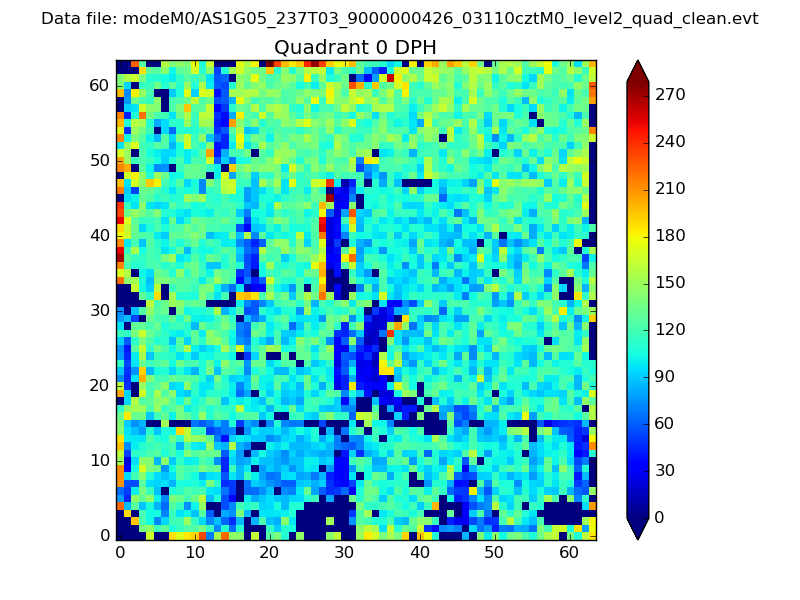 |
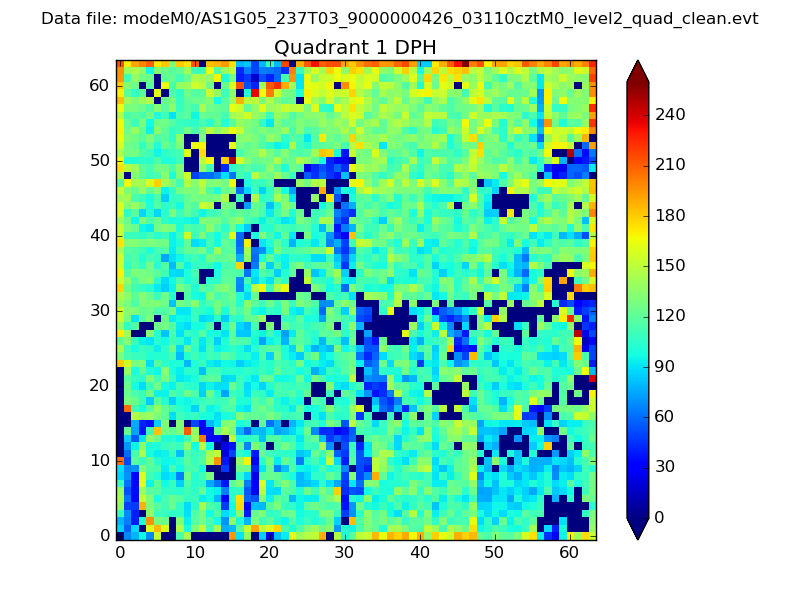 |
Quadrant B |
|---|---|---|---|
| Quadrant D | 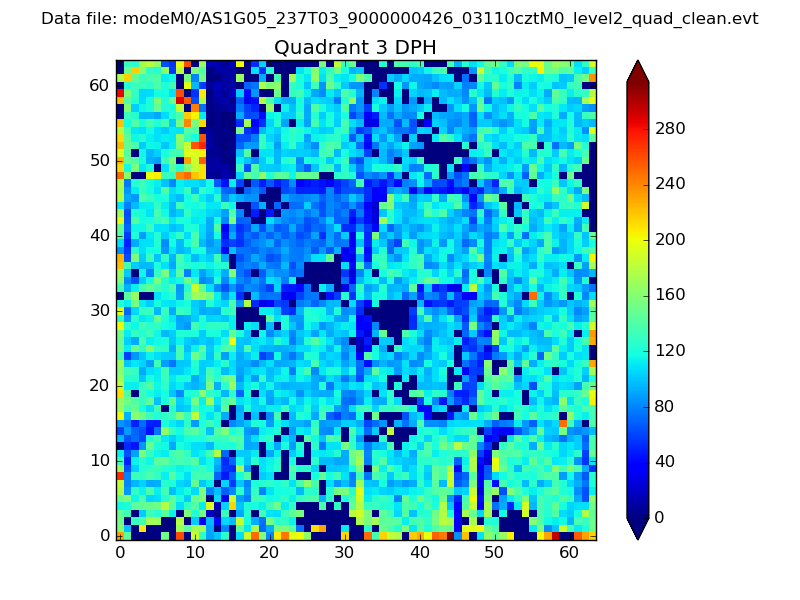 |
 |
Quadrant C |
| Plot type | Count rate plots | Images |
|---|---|---|
| Comparison with Poisson distribution Blue bars denote a histogram of data divided into 1 sec bins. Red curve is a Poisson curve with rate = median count rate of data. |
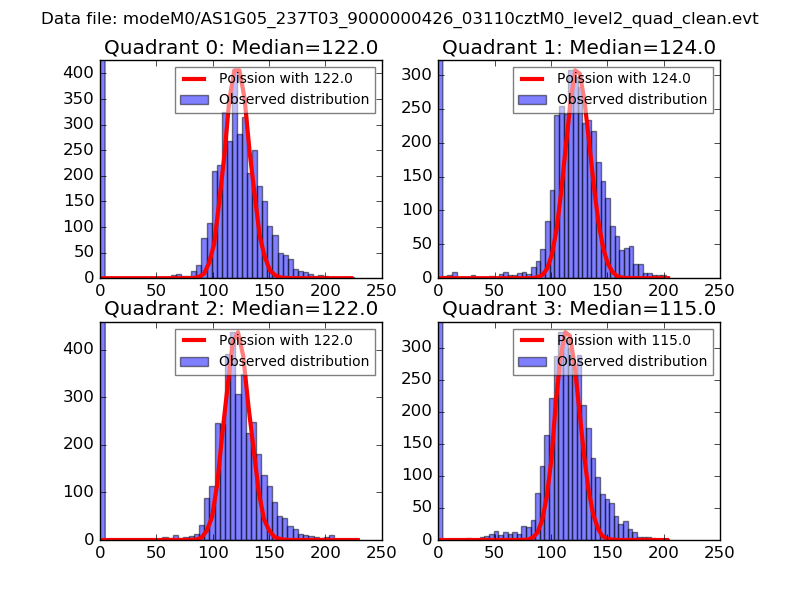 |
 |
| Quadrant-wise count rates Data is divided into 100 sec bins |
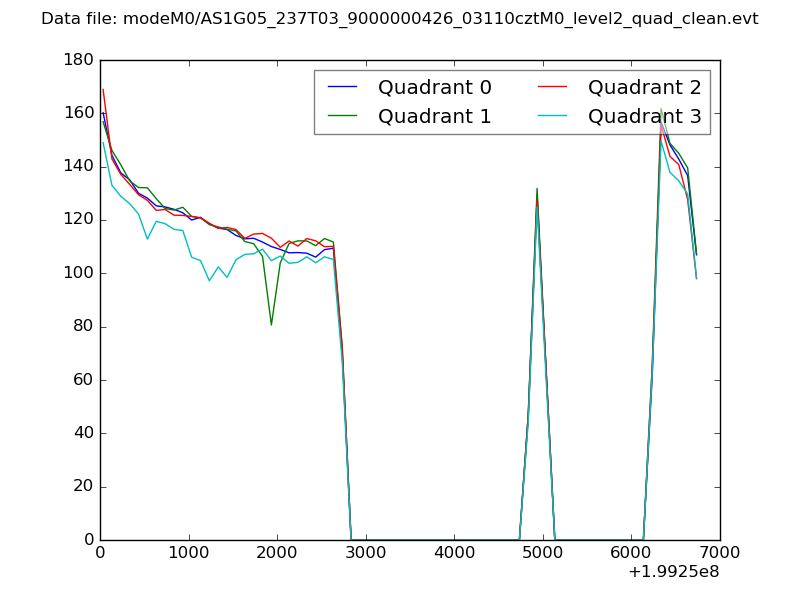 |
|
| Module-wise count rates for Quadrant A Data is divided into 100 sec bins |
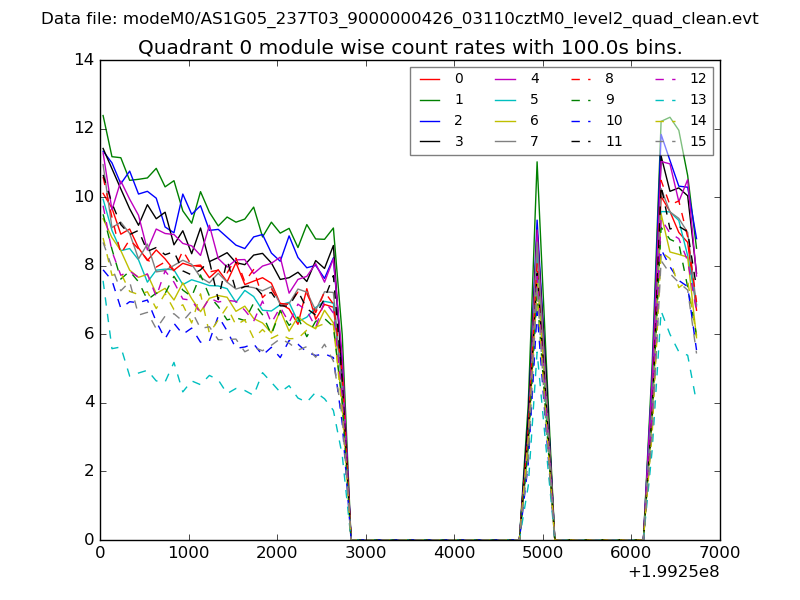 |
 |
| Module-wise count rates for Quadrant B Data is divided into 100 sec bins |
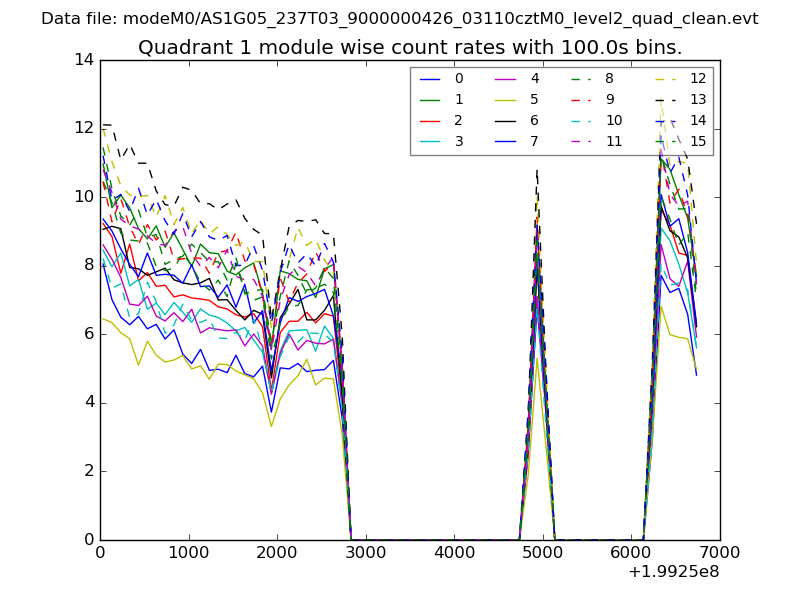 |
 |
| Module-wise count rates for Quadrant C Data is divided into 100 sec bins |
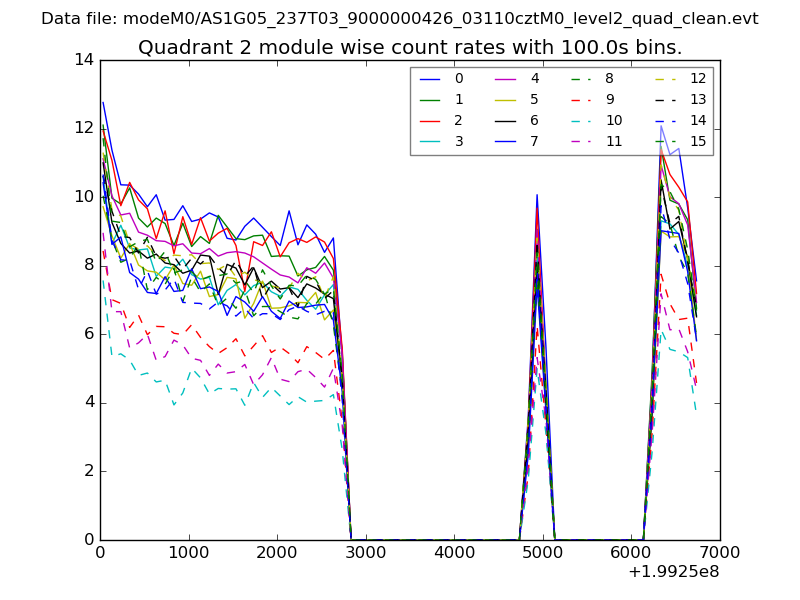 |
 |
| Module-wise count rates for Quadrant D Data is divided into 100 sec bins |
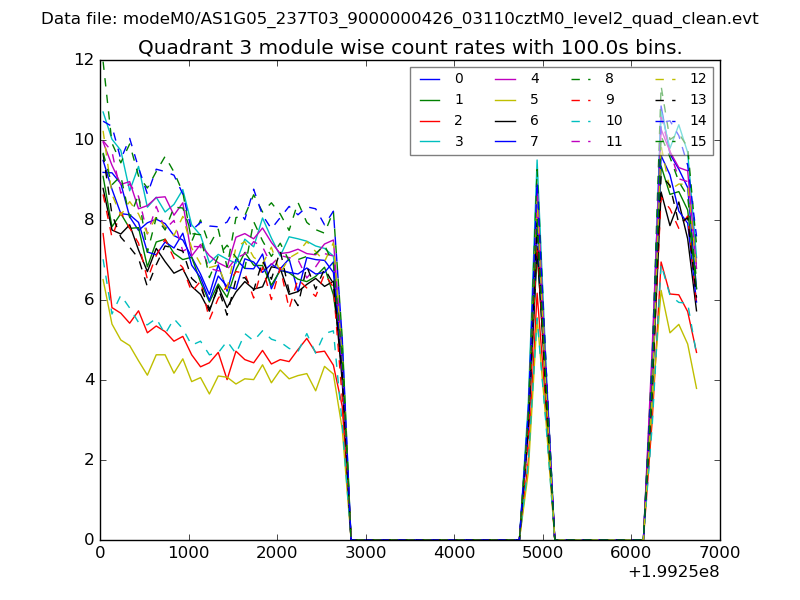 |
 |
| Parameter | Plot |
|---|---|
| CZT HV Monitor | 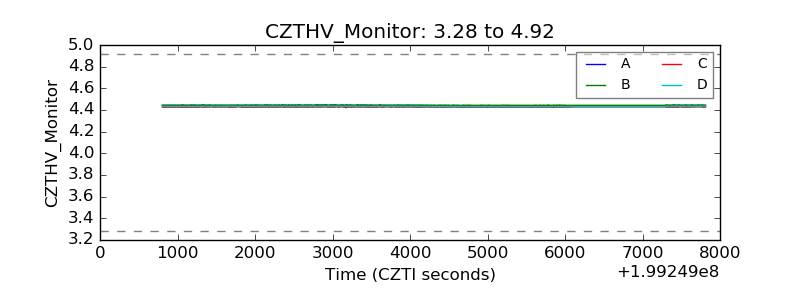 |
| D_VDD | 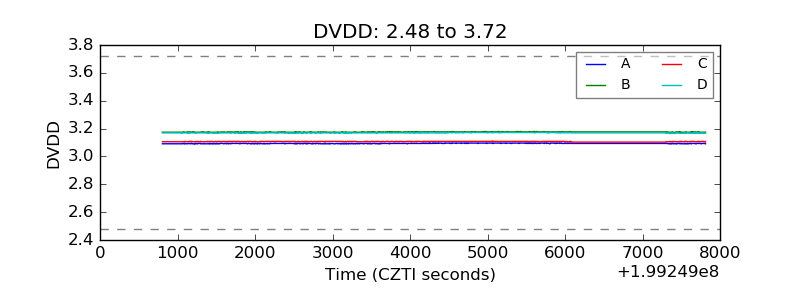 |
| Temperature 1 | 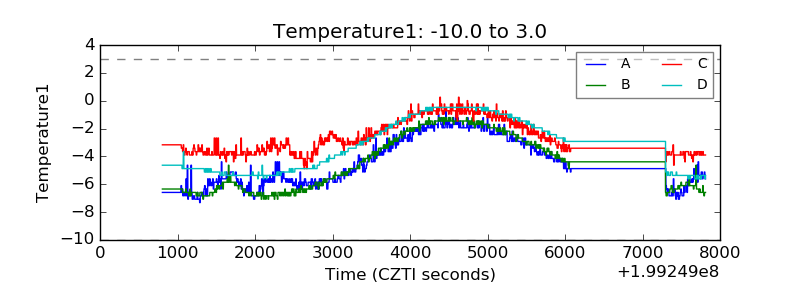 |
| Veto HV Monitor | 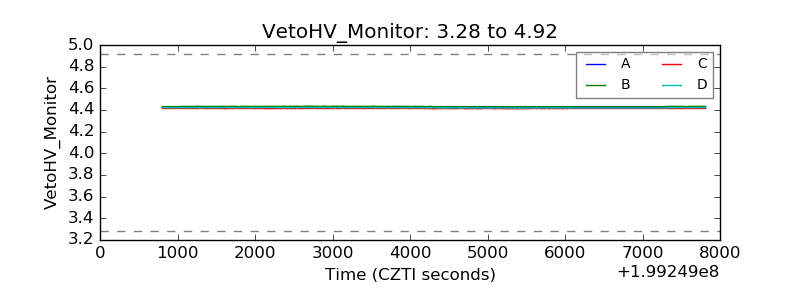 |
| Veto LLD | 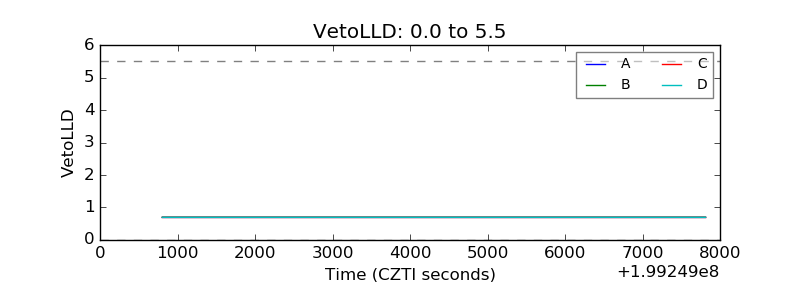 |
| Alpha Counter | 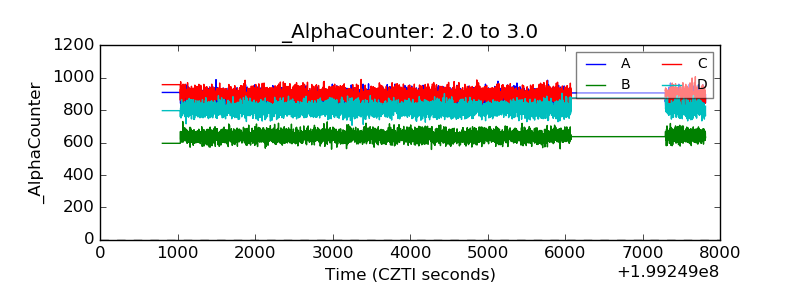 |
| _CPM_Rate | 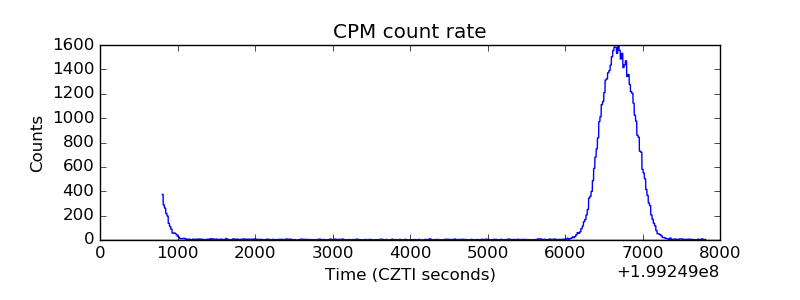 |
| CZT Counter | 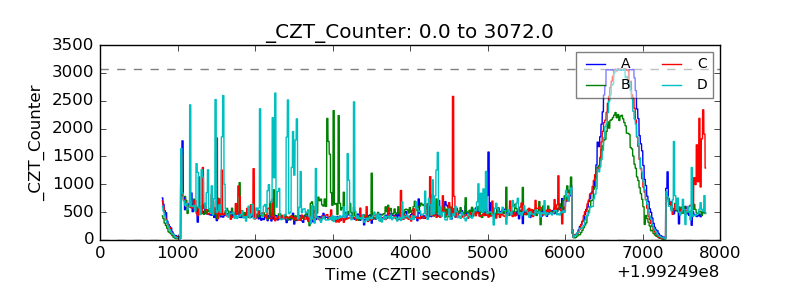 |
| +2.5 Volts monitor |  |
| +5 Volts monitor |  |
| _ROLL_ROT | 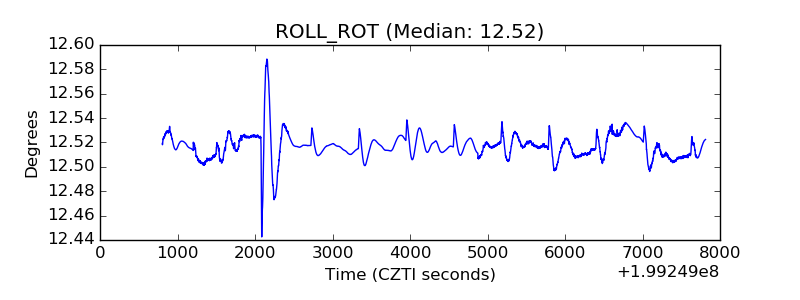 |
| _Roll_DEC | 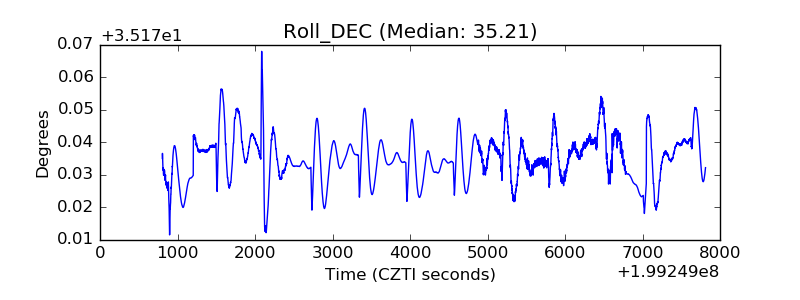 |
| _Roll_RA | 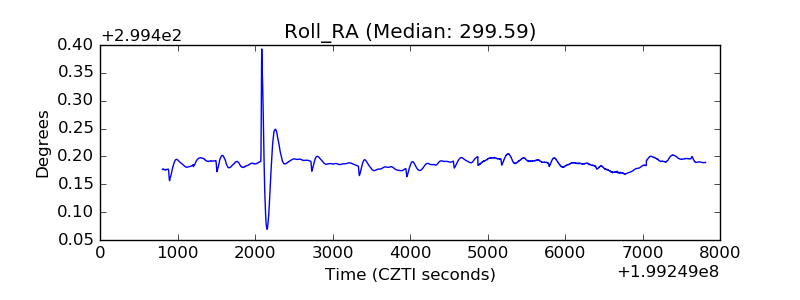 |
| Veto Counter | 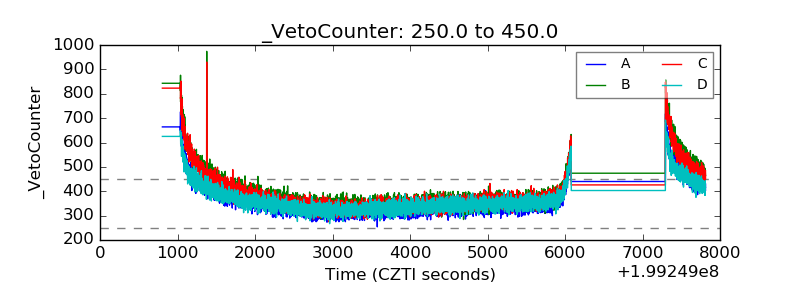 |