| Param | Original file | Final file |
|---|---|---|
| Filename | modeM0/AS1SLEW_01234_9000000425_03076cztM0_level2.evt | modeM0/AS1SLEW_01234_9000000425_03076cztM0_level2_common_clean.evt |
| Size (bytes) | 55,405,440 | 15,168,960 |
| Size | 52.8 MB | 14.5 MB |
| Events in quadrant A | 378,519 | 95,138 |
| Events in quadrant B | 441,071 | 93,831 |
| Events in quadrant C | 391,829 | 97,425 |
| Events in quadrant D | 394,174 | 95,724 |
| Mode M0 | |||
|---|---|---|---|
| Quadrant | BADHDUFLAG | Total packets | Discarded packets |
| A | 0 | 2024 | 0 |
| B | 0 | 2072 | 0 |
| C | 0 | 2049 | 0 |
| D | 0 | 2064 | 0 |
| Mode SS | |||
|---|---|---|---|
| Quadrant | BADHDUFLAG | Total packets | Discarded packets |
| A | 0 | 20 | 0 |
| B | 0 | 20 | 0 |
| C | 0 | 20 | 0 |
| D | 0 | 20 | 0 |
| Quadrant | Total seconds | Saturated seconds | Saturation percentage |
|---|---|---|---|
| A | 1013 | 0 | 0.000000% |
| B | 1013 | 2 | 0.197433% |
| C | 1013 | 1 | 0.098717% |
| D | 1013 | 1 | 0.098717% |
Noise dominated data is calculated using 1-second bins in cleaned event files. If a bin has >2000 counts, and if more than 50% of those come from <1% of pixels, then it is considered to be noise-dominated and hence unusable.
| Quadrant | # 1 sec bins | Bins with >0 counts | Bins with >2000 counts | High rate bins dominated by noise | Noise dominated (total time) | Noise dominated (detector-on time) | Marked lightcurve |
|---|---|---|---|---|---|---|---|
| A | 1013 | 1013 | 0 | 0 | 0.00% | 0.00% | 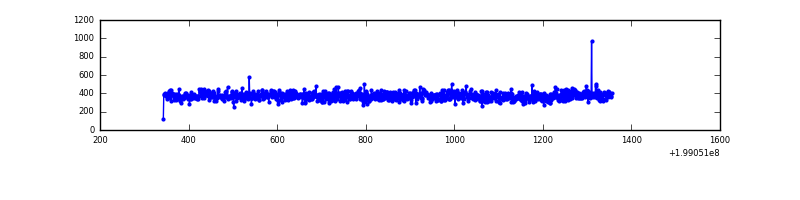 |
| B | 1013 | 1013 | 1 | 1 | 0.10% | 0.10% | 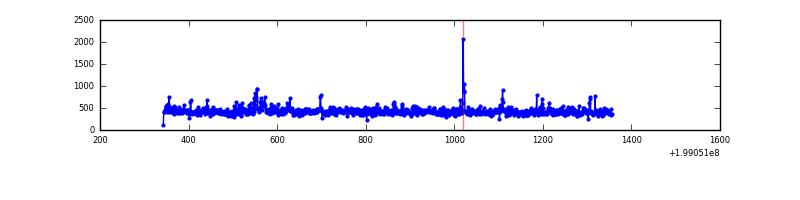 |
| C | 1013 | 1013 | 1 | 1 | 0.10% | 0.10% |  |
| D | 1013 | 1013 | 1 | 1 | 0.10% | 0.10% | 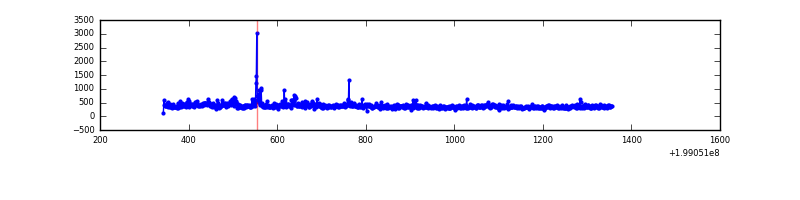 |
Top three noisy pixels from each quadrant. If the there are fewer than three noisy pixels in the level2.evt file, extra rows are filled as -1
| Pixel properties | Quadrant properties | ||||||
|---|---|---|---|---|---|---|---|
| Quadrant | DetID | PixID | Counts | Sigma | Mean | Median | Sigma |
| A | 8 | 15 | 8539 | 395.77 | 94 | 92 | 21.3 |
| A | 12 | 189 | 1898 | 84.62 | 94 | 92 | 21.3 |
| A | 12 | 194 | 1025 | 43.71 | 94 | 92 | 21.3 |
| B | 15 | 204 | 43348 | 2058.08 | 98 | 95 | 21.0 |
| B | 15 | 85 | 8882 | 418.11 | 98 | 95 | 21.0 |
| B | 4 | 200 | 5131 | 239.62 | 98 | 95 | 21.0 |
| C | 14 | 48 | 8511 | 354.87 | 94 | 94 | 23.7 |
| C | 14 | 223 | 4895 | 202.41 | 94 | 94 | 23.7 |
| C | 2 | 247 | 3391 | 139.0 | 94 | 94 | 23.7 |
| D | 7 | 6 | 11692 | 476.99 | 92 | 88 | 24.3 |
| D | 13 | 239 | 11245 | 458.62 | 92 | 88 | 24.3 |
| D | 2 | 152 | 8799 | 358.07 | 92 | 88 | 24.3 |
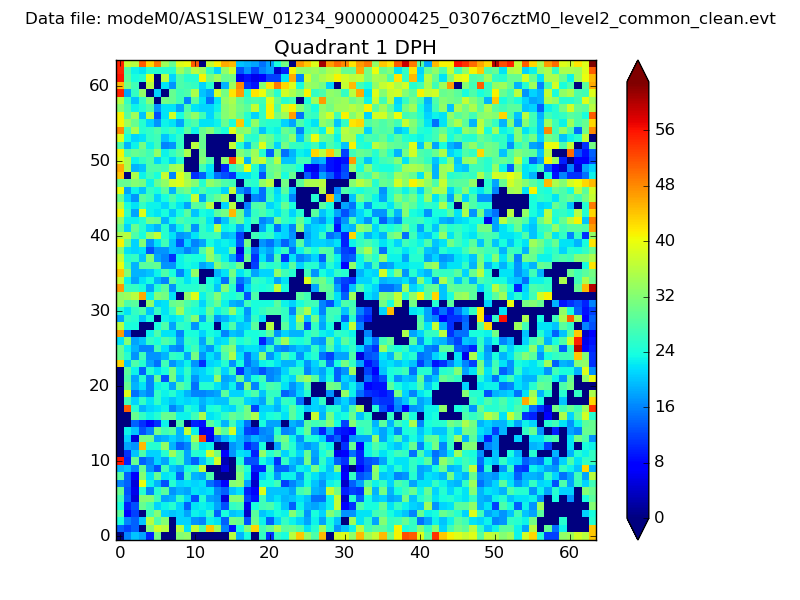
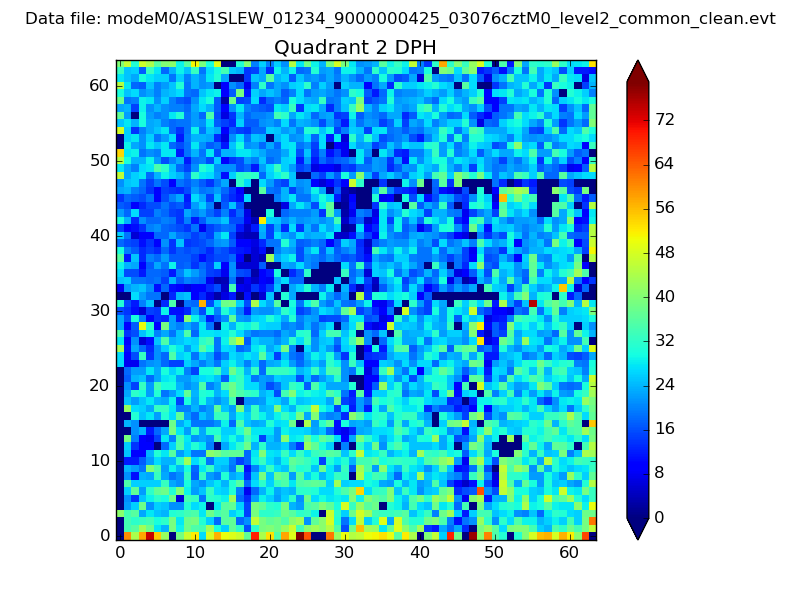
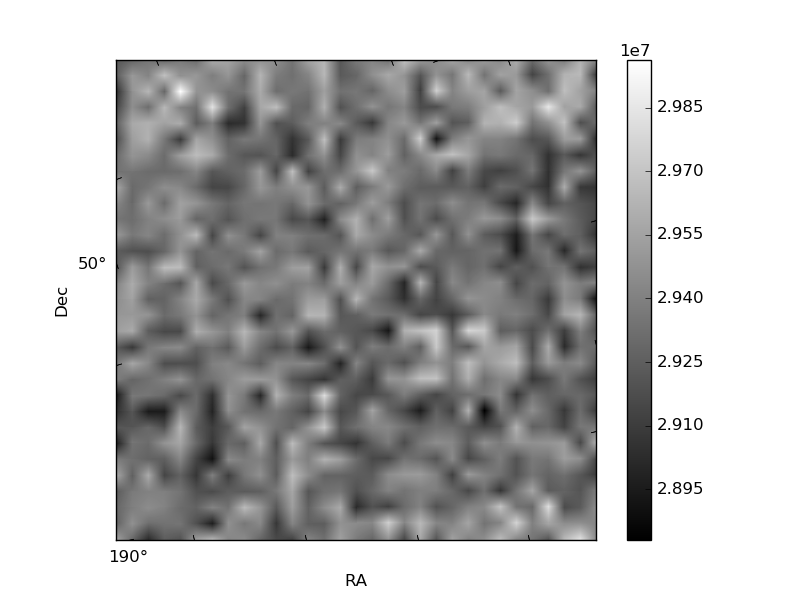
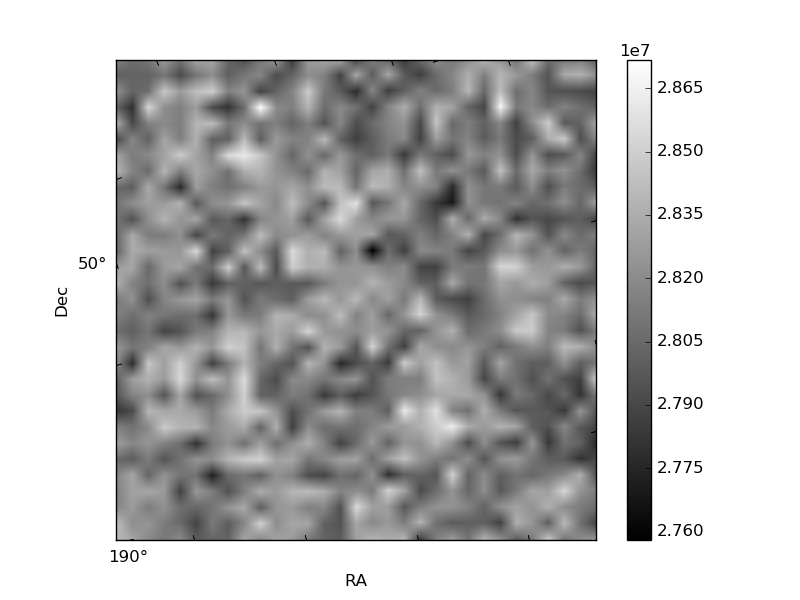
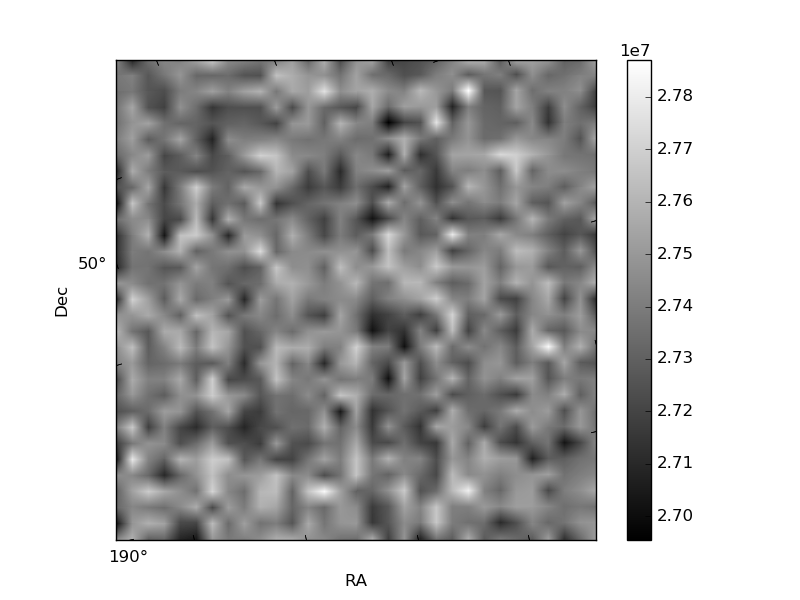
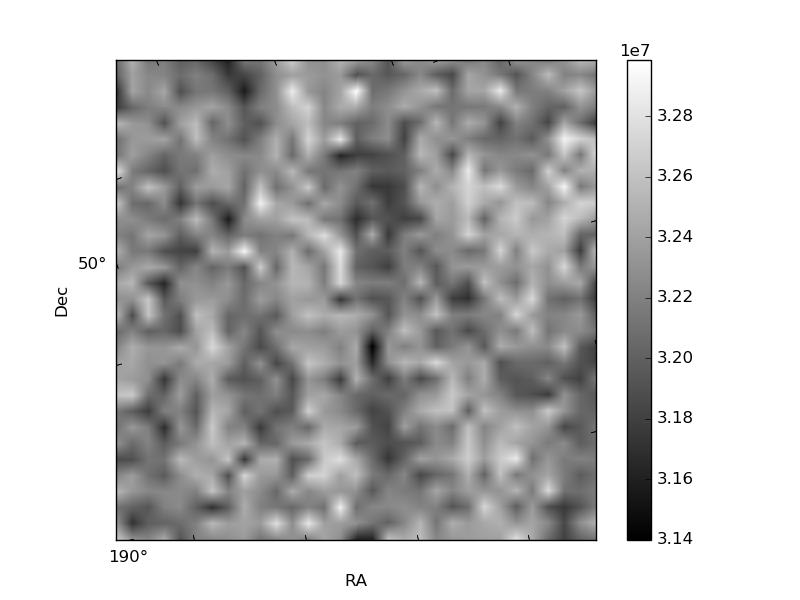
Histogram calculated using DETX and DETY for each event in the final _common_clean file
| Quadrant A | 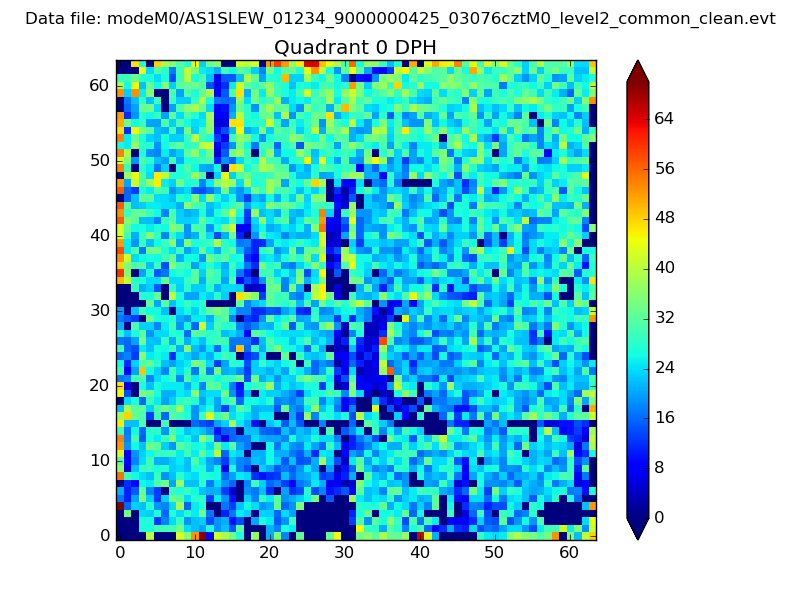 |
 |
Quadrant B |
|---|---|---|---|
| Quadrant D |  |
 |
Quadrant C |
| Plot type | Count rate plots | Images |
|---|---|---|
| Comparison with Poisson distribution Blue bars denote a histogram of data divided into 1 sec bins. Red curve is a Poisson curve with rate = median count rate of data. |
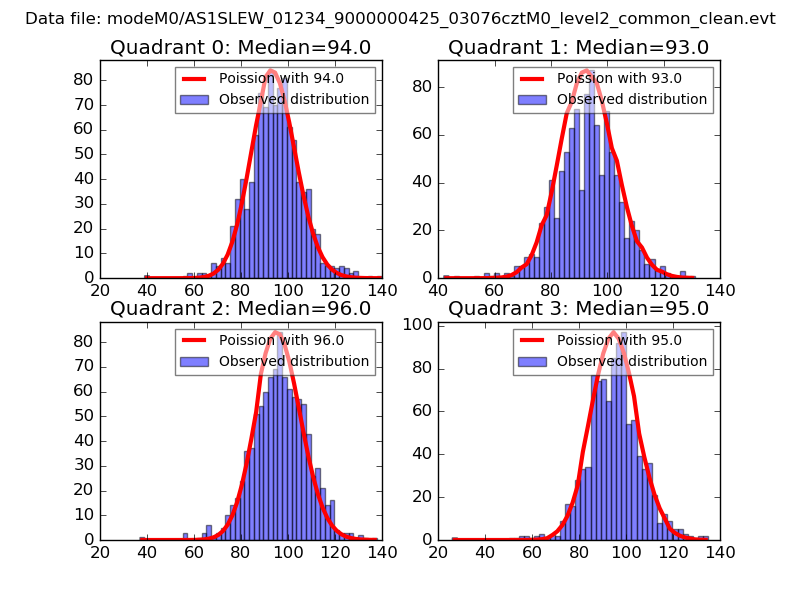 |
 |
| Quadrant-wise count rates Data is divided into 100 sec bins |
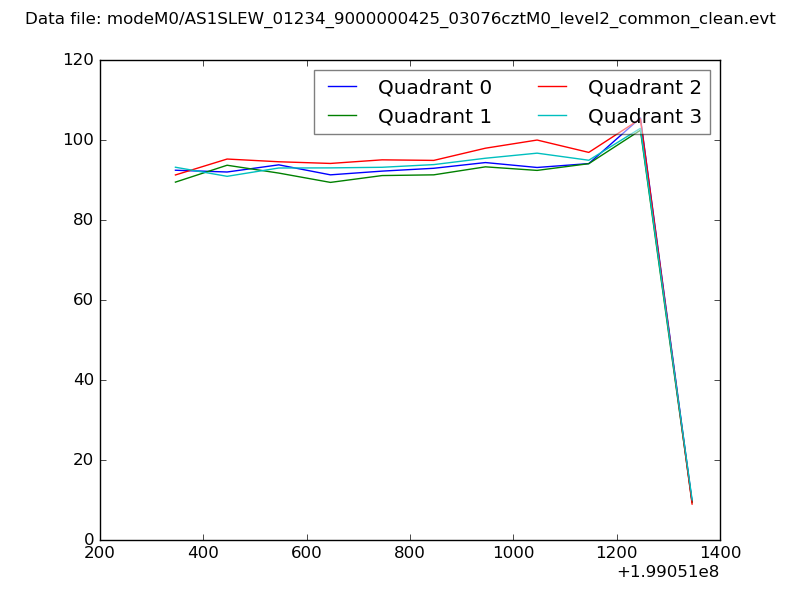 |
|
| Module-wise count rates for Quadrant A Data is divided into 100 sec bins |
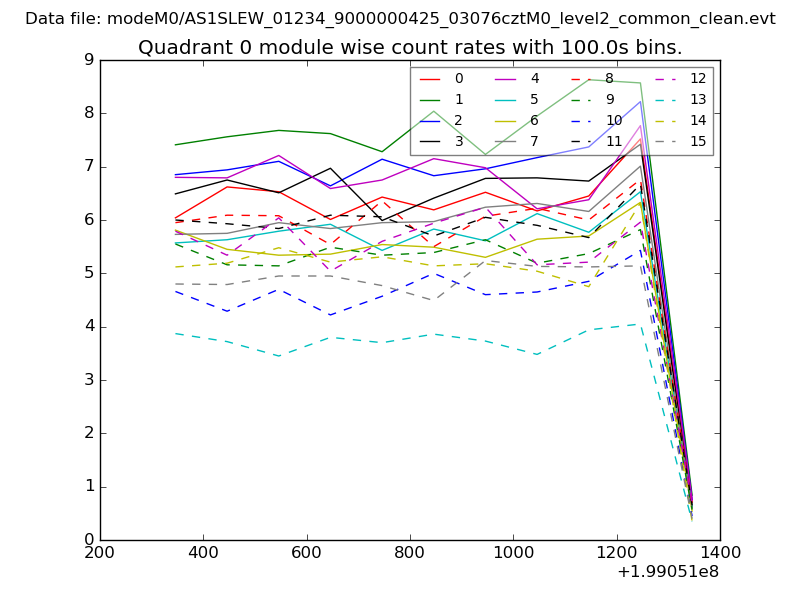 |
 |
| Module-wise count rates for Quadrant B Data is divided into 100 sec bins |
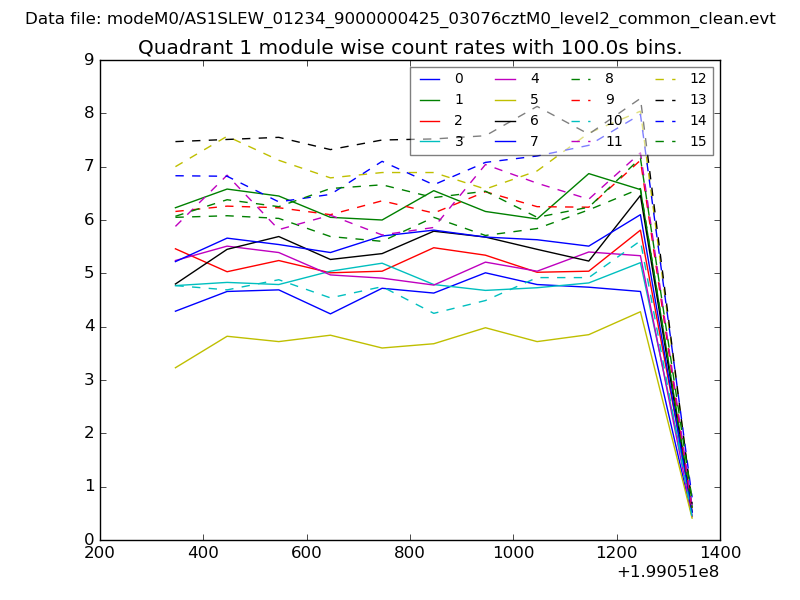 |
 |
| Module-wise count rates for Quadrant C Data is divided into 100 sec bins |
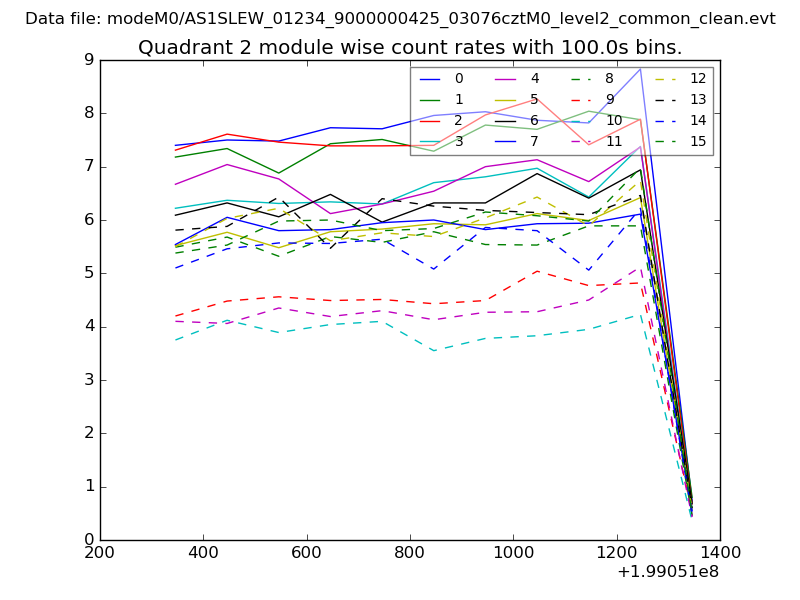 |
 |
| Module-wise count rates for Quadrant D Data is divided into 100 sec bins |
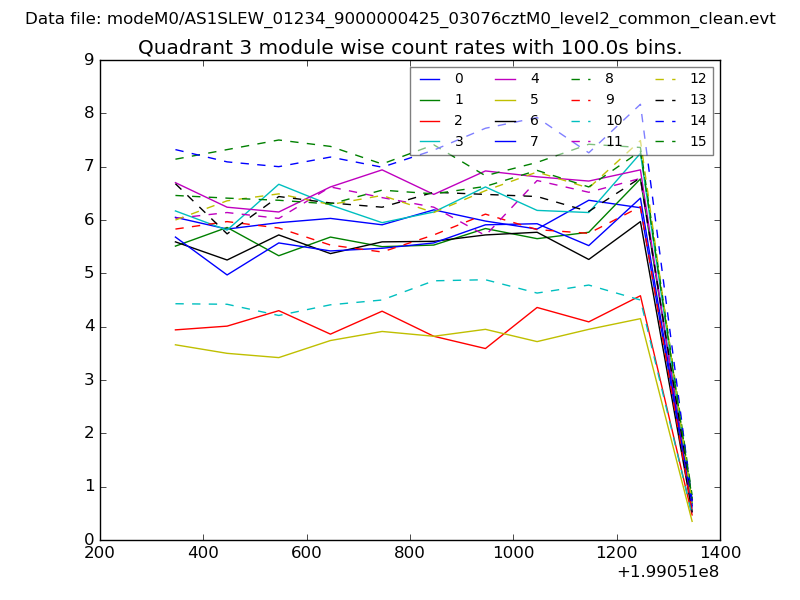 |
 |
| Parameter | Plot |
|---|---|
| CZT HV Monitor | 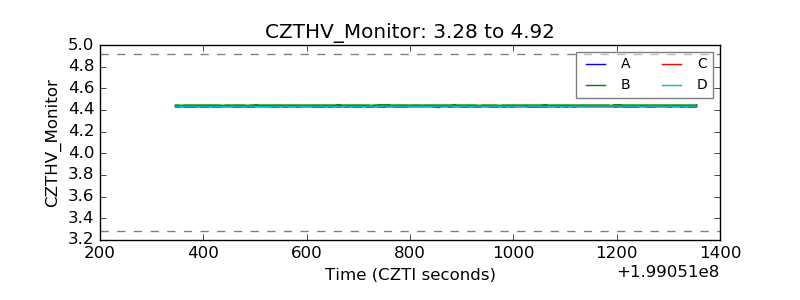 |
| D_VDD | 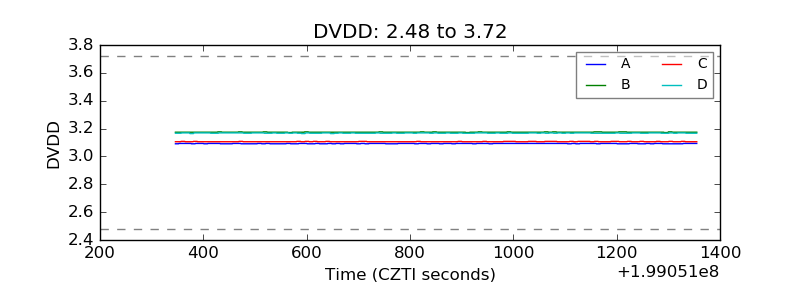 |
| Temperature 1 | 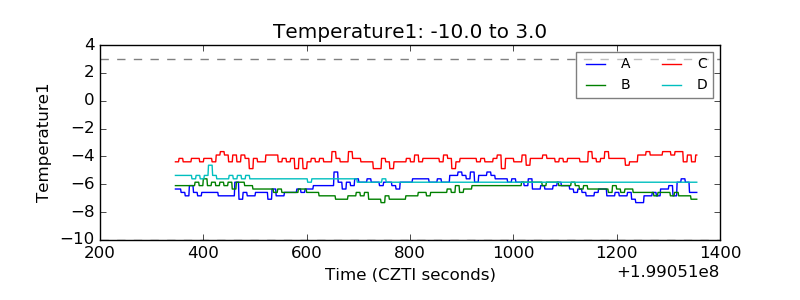 |
| Veto HV Monitor | 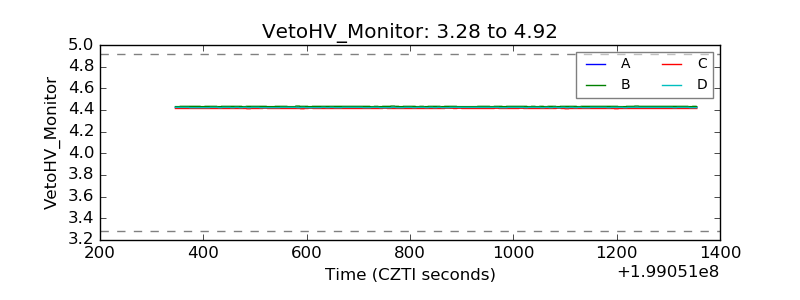 |
| Veto LLD | 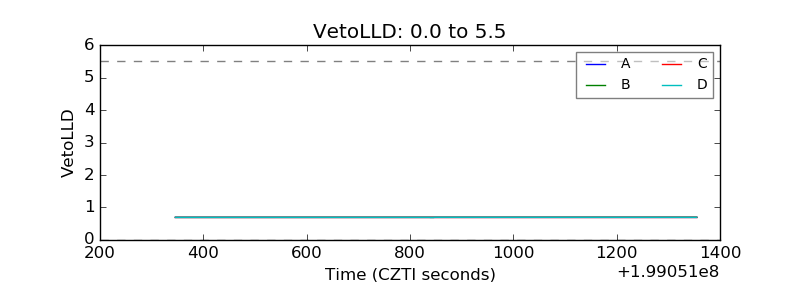 |
| Alpha Counter | 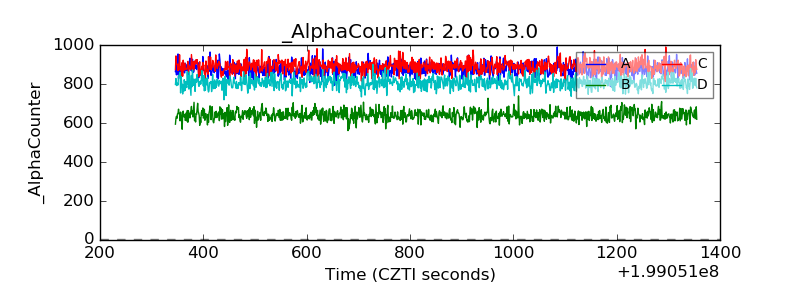 |
| _CPM_Rate | 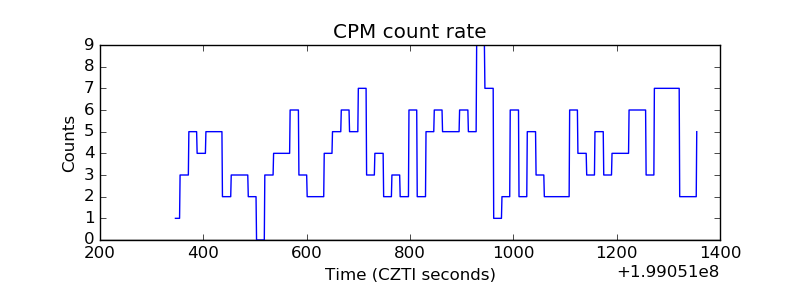 |
| CZT Counter |  |
| +2.5 Volts monitor |  |
| +5 Volts monitor |  |
| Veto Counter | 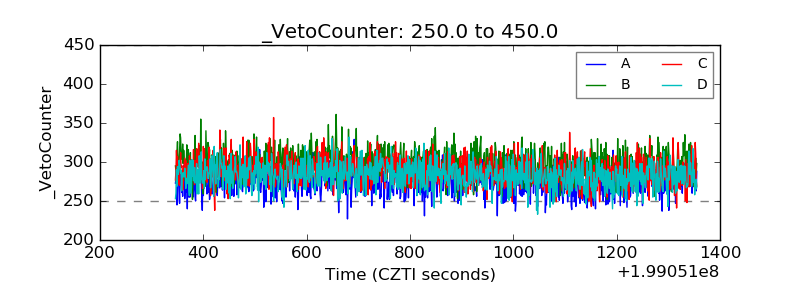 |