| Param | Original file | Final file |
|---|---|---|
| Filename | modeM0/AS1G05_214T01_9000000428_03110cztM0_level2.evt | modeM0/AS1G05_214T01_9000000428_03110cztM0_level2_quad_clean.evt |
| Size (bytes) | 61,338,240 | 10,543,680 |
| Size | 58.5 MB | 10.1 MB |
| Events in quadrant A | 281,785 | 68,981 |
| Events in quadrant B | 299,109 | 70,378 |
| Events in quadrant C | 871,709 | 62,096 |
| Events in quadrant D | 357,913 | 64,472 |
| Mode M0 | |||
|---|---|---|---|
| Quadrant | BADHDUFLAG | Total packets | Discarded packets |
| A | 0 | 1300 | 0 |
| B | 0 | 1314 | 0 |
| C | 0 | 3028 | 0 |
| D | 0 | 1563 | 0 |
| Mode SS | |||
|---|---|---|---|
| Quadrant | BADHDUFLAG | Total packets | Discarded packets |
| A | 0 | 12 | 0 |
| B | 0 | 12 | 0 |
| C | 0 | 12 | 0 |
| D | 0 | 12 | 0 |
| Quadrant | Total seconds | Saturated seconds | Saturation percentage |
|---|---|---|---|
| A | 648 | 1 | 0.154321% |
| B | 648 | 0 | 0.000000% |
| C | 648 | 92 | 14.197531% |
| D | 648 | 16 | 2.469136% |
Noise dominated data is calculated using 1-second bins in cleaned event files. If a bin has >2000 counts, and if more than 50% of those come from <1% of pixels, then it is considered to be noise-dominated and hence unusable.
| Quadrant | # 1 sec bins | Bins with >0 counts | Bins with >2000 counts | High rate bins dominated by noise | Noise dominated (total time) | Noise dominated (detector-on time) | Marked lightcurve |
|---|---|---|---|---|---|---|---|
| A | 648 | 648 | 0 | 0 | 0.00% | 0.00% | 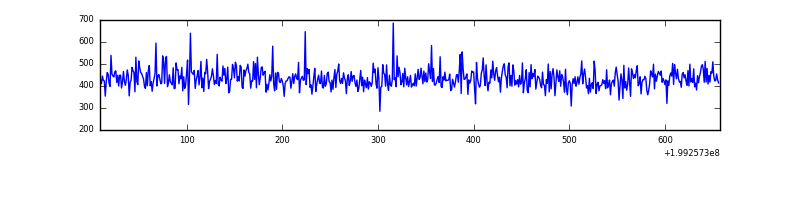 |
| B | 648 | 648 | 0 | 0 | 0.00% | 0.00% | 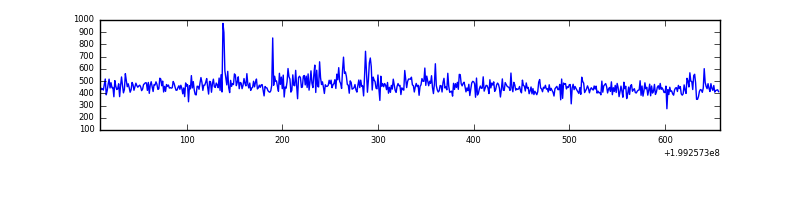 |
| C | 648 | 648 | 99 | 99 | 15.28% | 15.28% | 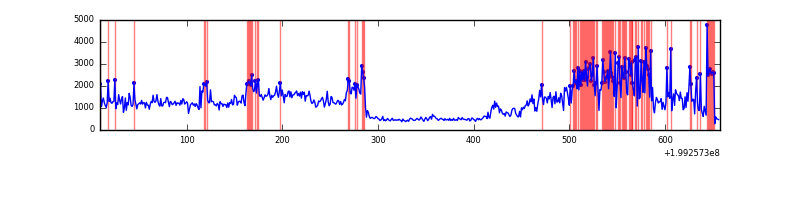 |
| D | 648 | 648 | 16 | 16 | 2.47% | 2.47% | 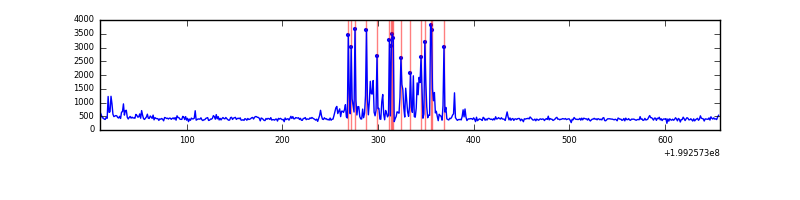 |
Top three noisy pixels from each quadrant. If the there are fewer than three noisy pixels in the level2.evt file, extra rows are filled as -1
| Pixel properties | Quadrant properties | ||||||
|---|---|---|---|---|---|---|---|
| Quadrant | DetID | PixID | Counts | Sigma | Mean | Median | Sigma |
| A | 13 | 14 | 1061 | 58.19 | 72 | 71 | 17.0 |
| A | 12 | 194 | 772 | 41.2 | 72 | 71 | 17.0 |
| A | 0 | 226 | 716 | 37.91 | 72 | 71 | 17.0 |
| B | 4 | 170 | 6701 | 411.37 | 73 | 71 | 16.1 |
| B | 15 | 204 | 4344 | 265.12 | 73 | 71 | 16.1 |
| B | 4 | 200 | 3915 | 238.51 | 73 | 71 | 16.1 |
| C | 0 | 219 | 598649 | 35891.4 | 65 | 65 | 16.7 |
| C | 14 | 223 | 13880 | 828.35 | 65 | 65 | 16.7 |
| C | 6 | 80 | 2490 | 145.4 | 65 | 65 | 16.7 |
| D | 13 | 239 | 98115 | 5266.64 | 67 | 65 | 18.6 |
| D | 12 | 217 | 2174 | 113.28 | 67 | 65 | 18.6 |
| D | 14 | 34 | 1569 | 80.79 | 67 | 65 | 18.6 |
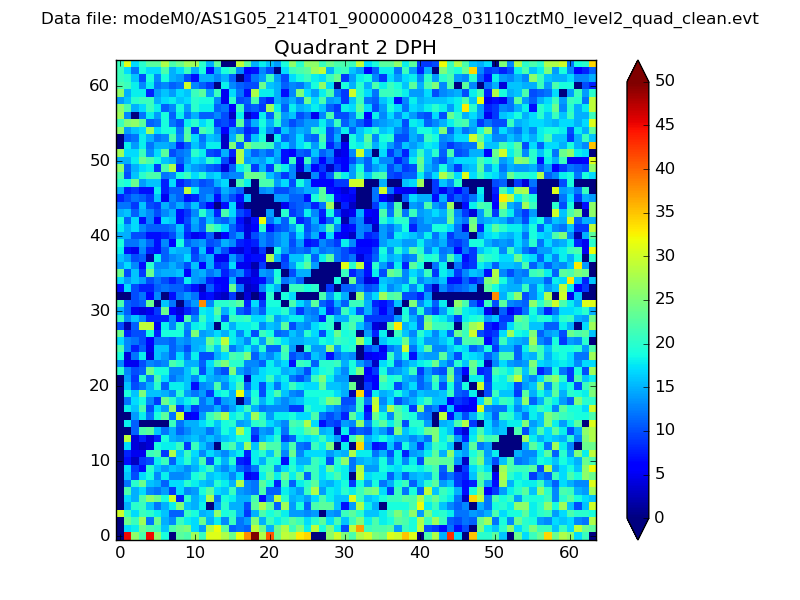
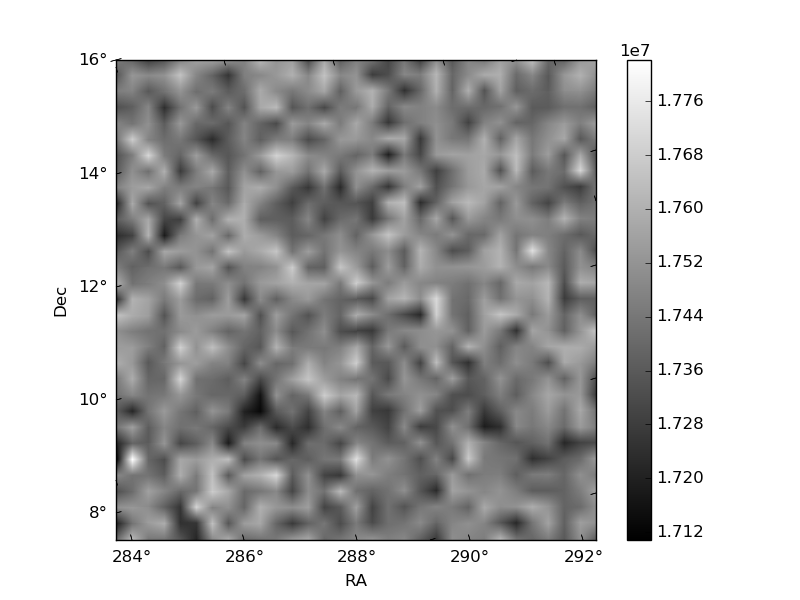
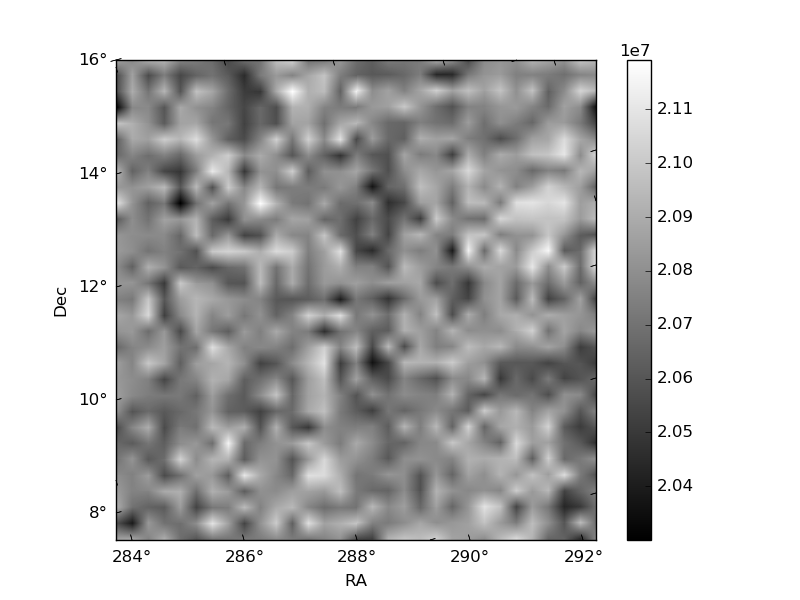
Histogram calculated using DETX and DETY for each event in the final _common_clean file
| Quadrant A | 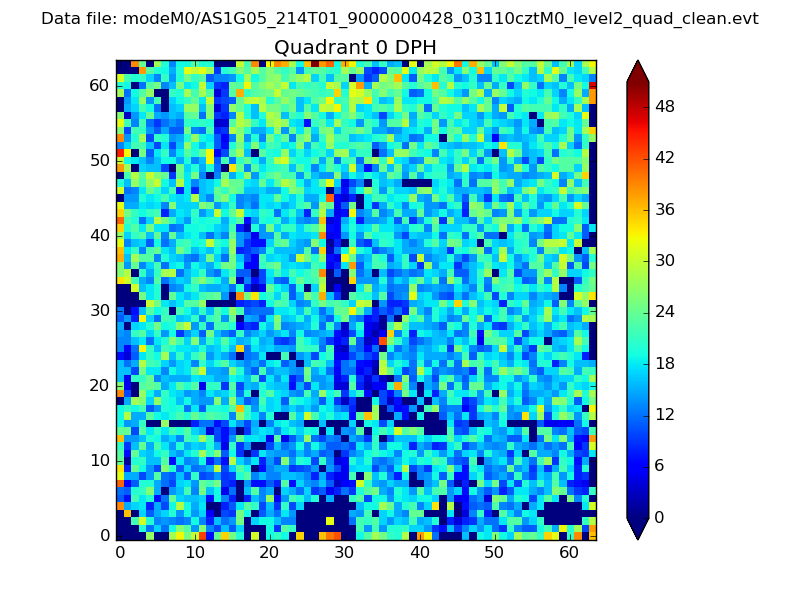 |
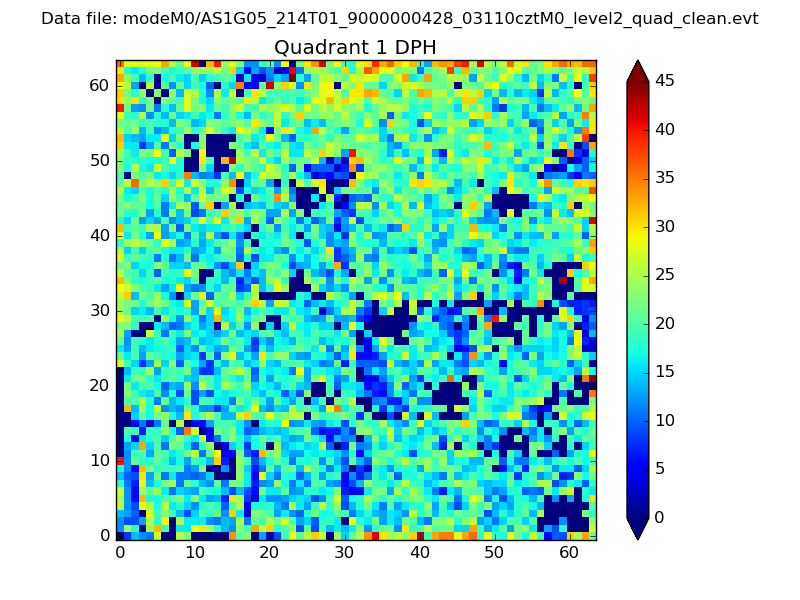 |
Quadrant B |
|---|---|---|---|
| Quadrant D | 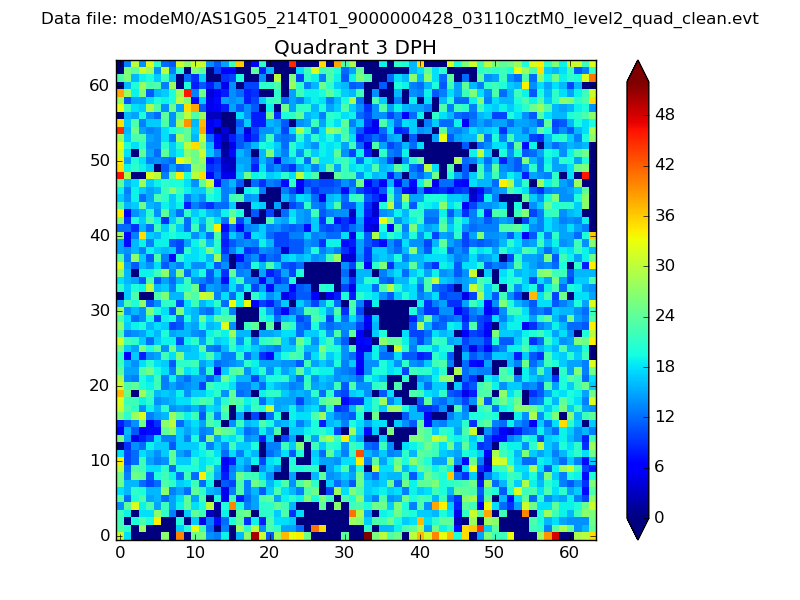 |
 |
Quadrant C |
| Plot type | Count rate plots | Images |
|---|---|---|
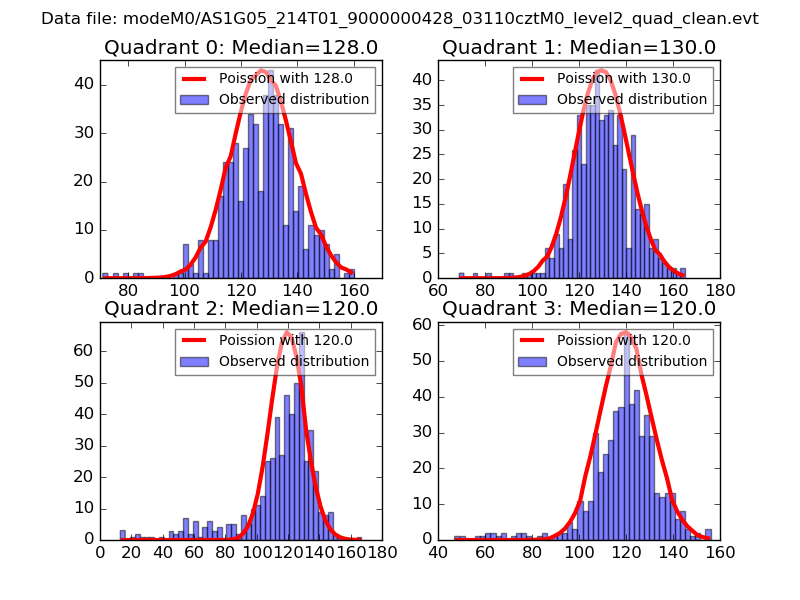
| Comparison with Poisson distribution Blue bars denote a histogram of data divided into 1 sec bins. Red curve is a Poisson curve with rate = median count rate of data. |
 |
 |
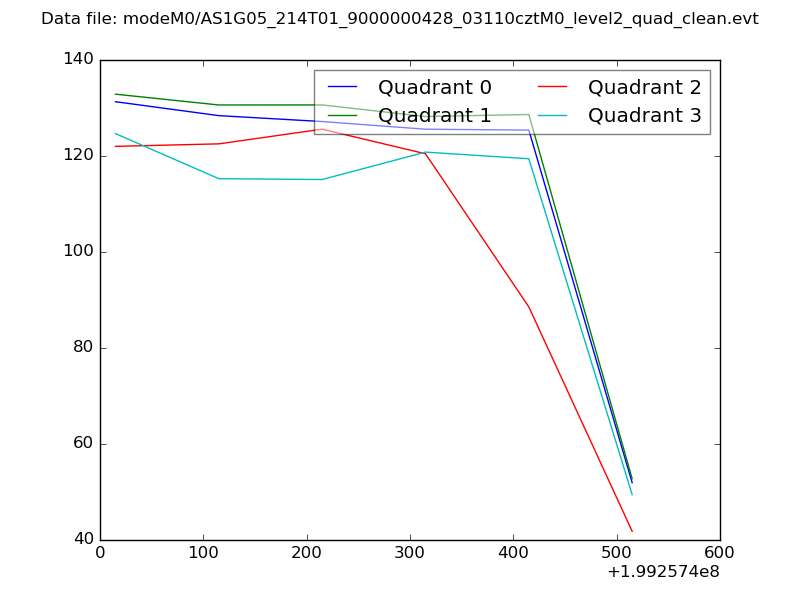
| Quadrant-wise count rates Data is divided into 100 sec bins |
 |
|
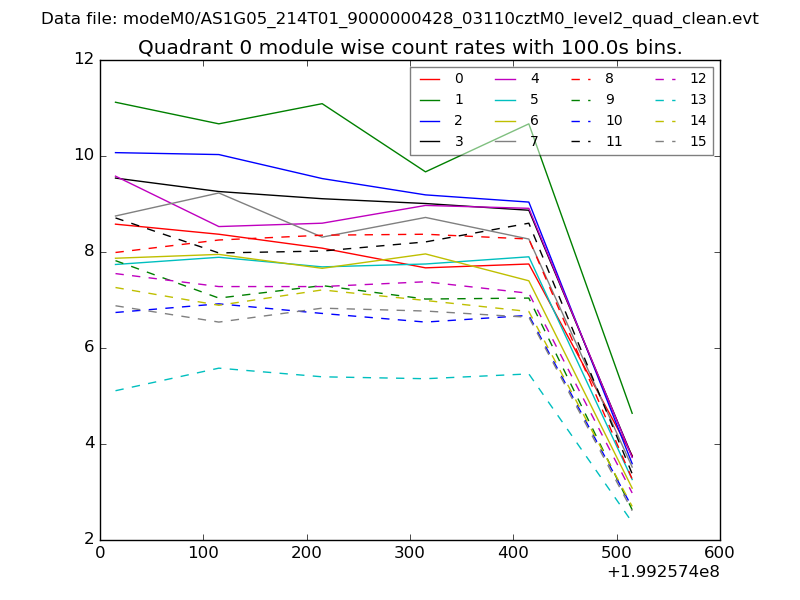
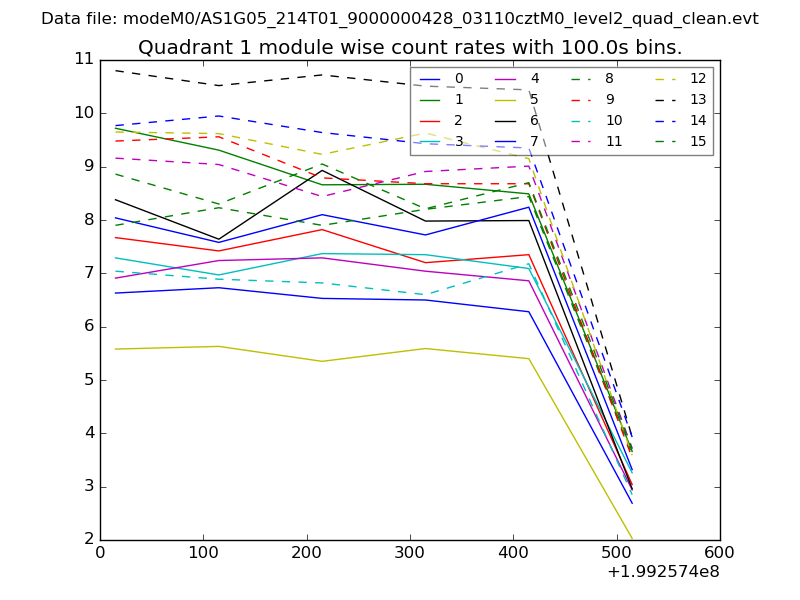
| Module-wise count rates for Quadrant A Data is divided into 100 sec bins |
 |
 |
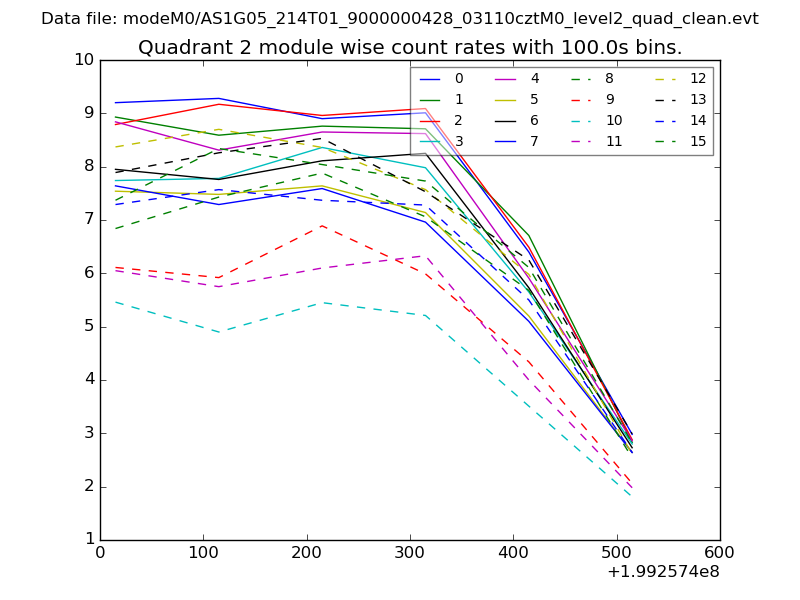
| Module-wise count rates for Quadrant B Data is divided into 100 sec bins |
 |
 |
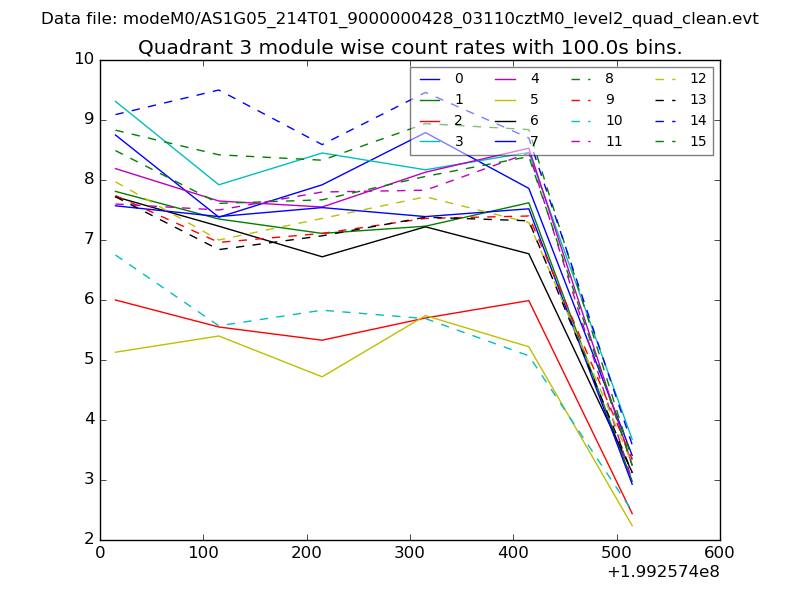
| Module-wise count rates for Quadrant C Data is divided into 100 sec bins |
 |
 |
| Module-wise count rates for Quadrant D Data is divided into 100 sec bins |
 |
 |
| Parameter | Plot |
|---|---|
| CZT HV Monitor | 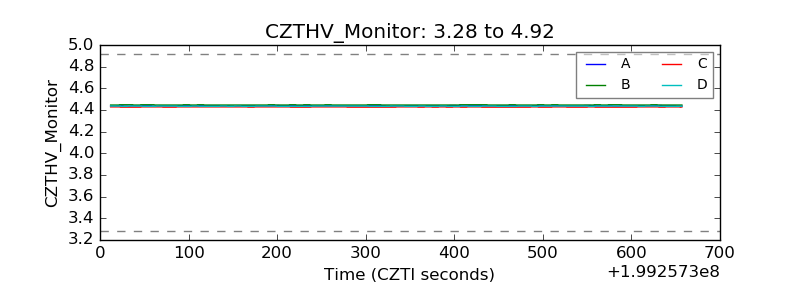 |
| D_VDD | 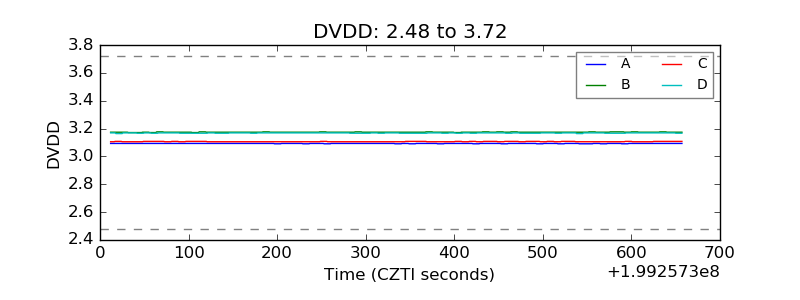 |
| Temperature 1 | 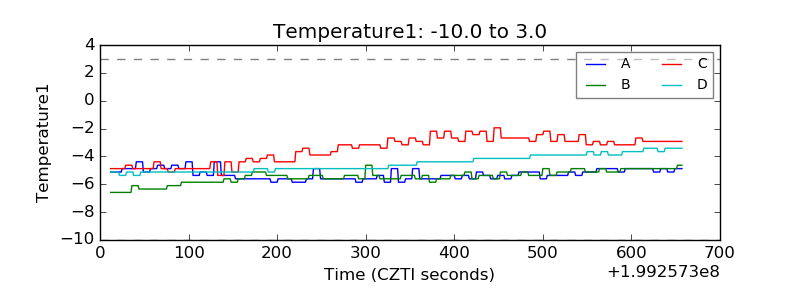 |
| Veto HV Monitor | 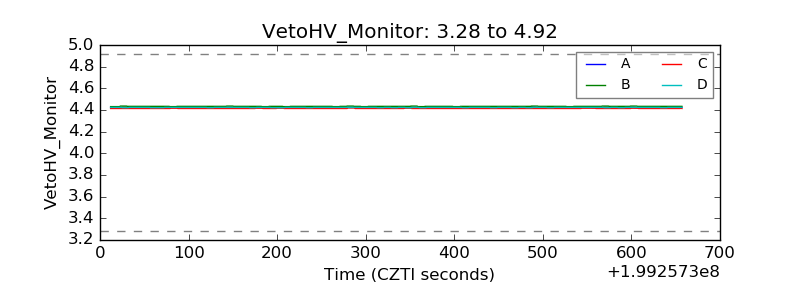 |
| Veto LLD | 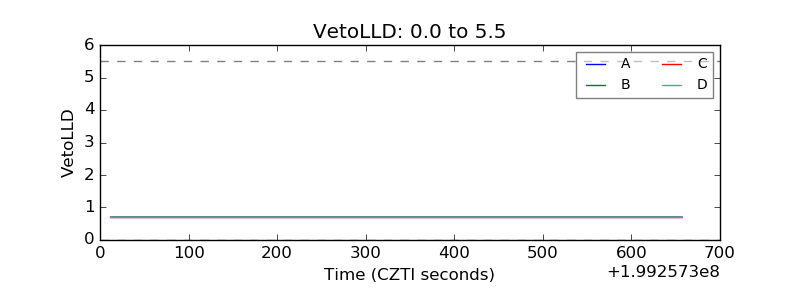 |
| Alpha Counter | 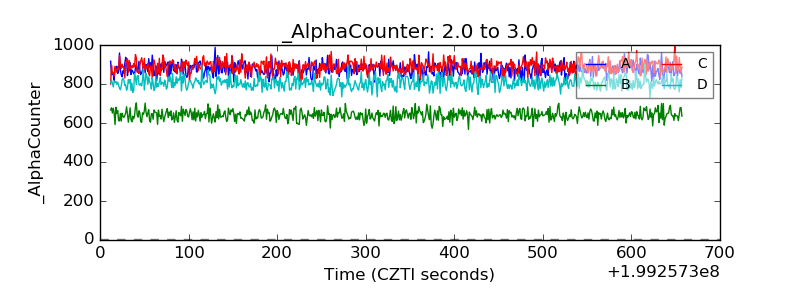 |
| _CPM_Rate | 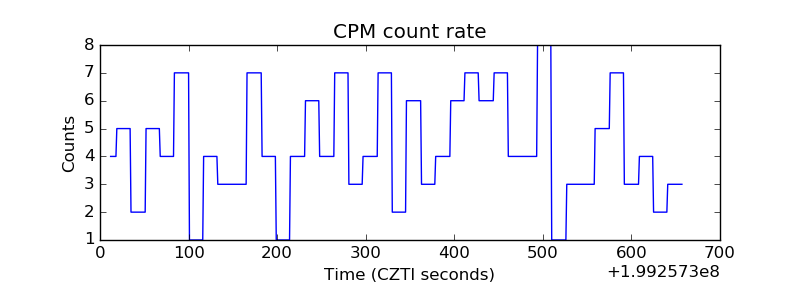 |
| CZT Counter | 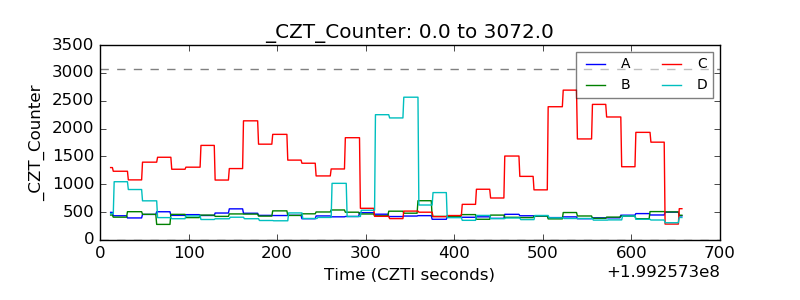 |
| +2.5 Volts monitor |  |
| +5 Volts monitor |  |
| _ROLL_ROT | 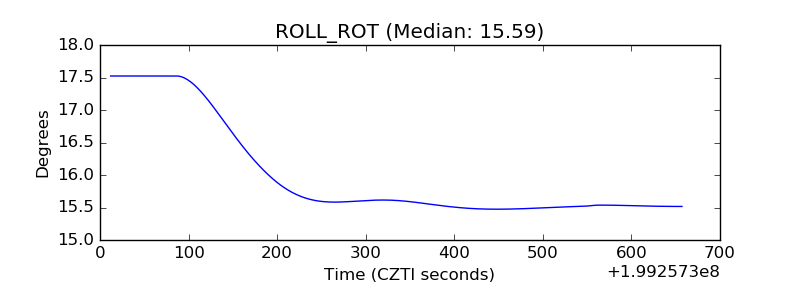 |
| _Roll_DEC | 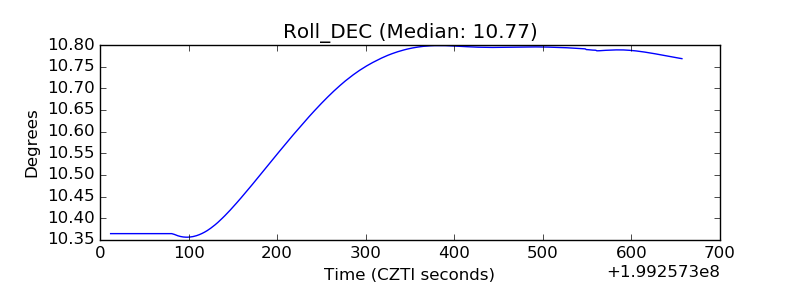 |
| _Roll_RA | 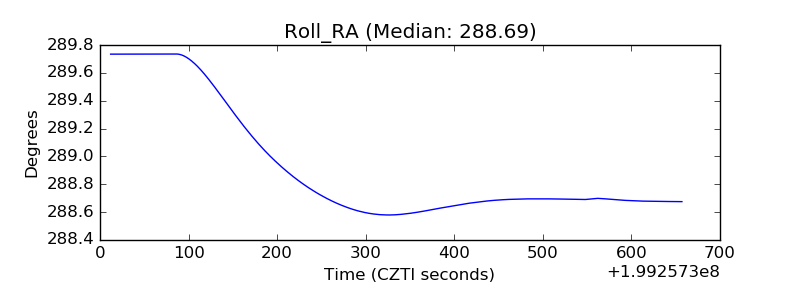 |
| Veto Counter | 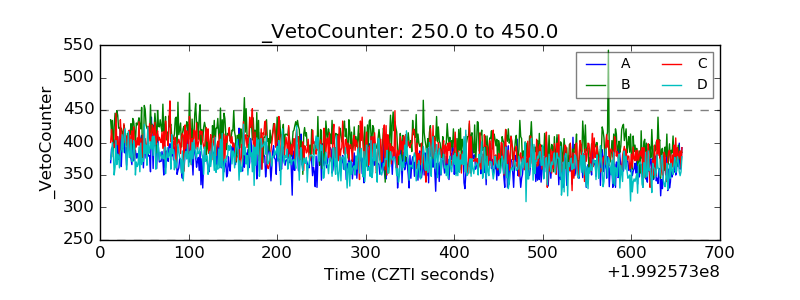 |