| Param | Original file | Final file |
|---|---|---|
| Filename | modeM0/AS1G05_214T01_9000000428_03112cztM0_level2.evt | modeM0/AS1G05_214T01_9000000428_03112cztM0_level2_quad_clean.evt |
| Size (bytes) | 539,743,680 | 64,658,880 |
| Size | 514.7 MB | 61.7 MB |
| Events in quadrant A | 2,844,881 | 404,073 |
| Events in quadrant B | 3,034,304 | 403,139 |
| Events in quadrant C | 6,877,795 | 380,331 |
| Events in quadrant D | 3,211,599 | 380,329 |
| Mode M0 | |||
|---|---|---|---|
| Quadrant | BADHDUFLAG | Total packets | Discarded packets |
| A | 0 | 11896 | 0 |
| B | 0 | 12339 | 0 |
| C | 0 | 24410 | 0 |
| D | 0 | 13284 | 0 |
| Mode SS | |||
|---|---|---|---|
| Quadrant | BADHDUFLAG | Total packets | Discarded packets |
| A | 0 | 114 | 0 |
| B | 0 | 114 | 0 |
| C | 0 | 114 | 0 |
| D | 0 | 114 | 0 |
| Mode M9 | |||
|---|---|---|---|
| Quadrant | BADHDUFLAG | Total packets | Discarded packets |
| A | 0 | 12 | 0 |
| B | 0 | 12 | 0 |
| C | 0 | 12 | 0 |
| D | 0 | 12 | 0 |
| Quadrant | Total seconds | Saturated seconds | Saturation percentage |
|---|---|---|---|
| A | 5567 | 99 | 1.778337% |
| B | 5567 | 155 | 2.784264% |
| C | 5567 | 1092 | 19.615592% |
| D | 5567 | 158 | 2.838153% |
Noise dominated data is calculated using 1-second bins in cleaned event files. If a bin has >2000 counts, and if more than 50% of those come from <1% of pixels, then it is considered to be noise-dominated and hence unusable.
| Quadrant | # 1 sec bins | Bins with >0 counts | Bins with >2000 counts | High rate bins dominated by noise | Noise dominated (total time) | Noise dominated (detector-on time) | Marked lightcurve |
|---|---|---|---|---|---|---|---|
| A | 6813 | 5568 | 13 | 13 | 0.19% | 0.23% | 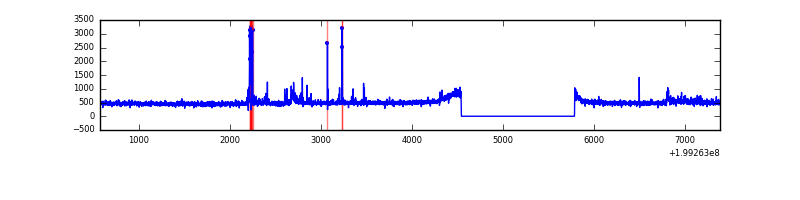 |
| B | 6813 | 5568 | 53 | 53 | 0.78% | 0.95% | 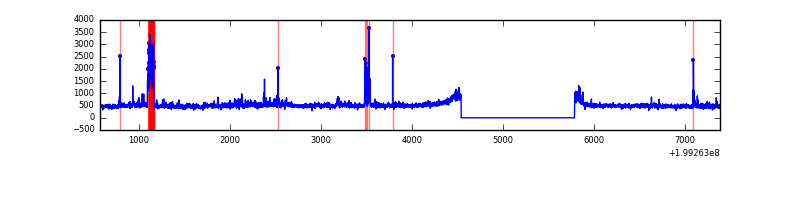 |
| C | 6813 | 5568 | 845 | 845 | 12.40% | 15.18% | 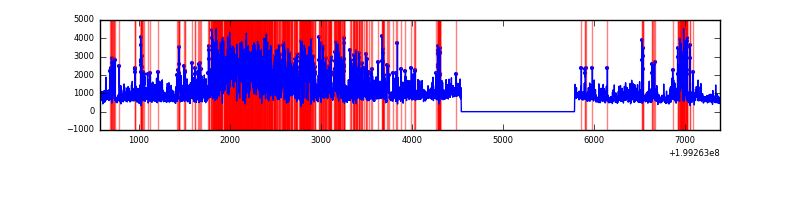 |
| D | 6813 | 5568 | 82 | 82 | 1.20% | 1.47% | 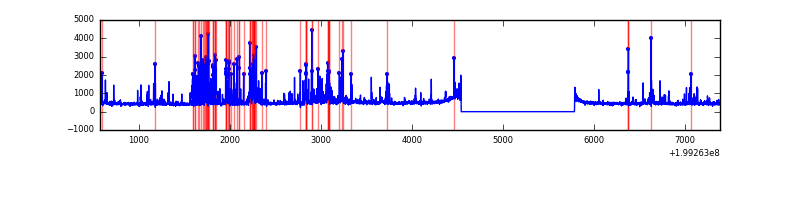 |
Top three noisy pixels from each quadrant. If the there are fewer than three noisy pixels in the level2.evt file, extra rows are filled as -1
| Pixel properties | Quadrant properties | ||||||
|---|---|---|---|---|---|---|---|
| Quadrant | DetID | PixID | Counts | Sigma | Mean | Median | Sigma |
| A | 0 | 13 | 90774 | 637.01 | 688 | 674 | 141.4 |
| A | 8 | 15 | 57808 | 403.94 | 688 | 674 | 141.4 |
| A | 0 | 149 | 19889 | 135.85 | 688 | 674 | 141.4 |
| B | 0 | 219 | 164493 | 1237.57 | 688 | 675 | 132.4 |
| B | 15 | 204 | 86727 | 650.09 | 688 | 675 | 132.4 |
| B | 15 | 85 | 48046 | 357.87 | 688 | 675 | 132.4 |
| C | 0 | 219 | 3855004 | 27100.4 | 608 | 611 | 142.2 |
| C | 14 | 223 | 457143 | 3209.9 | 608 | 611 | 142.2 |
| C | 6 | 80 | 143047 | 1001.47 | 608 | 611 | 142.2 |
| D | 13 | 120 | 466728 | 2662.73 | 650 | 638 | 175.0 |
| D | 10 | 85 | 104387 | 592.71 | 650 | 638 | 175.0 |
| D | 2 | 136 | 47963 | 270.36 | 650 | 638 | 175.0 |
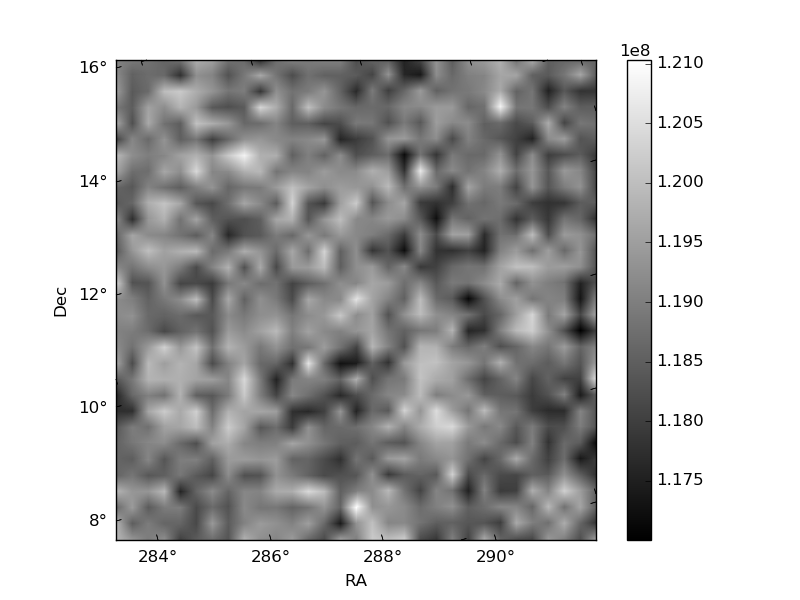
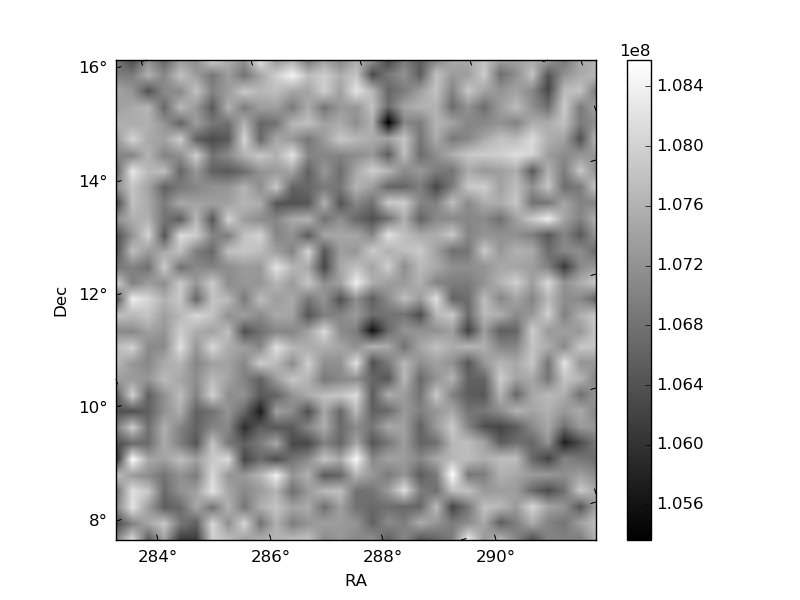
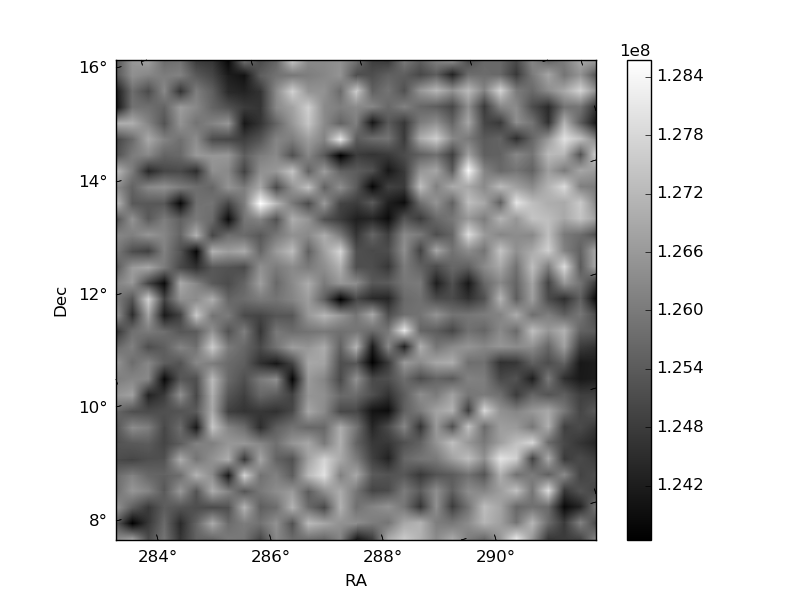
Histogram calculated using DETX and DETY for each event in the final _common_clean file
| Quadrant A | 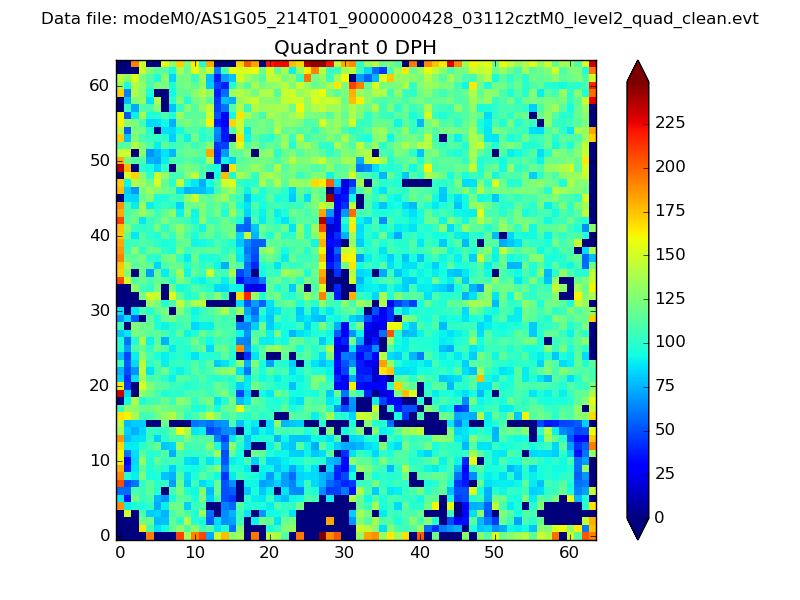 |
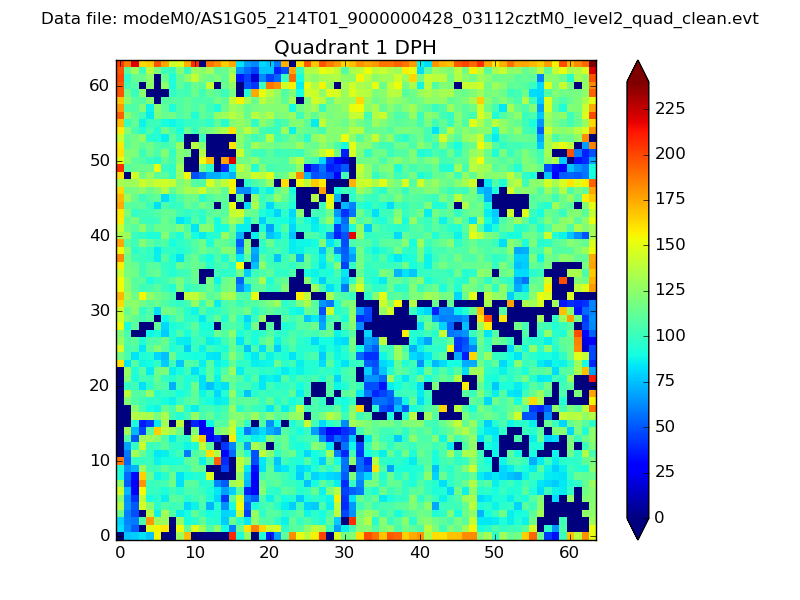 |
Quadrant B |
|---|---|---|---|
| Quadrant D | 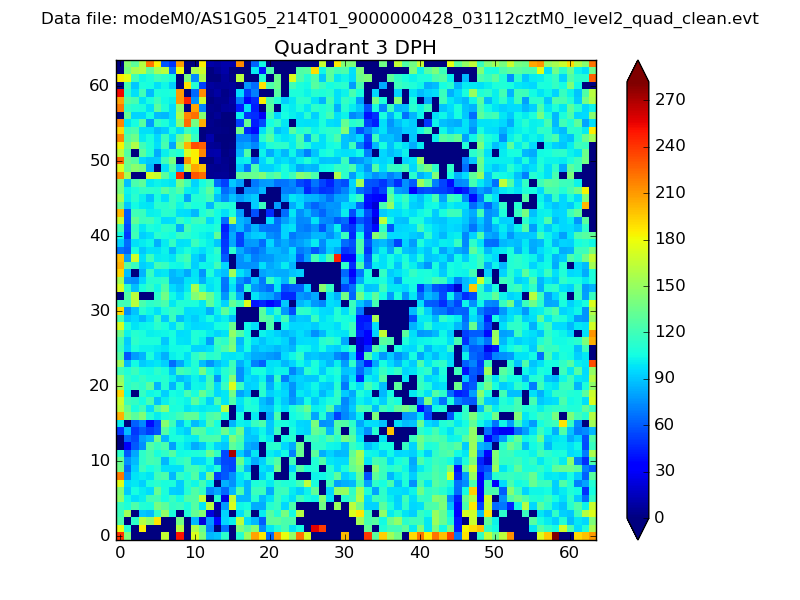 |
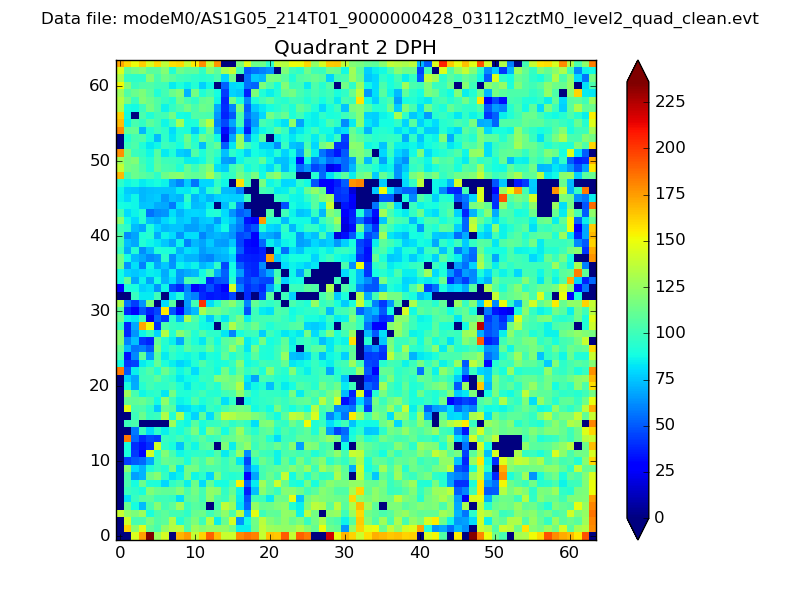 |
Quadrant C |
| Plot type | Count rate plots | Images |
|---|---|---|
| Comparison with Poisson distribution Blue bars denote a histogram of data divided into 1 sec bins. Red curve is a Poisson curve with rate = median count rate of data. |
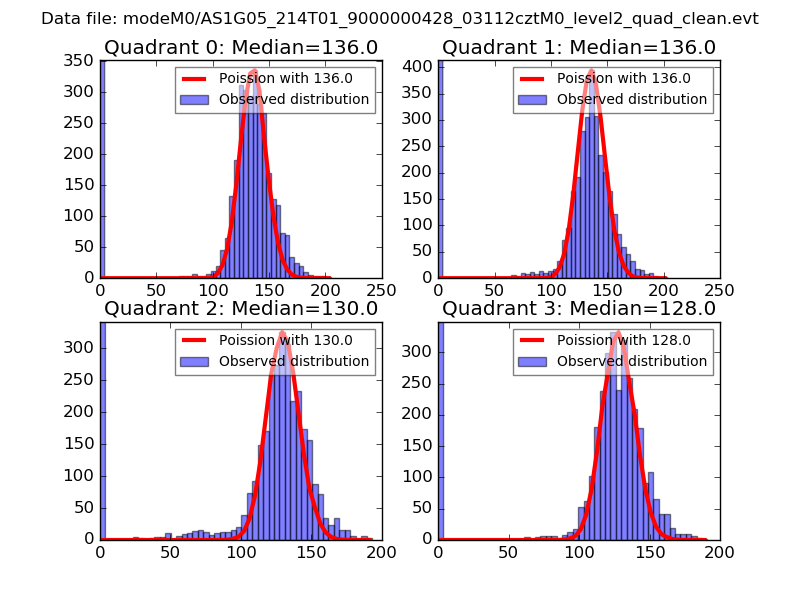 |
 |
| Quadrant-wise count rates Data is divided into 100 sec bins |
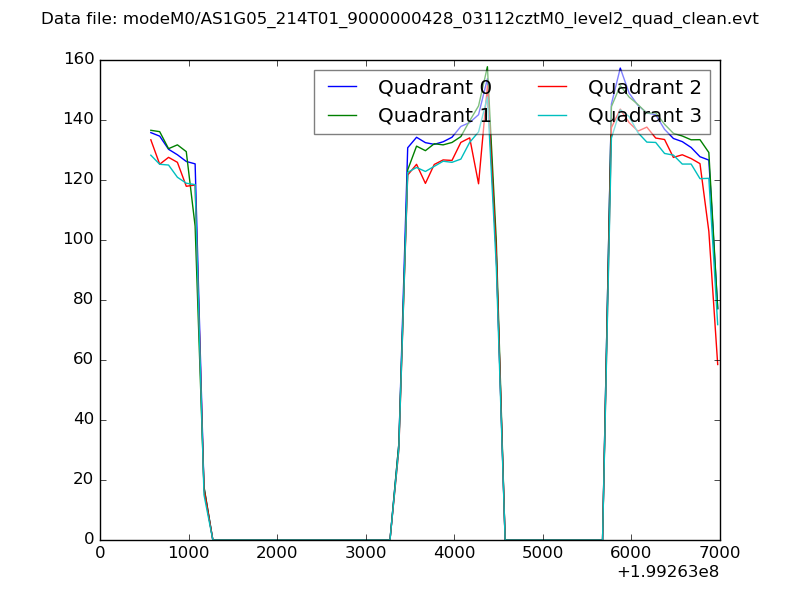 |
|
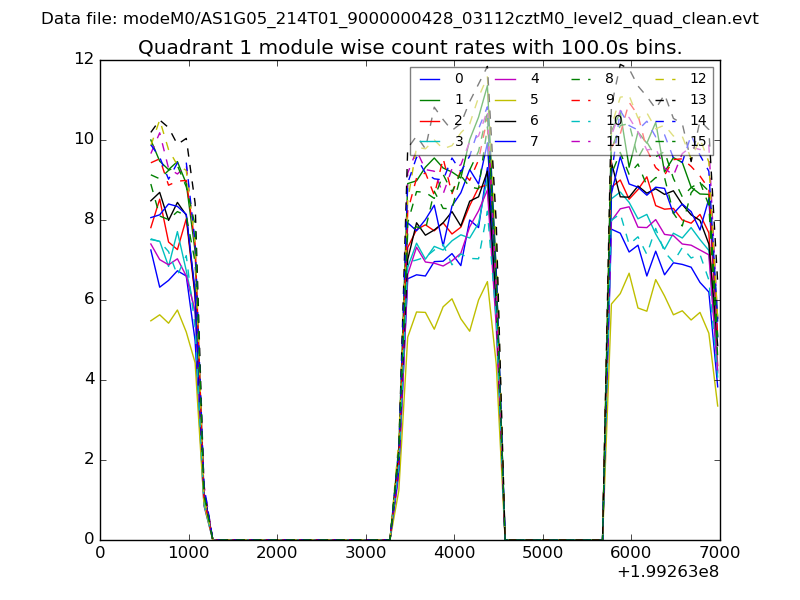
| Module-wise count rates for Quadrant A Data is divided into 100 sec bins |
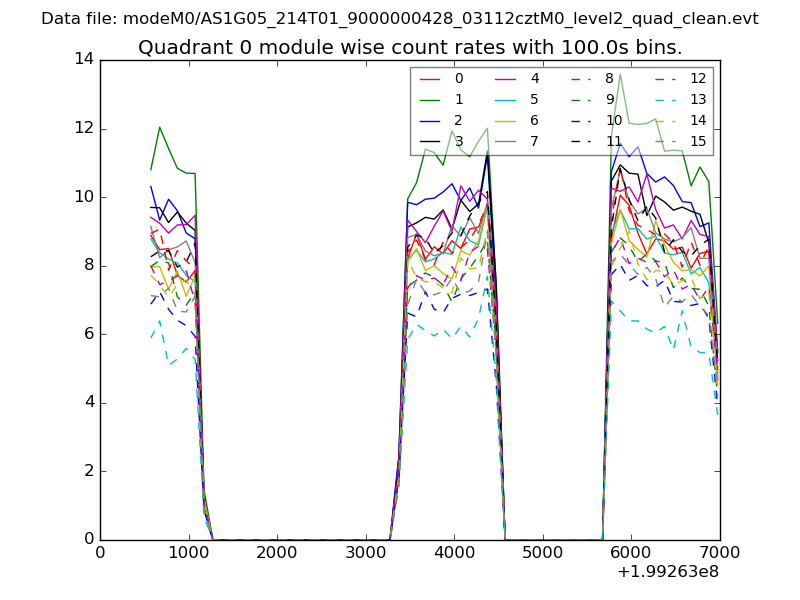 |
 |
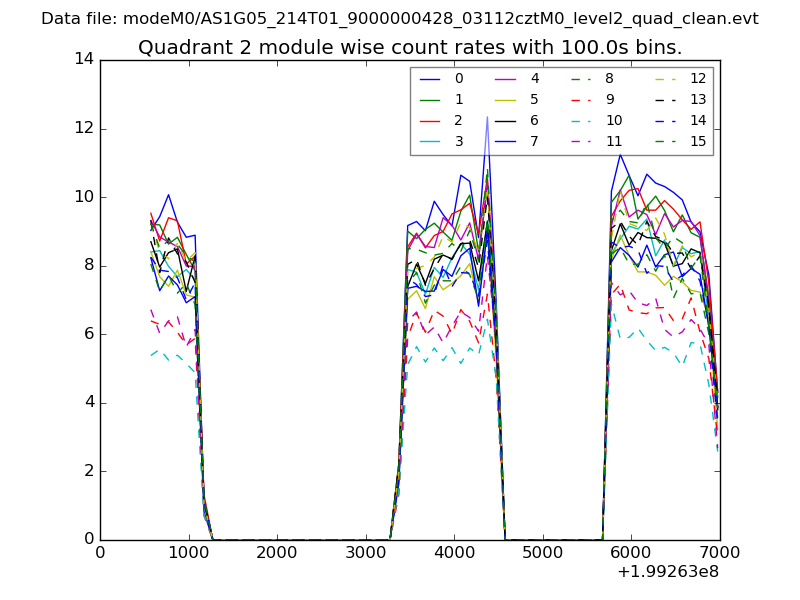
| Module-wise count rates for Quadrant B Data is divided into 100 sec bins |
 |
 |
| Module-wise count rates for Quadrant C Data is divided into 100 sec bins |
 |
 |
| Module-wise count rates for Quadrant D Data is divided into 100 sec bins |
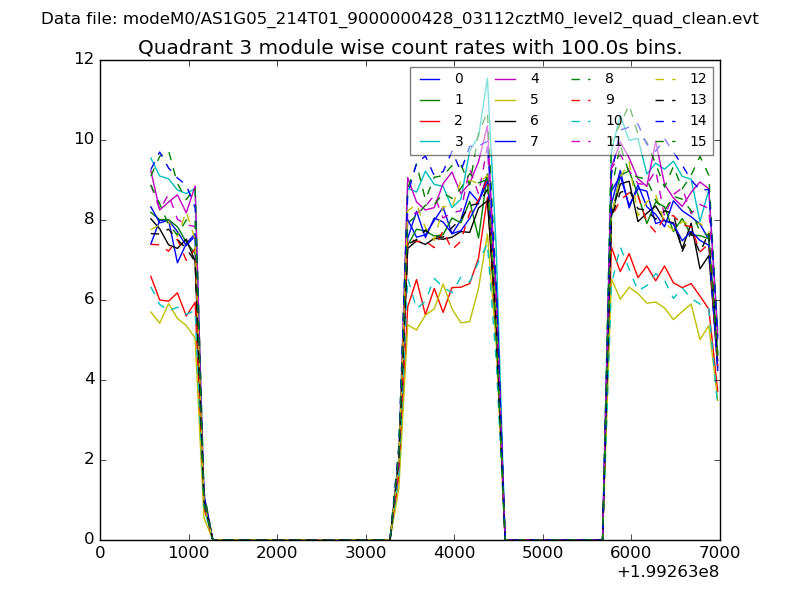 |
 |
| Parameter | Plot |
|---|---|
| CZT HV Monitor | 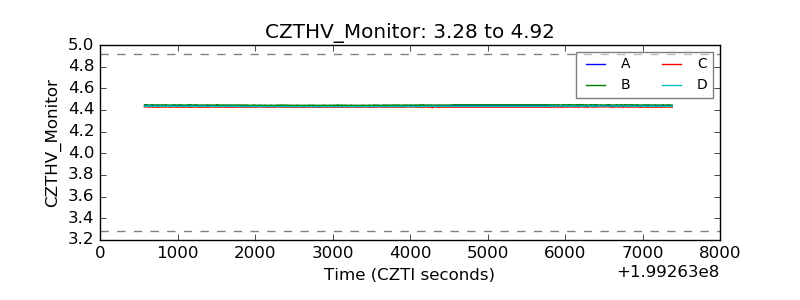 |
| D_VDD | 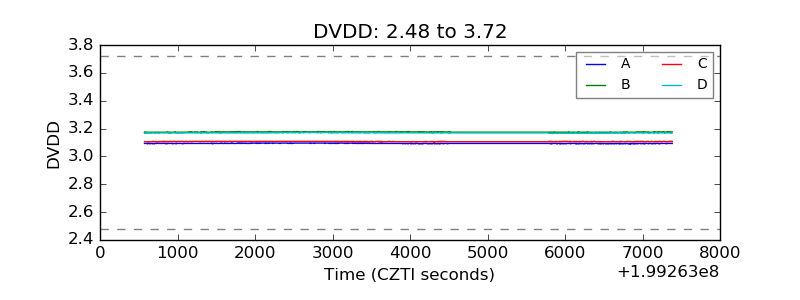 |
| Temperature 1 | 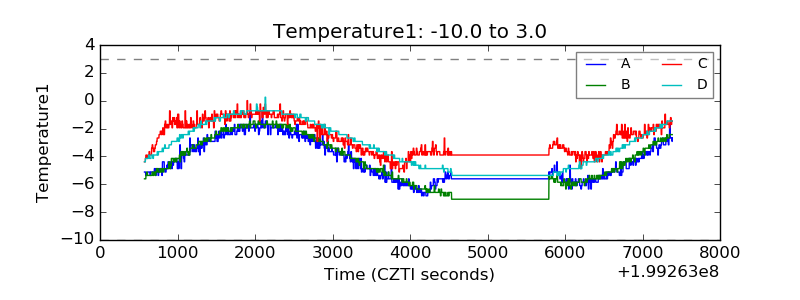 |
| Veto HV Monitor | 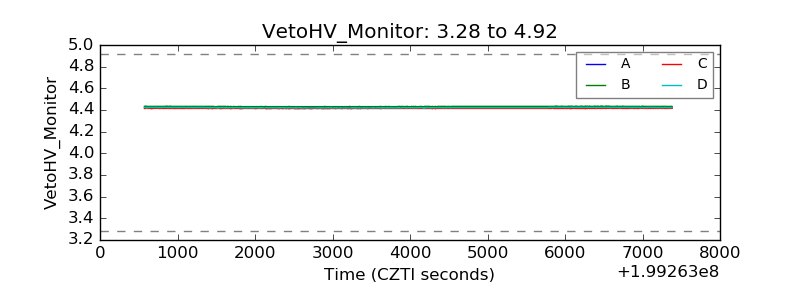 |
| Veto LLD | 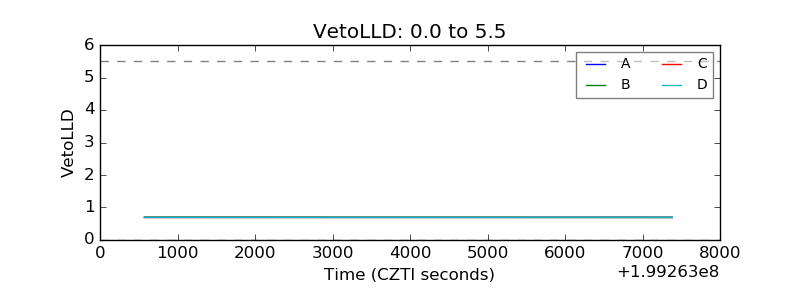 |
| Alpha Counter | 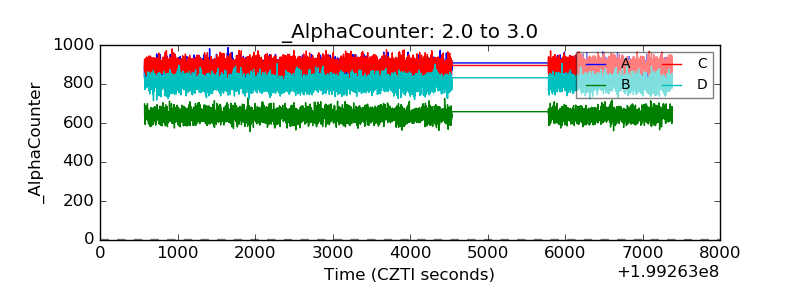 |
| _CPM_Rate | 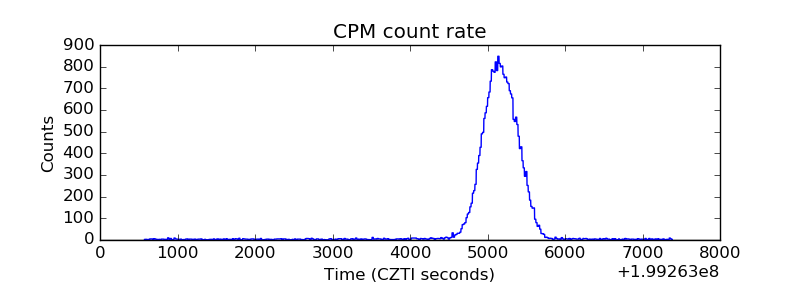 |
| CZT Counter | 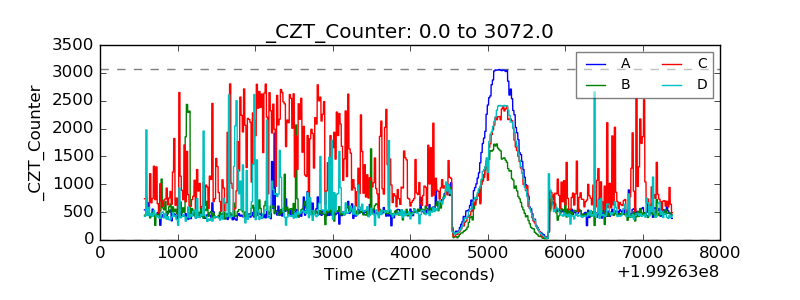 |
| +2.5 Volts monitor | 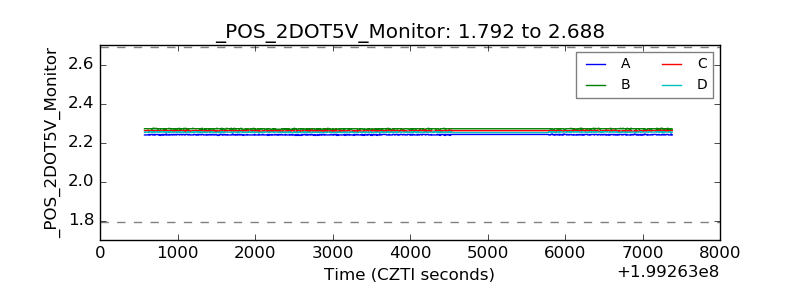 |
| +5 Volts monitor | 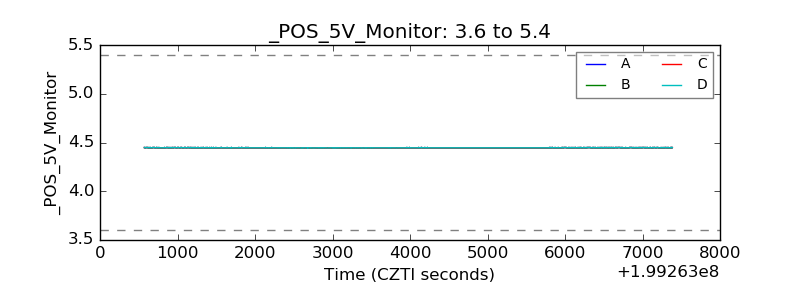 |
| _ROLL_ROT | 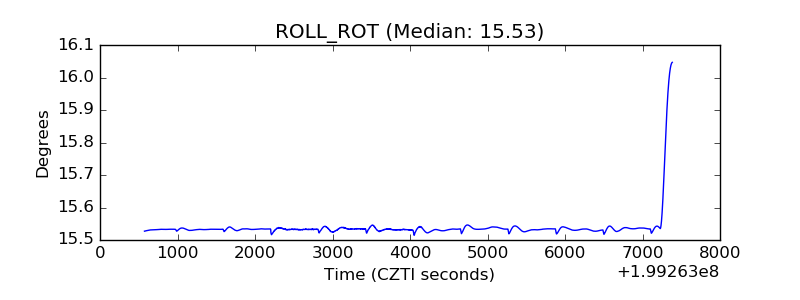 |
| _Roll_DEC | 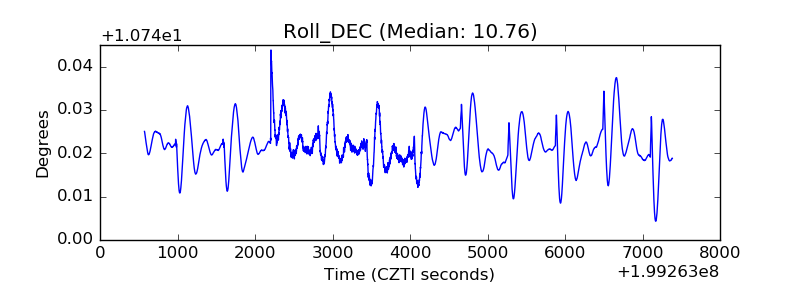 |
| _Roll_RA | 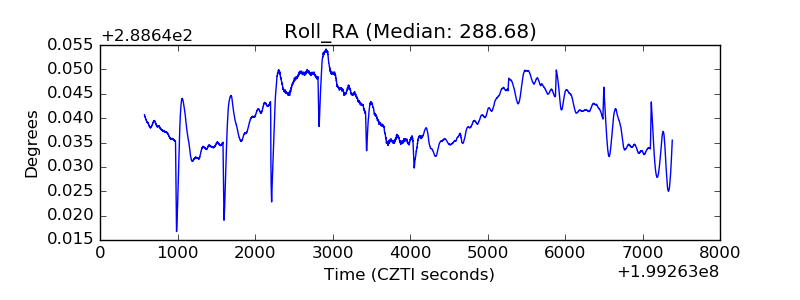 |
| Veto Counter | 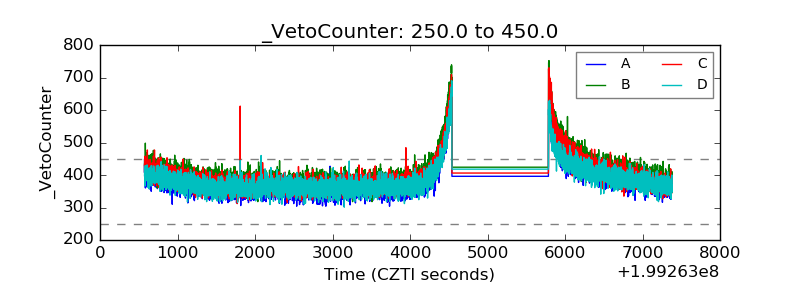 |