| Param | Original file | Final file |
|---|---|---|
| Filename | modeM0/AS1G05_214T01_9000000428_03113cztM0_level2.evt | modeM0/AS1G05_214T01_9000000428_03113cztM0_level2_quad_clean.evt |
| Size (bytes) | 443,926,080 | 60,344,640 |
| Size | 423.4 MB | 57.5 MB |
| Events in quadrant A | 2,918,970 | 366,564 |
| Events in quadrant B | 2,856,199 | 370,675 |
| Events in quadrant C | 4,550,961 | 355,729 |
| Events in quadrant D | 2,746,717 | 350,976 |
| Mode M0 | |||
|---|---|---|---|
| Quadrant | BADHDUFLAG | Total packets | Discarded packets |
| A | 0 | 12109 | 0 |
| B | 0 | 11867 | 0 |
| C | 0 | 17465 | 0 |
| D | 0 | 11932 | 0 |
| Mode SS | |||
|---|---|---|---|
| Quadrant | BADHDUFLAG | Total packets | Discarded packets |
| A | 0 | 110 | 0 |
| B | 0 | 110 | 0 |
| C | 0 | 110 | 0 |
| D | 0 | 110 | 0 |
| Mode M9 | |||
|---|---|---|---|
| Quadrant | BADHDUFLAG | Total packets | Discarded packets |
| A | 0 | 12 | 0 |
| B | 0 | 12 | 0 |
| C | 0 | 12 | 0 |
| D | 0 | 12 | 0 |
| Quadrant | Total seconds | Saturated seconds | Saturation percentage |
|---|---|---|---|
| A | 5475 | 133 | 2.429224% |
| B | 5475 | 111 | 2.027397% |
| C | 5475 | 244 | 4.456621% |
| D | 5475 | 110 | 2.009132% |
Noise dominated data is calculated using 1-second bins in cleaned event files. If a bin has >2000 counts, and if more than 50% of those come from <1% of pixels, then it is considered to be noise-dominated and hence unusable.
| Quadrant | # 1 sec bins | Bins with >0 counts | Bins with >2000 counts | High rate bins dominated by noise | Noise dominated (total time) | Noise dominated (detector-on time) | Marked lightcurve |
|---|---|---|---|---|---|---|---|
| A | 6625 | 5476 | 16 | 16 | 0.24% | 0.29% | 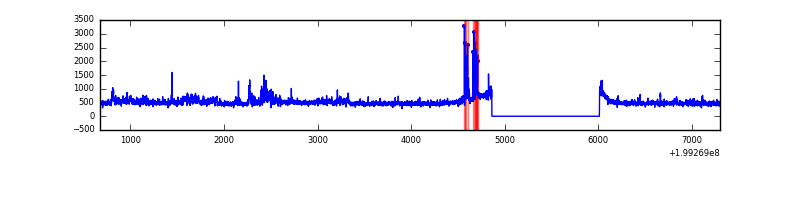 |
| B | 6625 | 5476 | 15 | 15 | 0.23% | 0.27% | 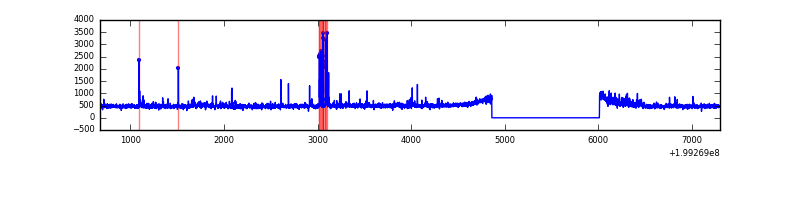 |
| C | 6625 | 5476 | 128 | 128 | 1.93% | 2.34% | 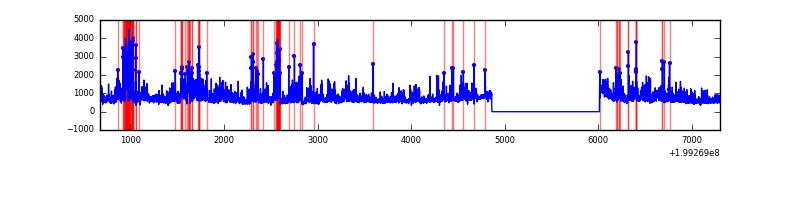 |
| D | 6625 | 5476 | 33 | 33 | 0.50% | 0.60% | 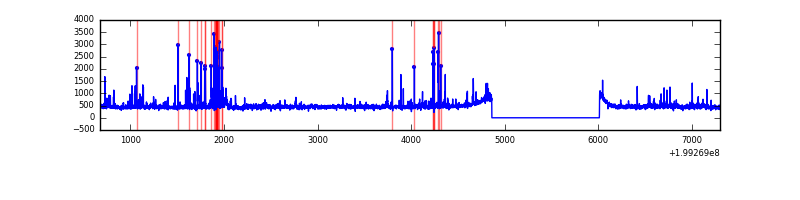 |
Top three noisy pixels from each quadrant. If the there are fewer than three noisy pixels in the level2.evt file, extra rows are filled as -1
| Pixel properties | Quadrant properties | ||||||
|---|---|---|---|---|---|---|---|
| Quadrant | DetID | PixID | Counts | Sigma | Mean | Median | Sigma |
| A | 8 | 15 | 228551 | 1673.4 | 665 | 651 | 136.2 |
| A | 14 | 249 | 84440 | 615.24 | 665 | 651 | 136.2 |
| A | 12 | 247 | 13483 | 94.22 | 665 | 651 | 136.2 |
| B | 2 | 249 | 81013 | 616.32 | 671 | 655 | 130.4 |
| B | 4 | 81 | 71955 | 546.85 | 671 | 655 | 130.4 |
| B | 15 | 204 | 64362 | 488.61 | 671 | 655 | 130.4 |
| C | 0 | 219 | 1652602 | 11149.35 | 629 | 633 | 148.2 |
| C | 14 | 223 | 367805 | 2478.09 | 629 | 633 | 148.2 |
| C | 6 | 80 | 38309 | 254.28 | 629 | 633 | 148.2 |
| D | 13 | 120 | 187309 | 1101.87 | 638 | 623 | 169.4 |
| D | 2 | 136 | 29163 | 168.45 | 638 | 623 | 169.4 |
| D | 10 | 85 | 20919 | 119.79 | 638 | 623 | 169.4 |
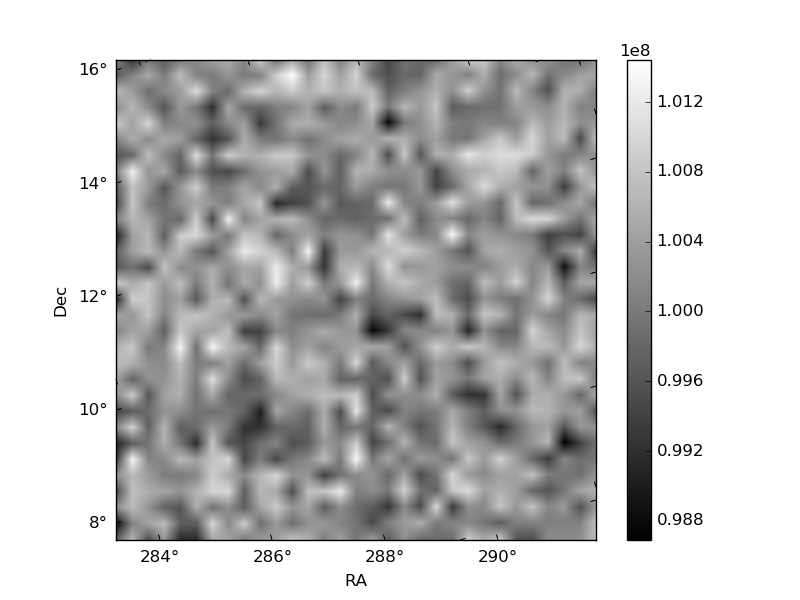
Histogram calculated using DETX and DETY for each event in the final _common_clean file
| Quadrant A | 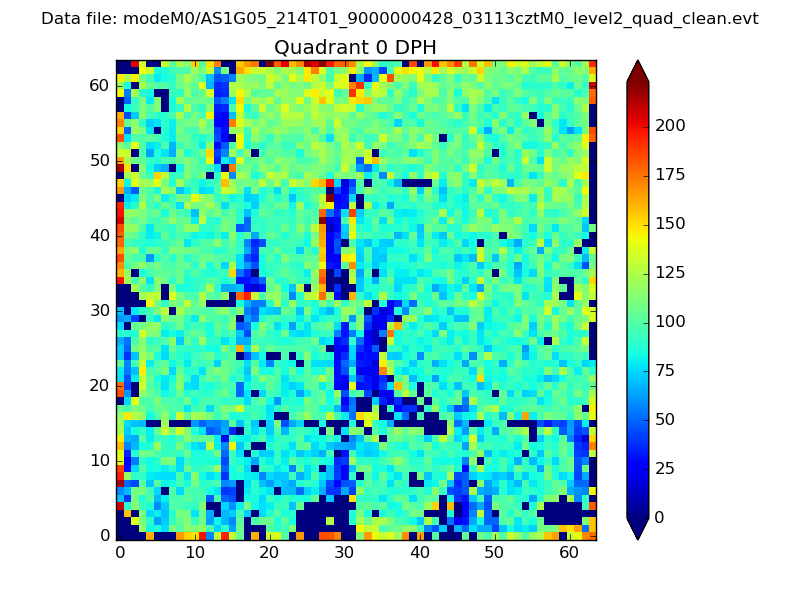 |
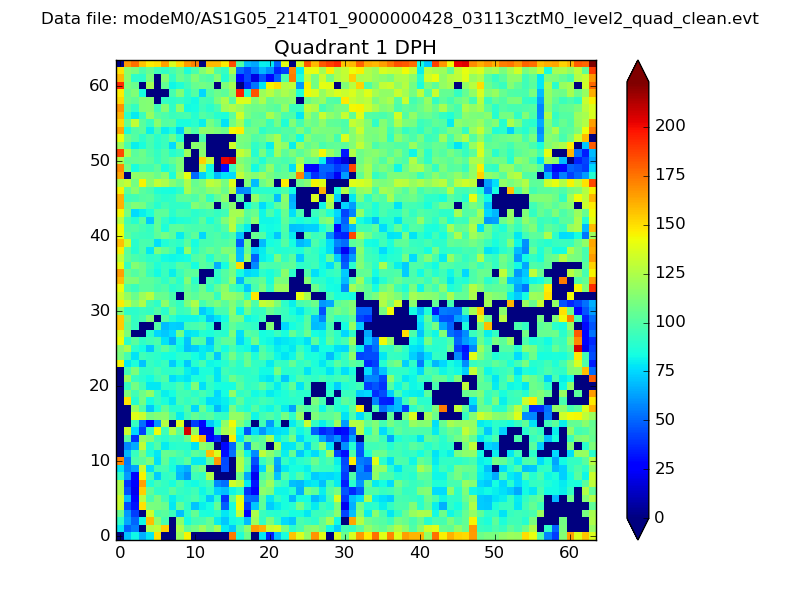 |
Quadrant B |
|---|---|---|---|
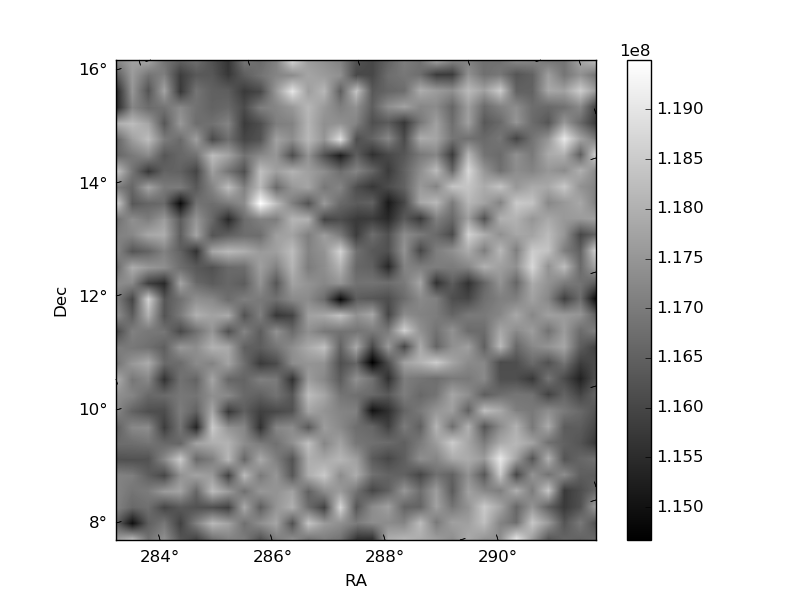
| Quadrant D |  |
 |
Quadrant C |
| Plot type | Count rate plots | Images |
|---|---|---|
| Comparison with Poisson distribution Blue bars denote a histogram of data divided into 1 sec bins. Red curve is a Poisson curve with rate = median count rate of data. |
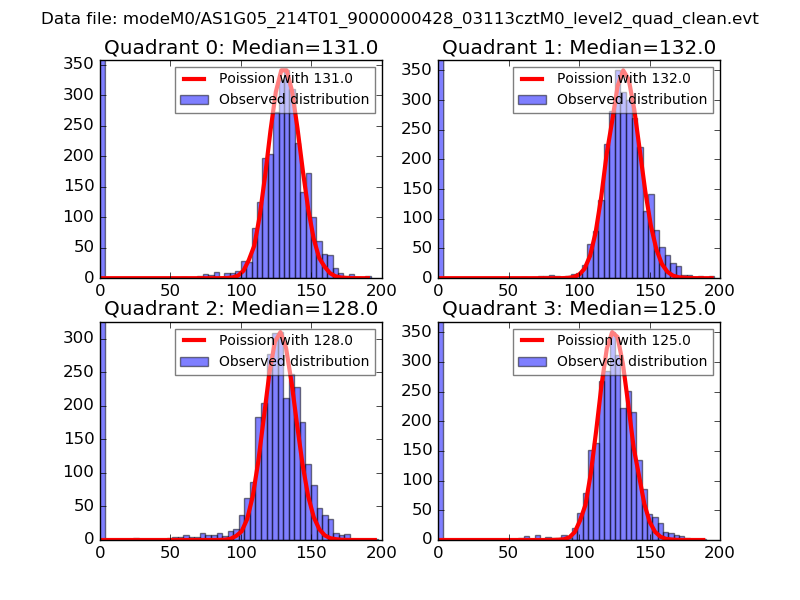 |
 |
| Quadrant-wise count rates Data is divided into 100 sec bins |
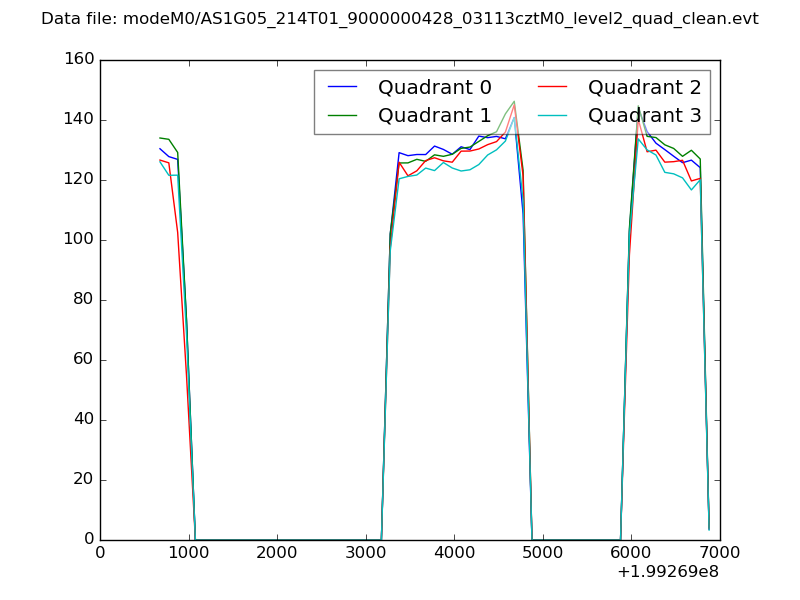 |
|
| Module-wise count rates for Quadrant A Data is divided into 100 sec bins |
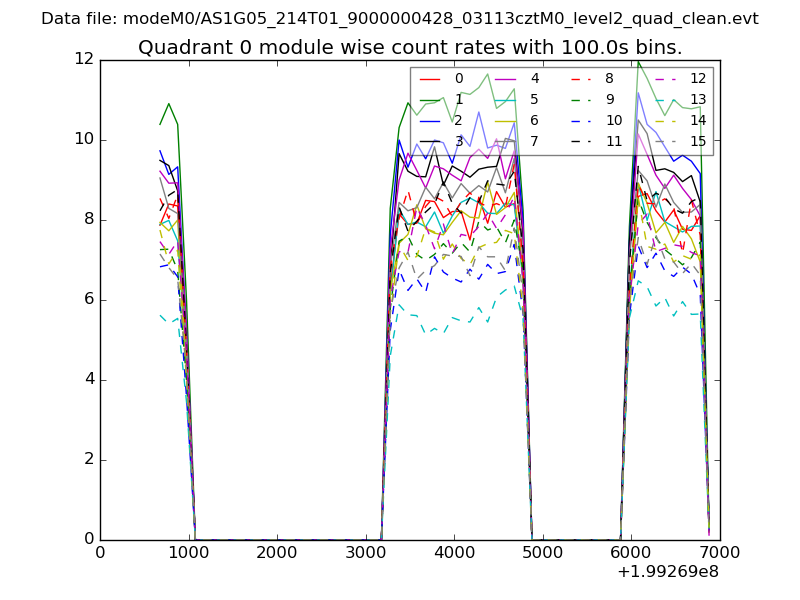 |
 |
| Module-wise count rates for Quadrant B Data is divided into 100 sec bins |
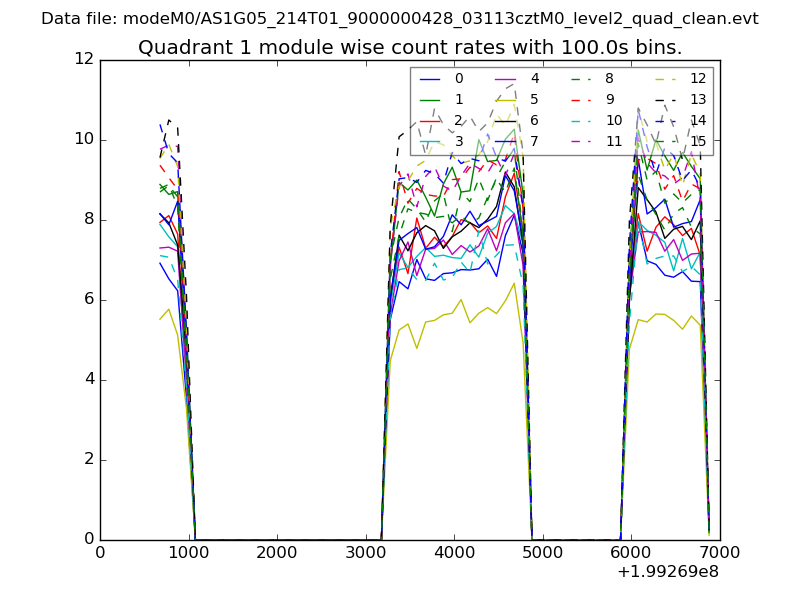 |
 |
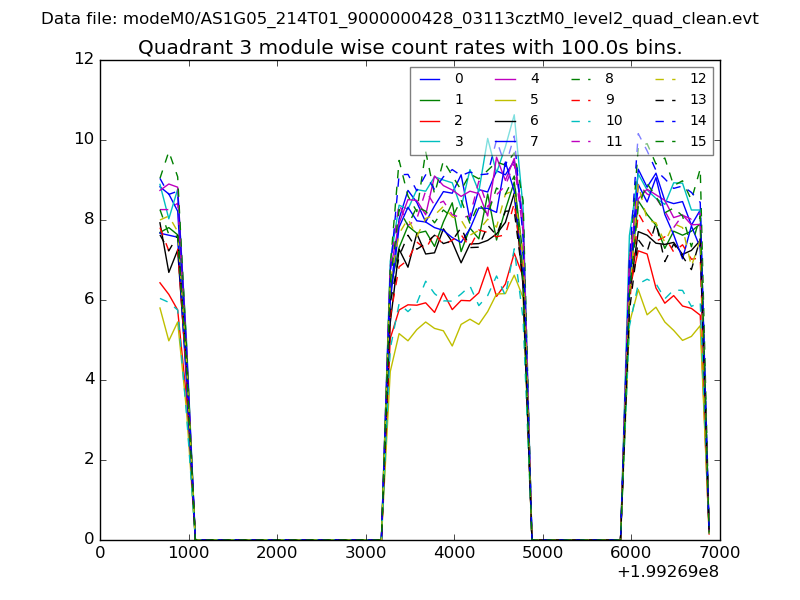
| Module-wise count rates for Quadrant C Data is divided into 100 sec bins |
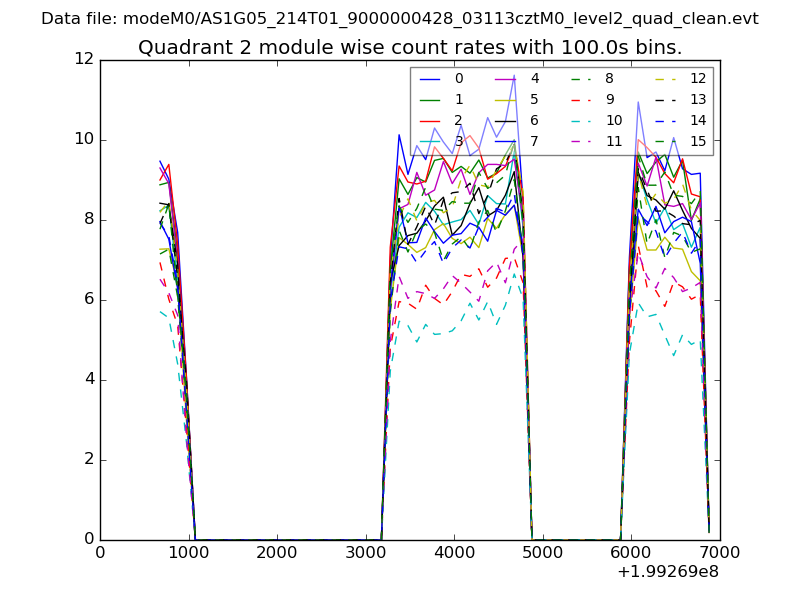 |
 |
| Module-wise count rates for Quadrant D Data is divided into 100 sec bins |
 |
 |
| Parameter | Plot |
|---|---|
| CZT HV Monitor | 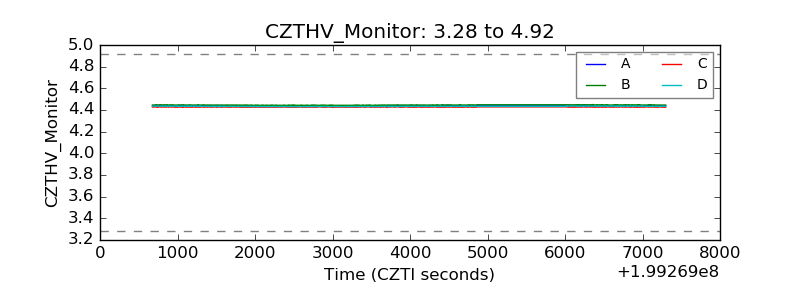 |
| D_VDD | 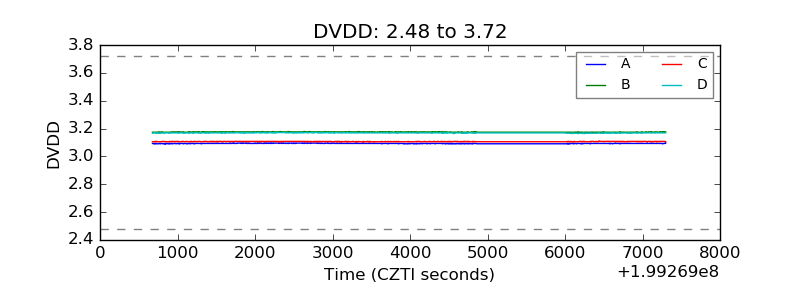 |
| Temperature 1 | 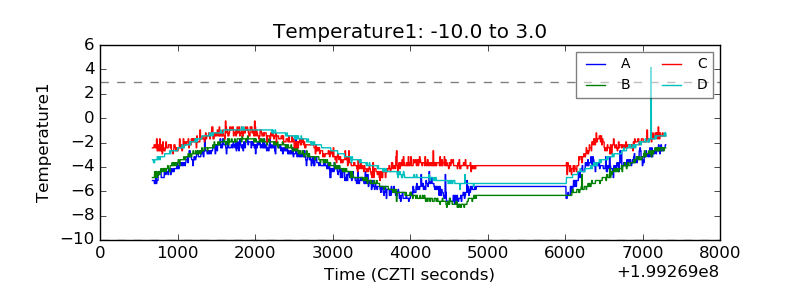 |
| Veto HV Monitor | 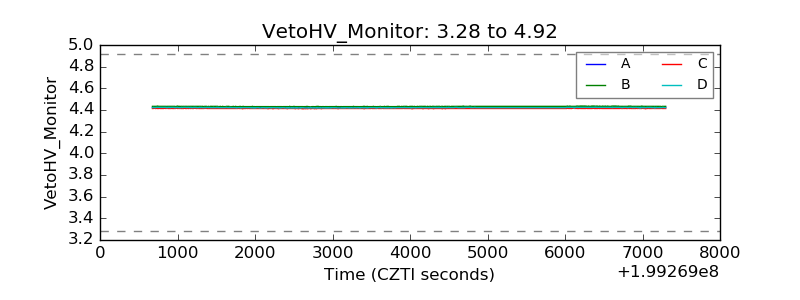 |
| Veto LLD | 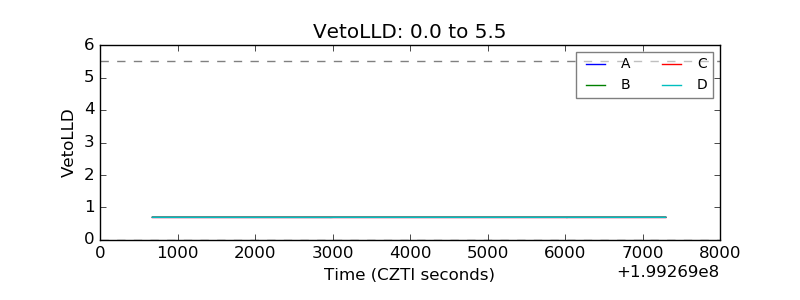 |
| Alpha Counter | 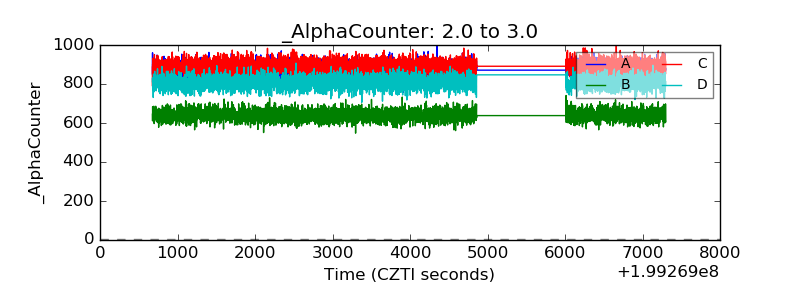 |
| _CPM_Rate | 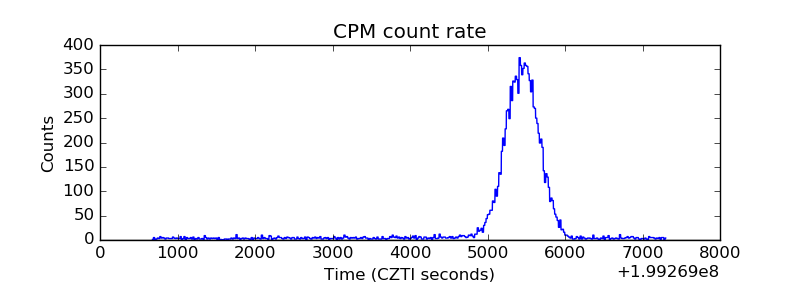 |
| CZT Counter |  |
| +2.5 Volts monitor |  |
| +5 Volts monitor |  |
| _ROLL_ROT | 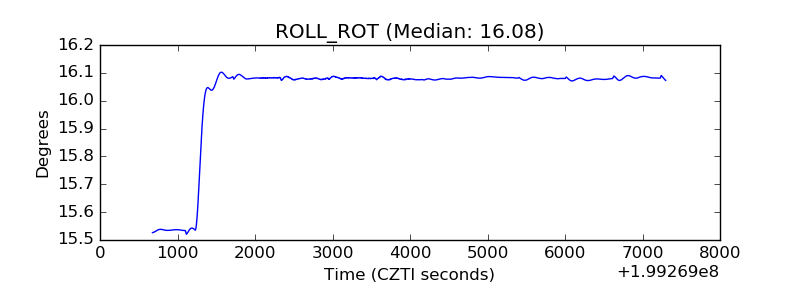 |
| _Roll_DEC | 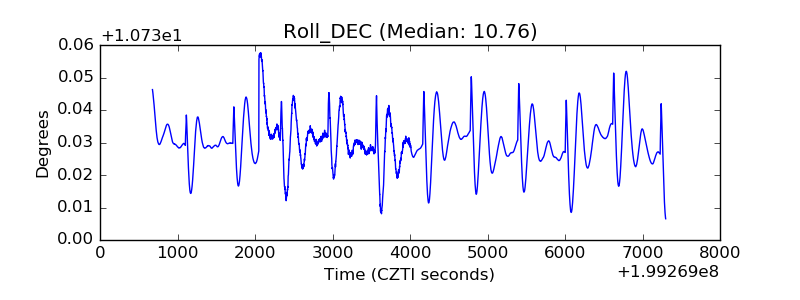 |
| _Roll_RA | 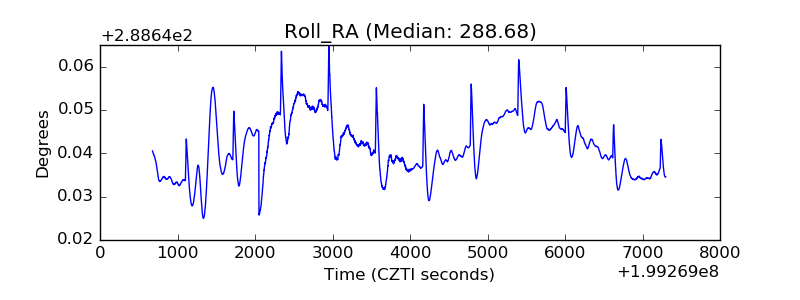 |
| Veto Counter | 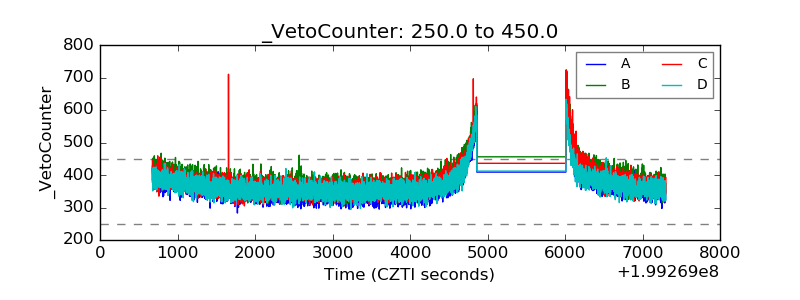 |