| Param | Original file | Final file |
|---|---|---|
| Filename | modeM0/AS1G05_214T01_9000000428_03116cztM0_level2.evt | modeM0/AS1G05_214T01_9000000428_03116cztM0_level2_quad_clean.evt |
| Size (bytes) | 12,772,800 | 3,110,400 |
| Size | 12.2 MB | 3.0 MB |
| Events in quadrant A | 119,939 | 19,399 |
| Events in quadrant B | 119,586 | 19,879 |
| Events in quadrant C | 12,841 | 882 |
| Events in quadrant D | 112,205 | 26,222 |
| Mode M0 | |||
|---|---|---|---|
| Quadrant | BADHDUFLAG | Total packets | Discarded packets |
| A | 0 | 11937 | 11413 |
| B | 0 | 12084 | 11564 |
| C | 0 | 17516 | 17468 |
| D | 0 | 12217 | 11706 |
| Mode SS | |||
|---|---|---|---|
| Quadrant | BADHDUFLAG | Total packets | Discarded packets |
| A | 0 | 112 | 79 |
| B | 0 | 112 | 79 |
| C | 0 | 112 | 77 |
| D | 0 | 112 | 82 |
| Quadrant | Total seconds | Saturated seconds | Saturation percentage |
|---|---|---|---|
| A | 262 | 1 | 0.381679% |
| B | 260 | 0 | 0.000000% |
| C | 24 | 0 | 0.000000% |
| D | 257 | 0 | 0.000000% |
Noise dominated data is calculated using 1-second bins in cleaned event files. If a bin has >2000 counts, and if more than 50% of those come from <1% of pixels, then it is considered to be noise-dominated and hence unusable.
| Quadrant | # 1 sec bins | Bins with >0 counts | Bins with >2000 counts | High rate bins dominated by noise | Noise dominated (total time) | Noise dominated (detector-on time) | Marked lightcurve |
|---|---|---|---|---|---|---|---|
| A | 4050 | 523 | 0 | 0 | 0.00% | 0.00% | 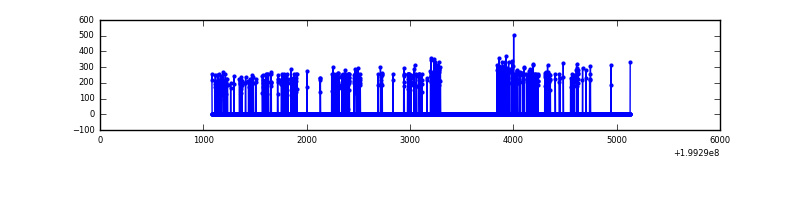 |
| B | 4066 | 519 | 0 | 0 | 0.00% | 0.00% | 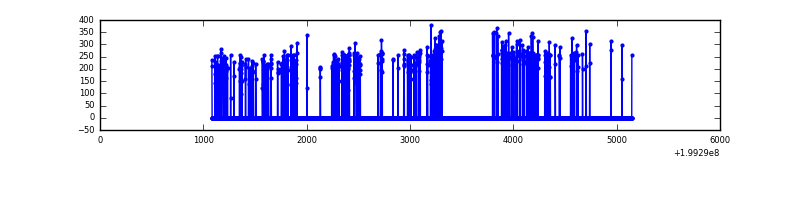 |
| C | 3898 | 47 | 0 | 0 | 0.00% | 0.00% | 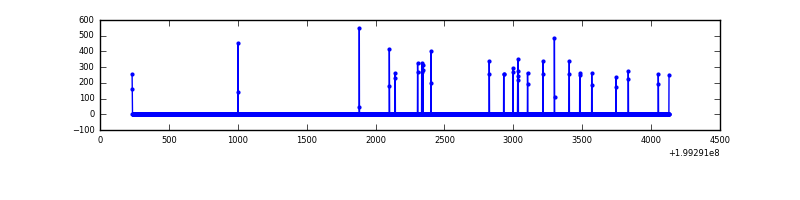 |
| D | 4050 | 513 | 0 | 0 | 0.00% | 0.00% | 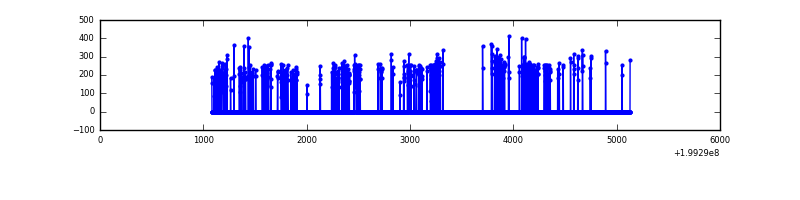 |
Top three noisy pixels from each quadrant. If the there are fewer than three noisy pixels in the level2.evt file, extra rows are filled as -1
| Pixel properties | Quadrant properties | ||||||
|---|---|---|---|---|---|---|---|
| Quadrant | DetID | PixID | Counts | Sigma | Mean | Median | Sigma |
| A | 12 | 189 | 1845 | 217.93 | 30 | 29 | 8.3 |
| A | 0 | 13 | 333 | 36.48 | 30 | 29 | 8.3 |
| A | 12 | 194 | 331 | 36.24 | 30 | 29 | 8.3 |
| B | 15 | 204 | 1138 | 136.78 | 30 | 29 | 8.1 |
| B | 12 | 111 | 367 | 41.69 | 30 | 29 | 8.1 |
| B | 0 | 198 | 305 | 34.04 | 30 | 29 | 8.1 |
| C | 14 | 223 | 1634 | 1010.24 | 2 | 2 | 1.6 |
| C | 0 | 219 | 113 | 68.71 | 2 | 2 | 1.6 |
| C | 1 | 192 | 40 | 23.52 | 2 | 2 | 1.6 |
| D | 13 | 239 | 1235 | 136.23 | 28 | 27 | 8.9 |
| D | 10 | 85 | 1093 | 120.21 | 28 | 27 | 8.9 |
| D | 13 | 114 | 948 | 103.86 | 28 | 27 | 8.9 |
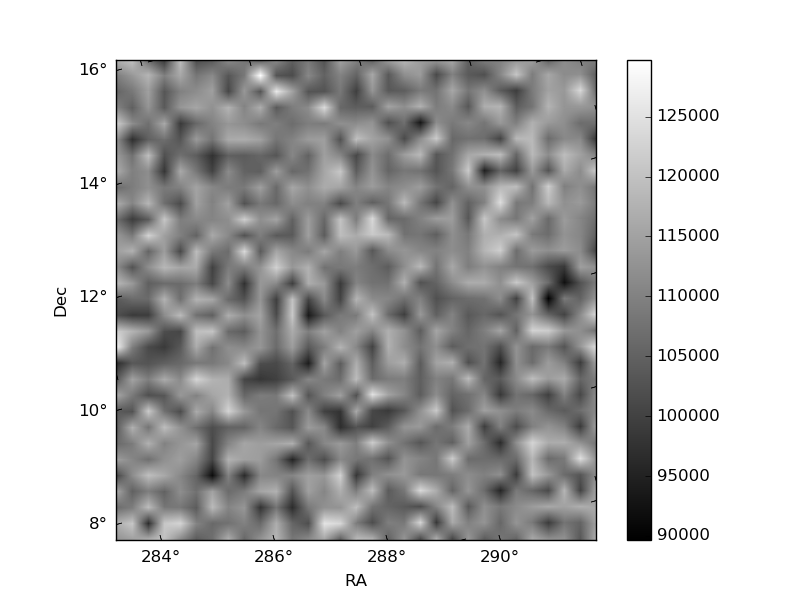
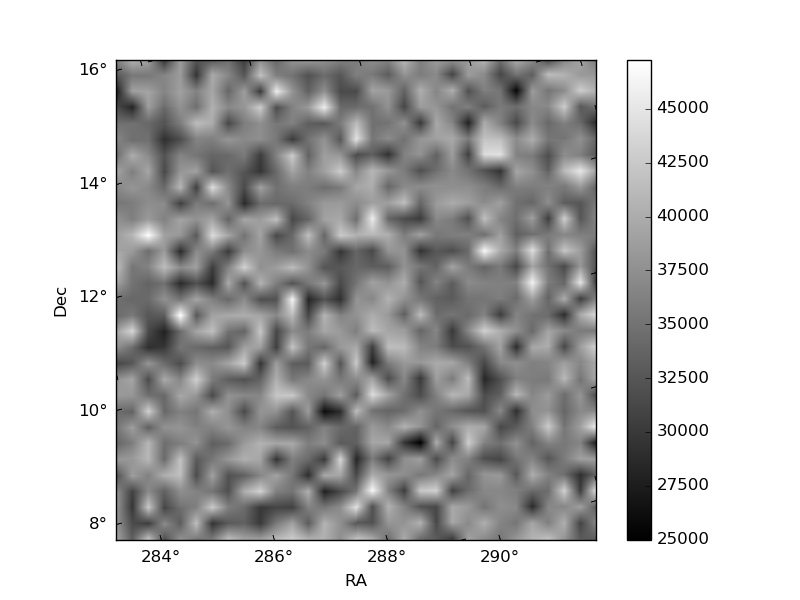
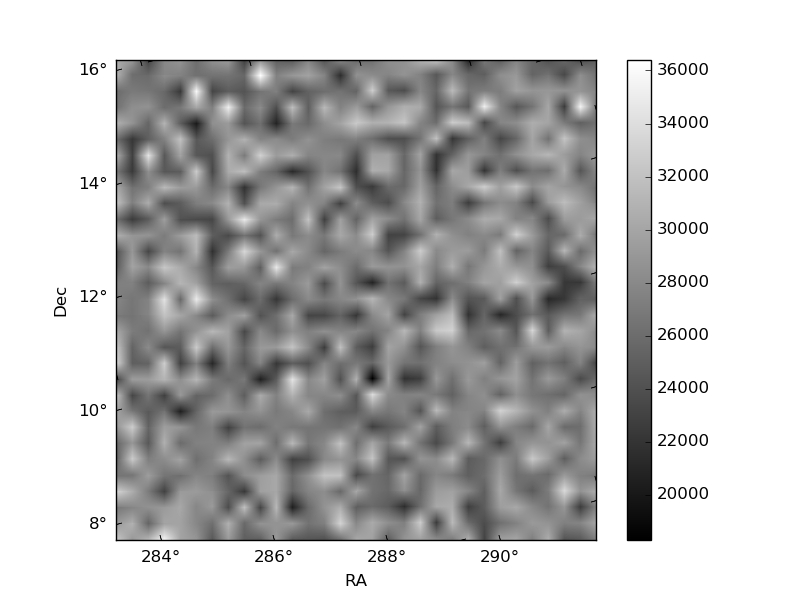
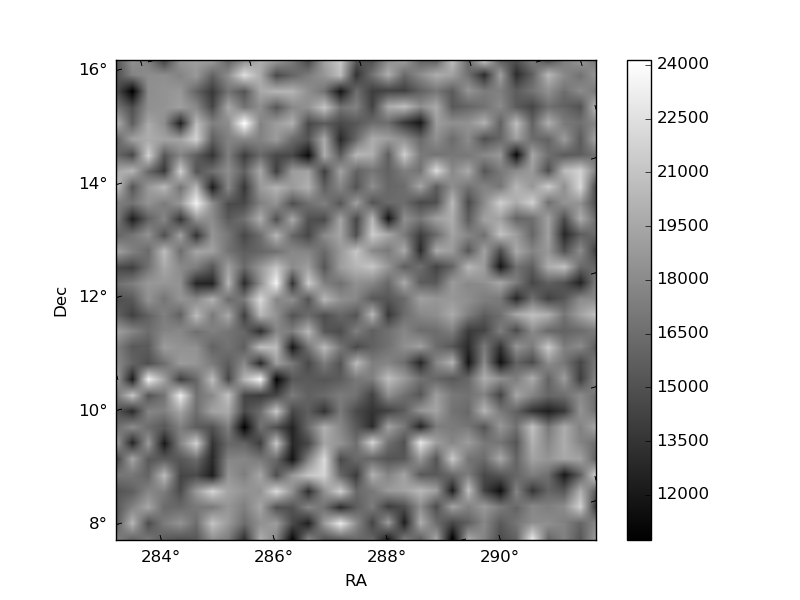
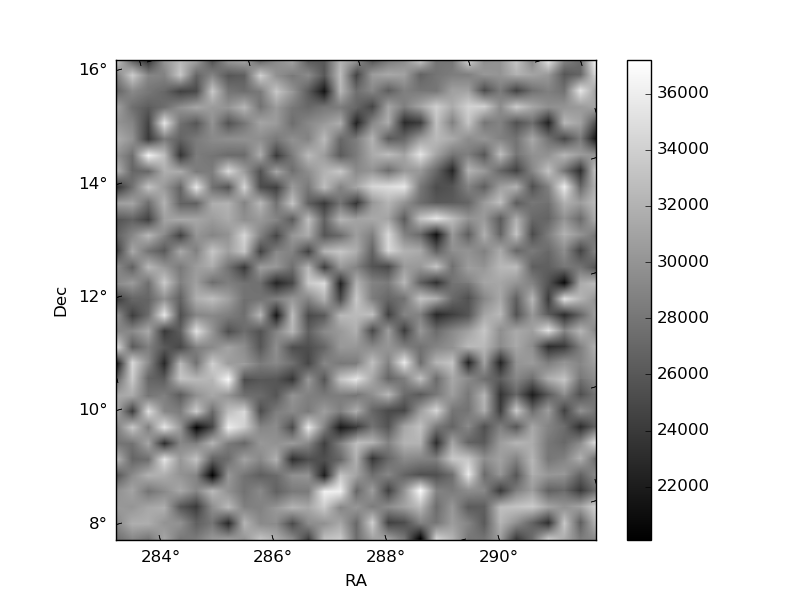
Histogram calculated using DETX and DETY for each event in the final _common_clean file
| Quadrant A | 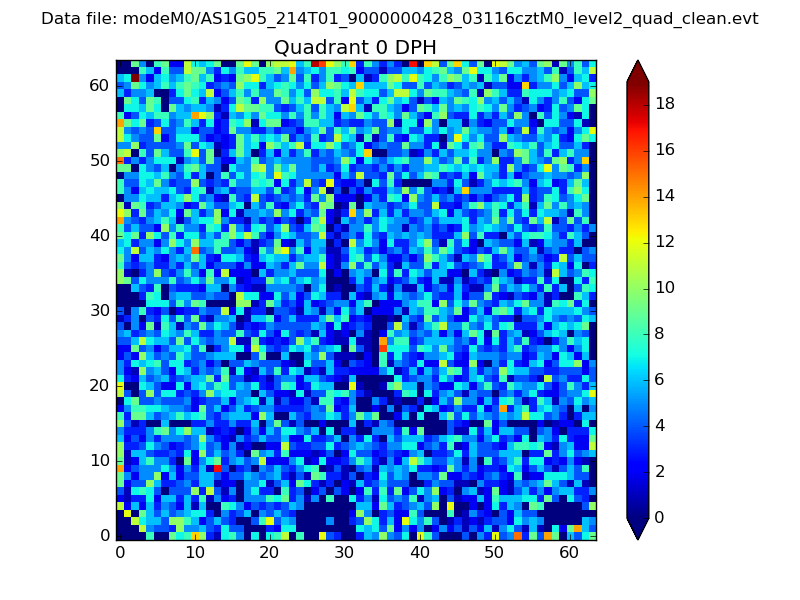 |
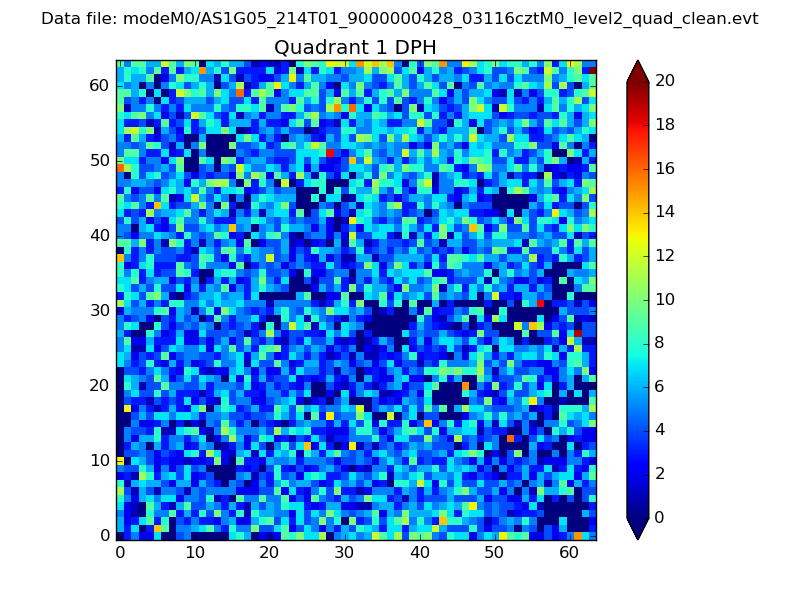 |
Quadrant B |
|---|---|---|---|
| Quadrant D | 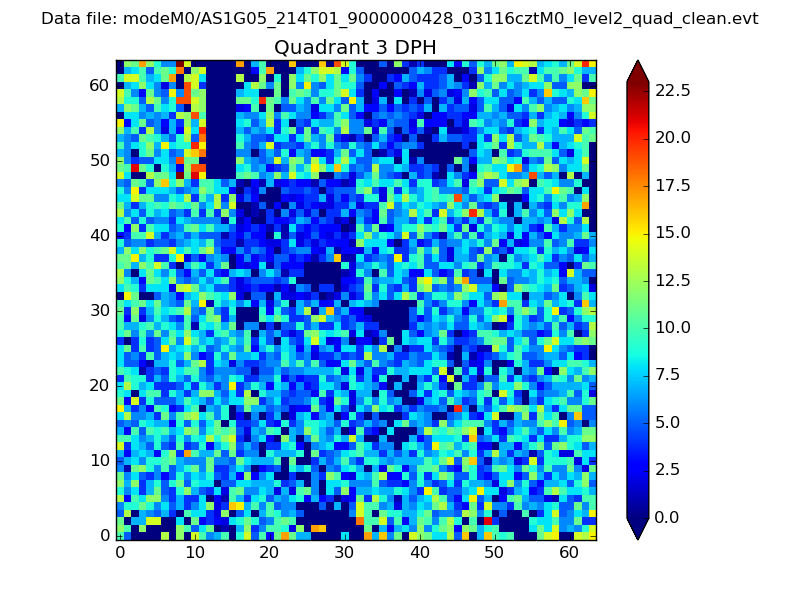 |
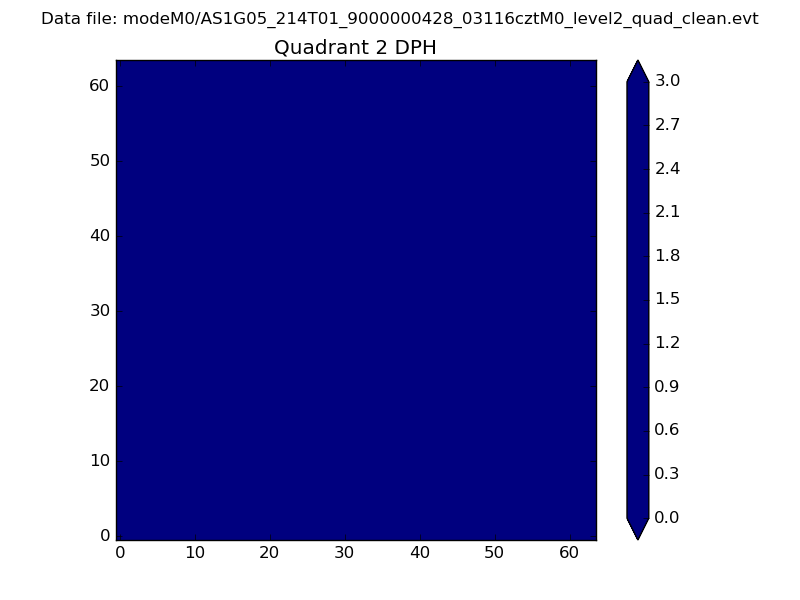 |
Quadrant C |
| Plot type | Count rate plots | Images |
|---|---|---|
| Comparison with Poisson distribution Blue bars denote a histogram of data divided into 1 sec bins. Red curve is a Poisson curve with rate = median count rate of data. |
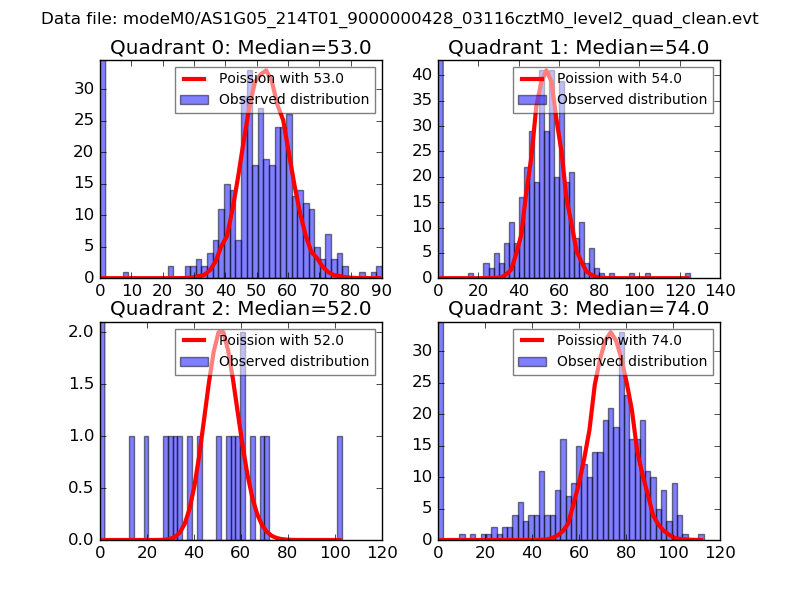 |
 |
| Quadrant-wise count rates Data is divided into 100 sec bins |
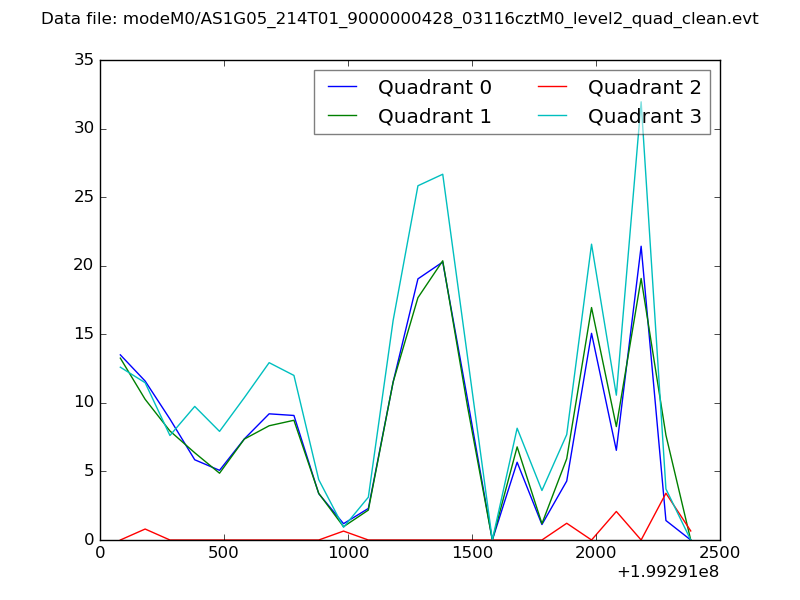 |
|
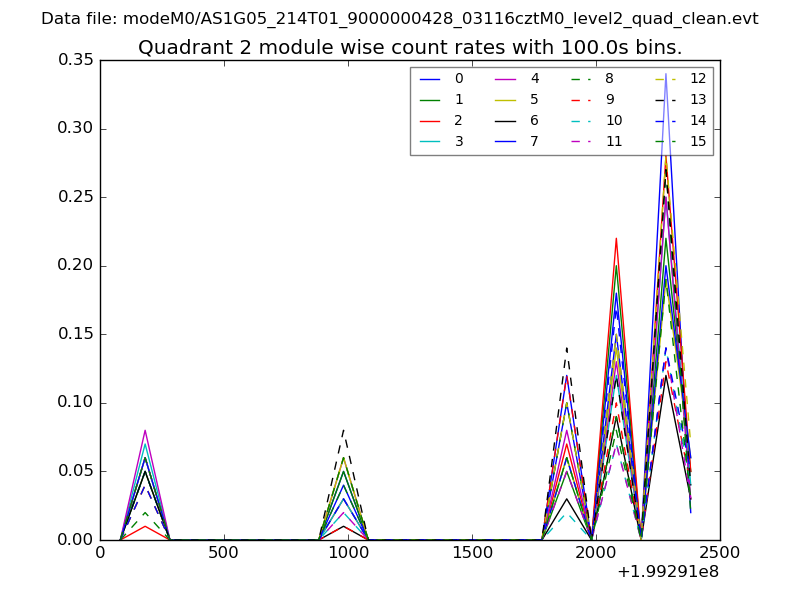
| Module-wise count rates for Quadrant A Data is divided into 100 sec bins |
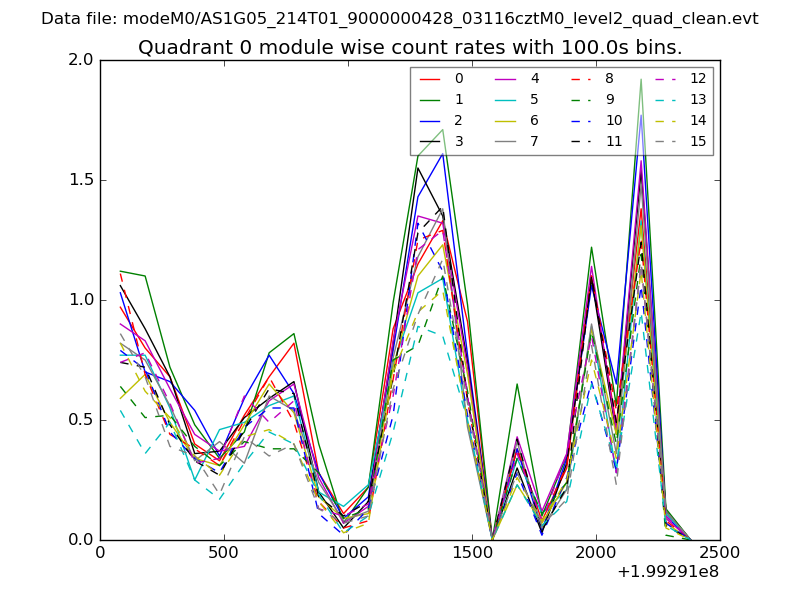 |
 |
| Module-wise count rates for Quadrant B Data is divided into 100 sec bins |
 |
 |
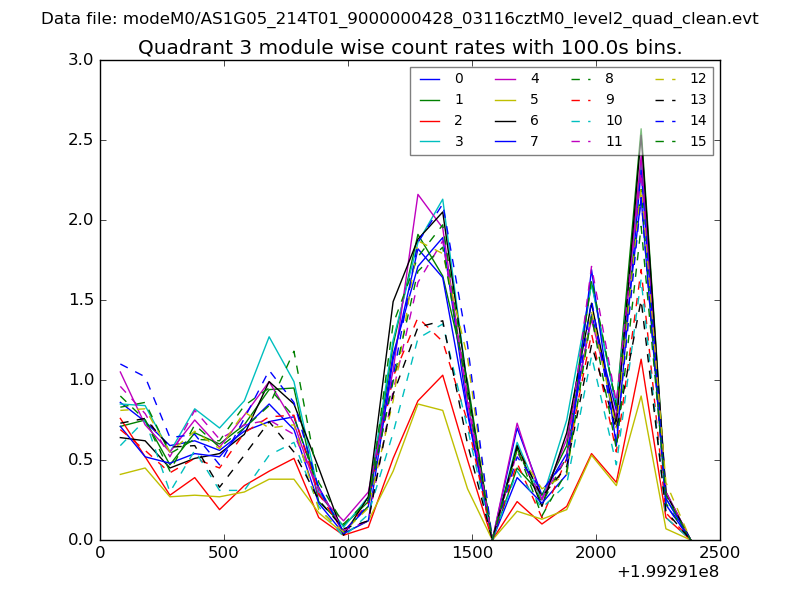
| Module-wise count rates for Quadrant C Data is divided into 100 sec bins |
 |
 |
| Module-wise count rates for Quadrant D Data is divided into 100 sec bins |
 |
 |
| Parameter | Plot |
|---|---|
| CZT HV Monitor | 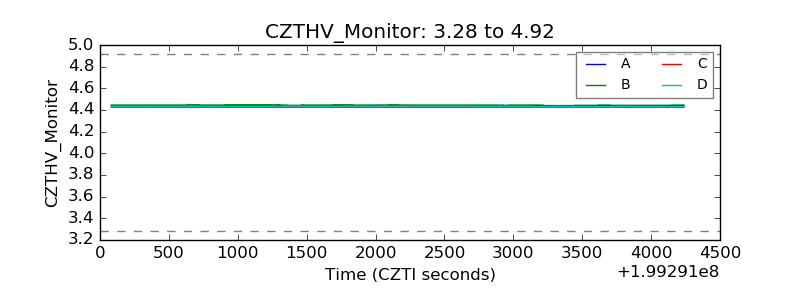 |
| D_VDD | 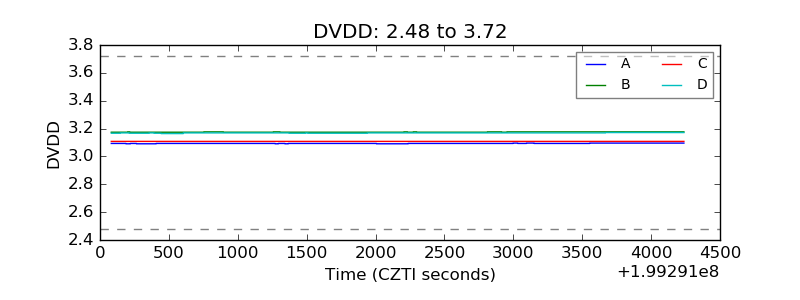 |
| Temperature 1 | 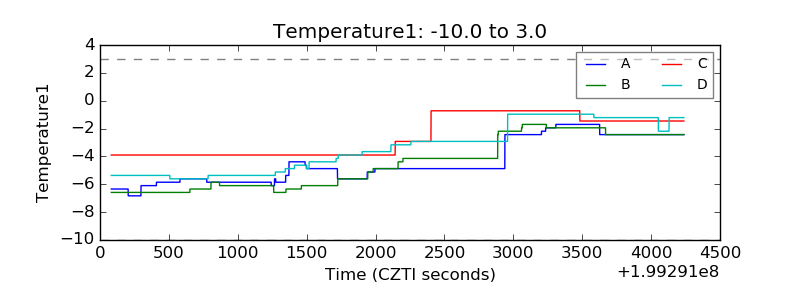 |
| Veto HV Monitor | 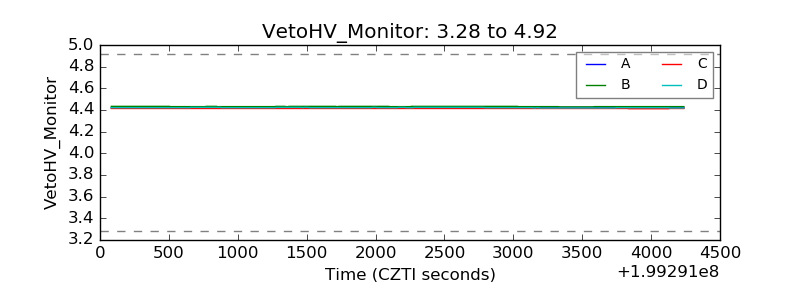 |
| Veto LLD |  |
| Alpha Counter | 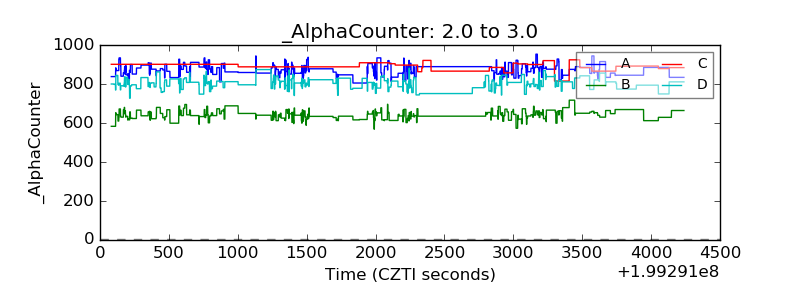 |
| _CPM_Rate | 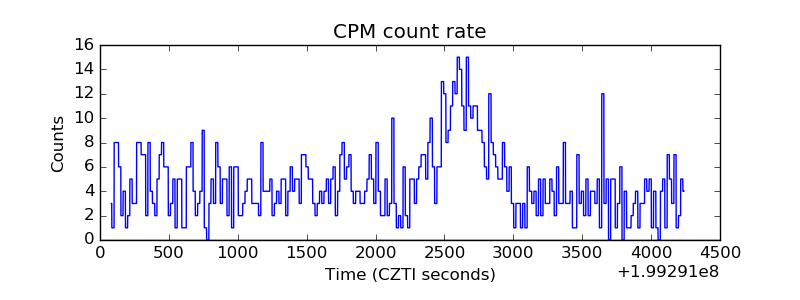 |
| CZT Counter | 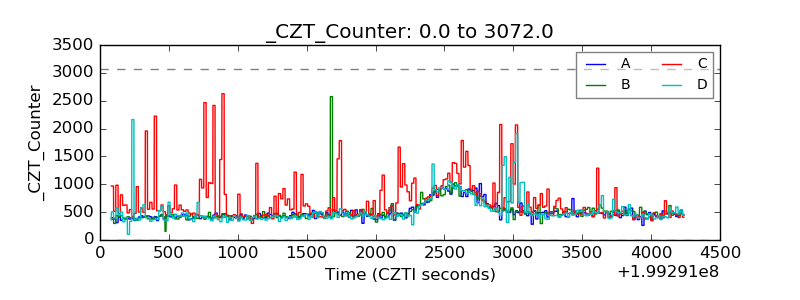 |
| +2.5 Volts monitor |  |
| +5 Volts monitor | 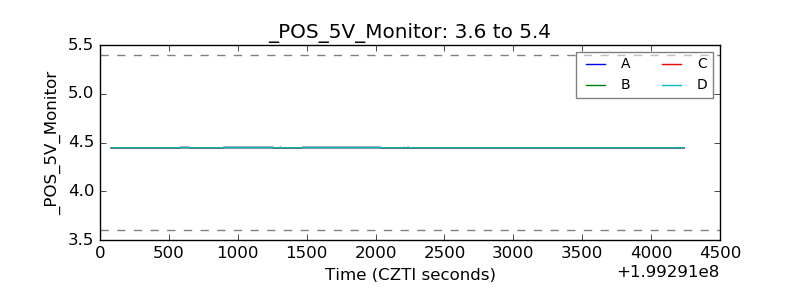 |
| _ROLL_ROT | 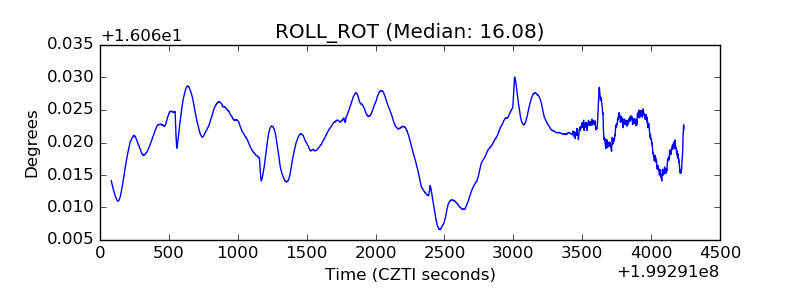 |
| _Roll_DEC | 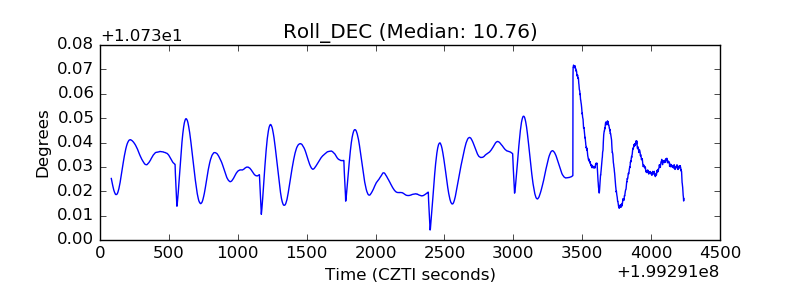 |
| _Roll_RA | 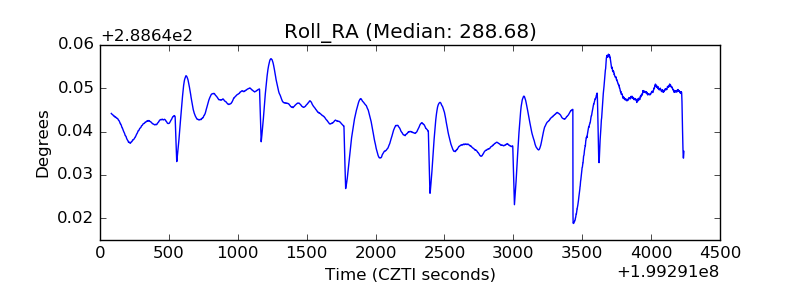 |
| Veto Counter |  |