| Param | Original file | Final file |
|---|---|---|
| Filename | modeM0/AS1G05_214T01_9000000428_03117cztM0_level2.evt | modeM0/AS1G05_214T01_9000000428_03117cztM0_level2_quad_clean.evt |
| Size (bytes) | 607,285,440 | 73,503,360 |
| Size | 579.2 MB | 70.1 MB |
| Events in quadrant A | 4,276,850 | 427,708 |
| Events in quadrant B | 3,988,732 | 426,466 |
| Events in quadrant C | 4,999,350 | 418,154 |
| Events in quadrant D | 4,585,860 | 399,080 |
| Mode M0 | |||
|---|---|---|---|
| Quadrant | BADHDUFLAG | Total packets | Discarded packets |
| A | 0 | 18062 | 0 |
| B | 0 | 17161 | 0 |
| C | 0 | 20484 | 0 |
| D | 0 | 19303 | 0 |
| Mode SS | |||
|---|---|---|---|
| Quadrant | BADHDUFLAG | Total packets | Discarded packets |
| A | 0 | 162 | 0 |
| B | 0 | 162 | 0 |
| C | 0 | 162 | 0 |
| D | 0 | 162 | 0 |
| Mode M9 | |||
|---|---|---|---|
| Quadrant | BADHDUFLAG | Total packets | Discarded packets |
| A | 0 | 1 | 0 |
| B | 0 | 1 | 0 |
| C | 0 | 1 | 0 |
| D | 0 | 1 | 0 |
| Quadrant | Total seconds | Saturated seconds | Saturation percentage |
|---|---|---|---|
| A | 7969 | 364 | 4.567700% |
| B | 7969 | 257 | 3.224997% |
| C | 7969 | 545 | 6.839001% |
| D | 7969 | 410 | 5.144937% |
Noise dominated data is calculated using 1-second bins in cleaned event files. If a bin has >2000 counts, and if more than 50% of those come from <1% of pixels, then it is considered to be noise-dominated and hence unusable.
| Quadrant | # 1 sec bins | Bins with >0 counts | Bins with >2000 counts | High rate bins dominated by noise | Noise dominated (total time) | Noise dominated (detector-on time) | Marked lightcurve |
|---|---|---|---|---|---|---|---|
| A | 8084 | 7972 | 83 | 83 | 1.03% | 1.04% | 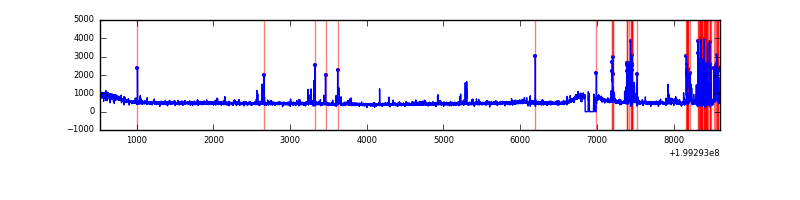 |
| B | 8084 | 7972 | 6 | 6 | 0.07% | 0.08% | 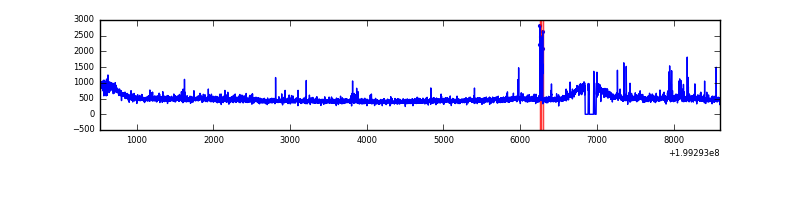 |
| C | 8084 | 7972 | 217 | 217 | 2.68% | 2.72% | 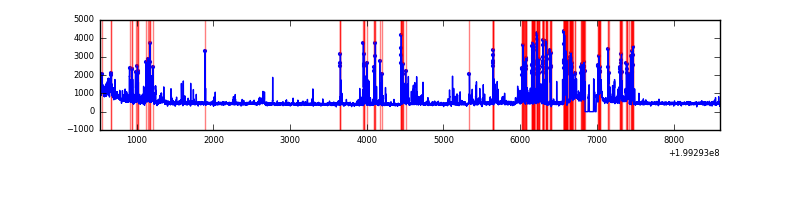 |
| D | 8084 | 7972 | 166 | 166 | 2.05% | 2.08% |  |
Top three noisy pixels from each quadrant. If the there are fewer than three noisy pixels in the level2.evt file, extra rows are filled as -1
| Pixel properties | Quadrant properties | ||||||
|---|---|---|---|---|---|---|---|
| Quadrant | DetID | PixID | Counts | Sigma | Mean | Median | Sigma |
| A | 0 | 13 | 412642 | 2076.81 | 956 | 933 | 198.2 |
| A | 0 | 31 | 41213 | 203.19 | 956 | 933 | 198.2 |
| A | 12 | 189 | 39300 | 193.54 | 956 | 933 | 198.2 |
| B | 15 | 85 | 63034 | 322.8 | 973 | 950 | 192.3 |
| B | 15 | 204 | 51761 | 264.19 | 973 | 950 | 192.3 |
| B | 2 | 249 | 33121 | 167.27 | 973 | 950 | 192.3 |
| C | 14 | 223 | 1343463 | 6235.25 | 908 | 910 | 215.3 |
| C | 6 | 80 | 72581 | 332.86 | 908 | 910 | 215.3 |
| C | 1 | 192 | 12652 | 54.53 | 908 | 910 | 215.3 |
| D | 12 | 217 | 446894 | 1977.09 | 924 | 892 | 225.6 |
| D | 13 | 114 | 218505 | 964.66 | 924 | 892 | 225.6 |
| D | 13 | 120 | 185788 | 819.63 | 924 | 892 | 225.6 |
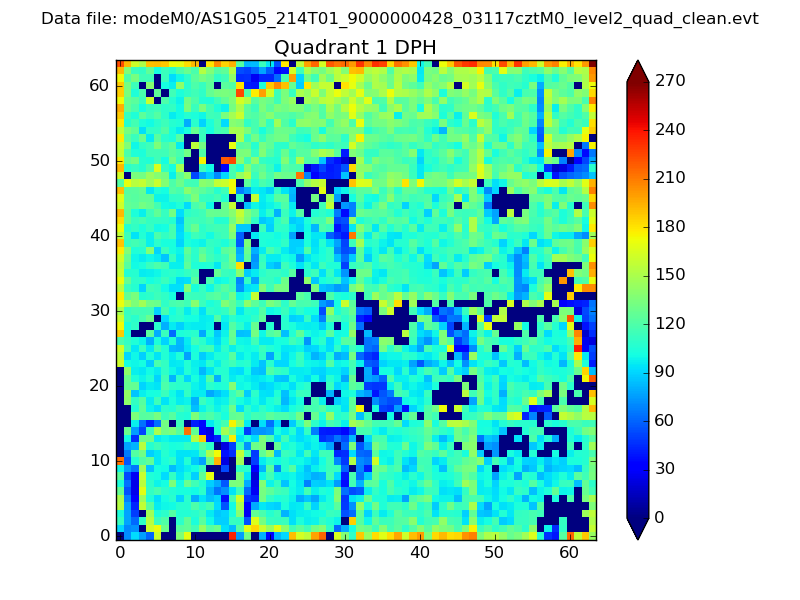
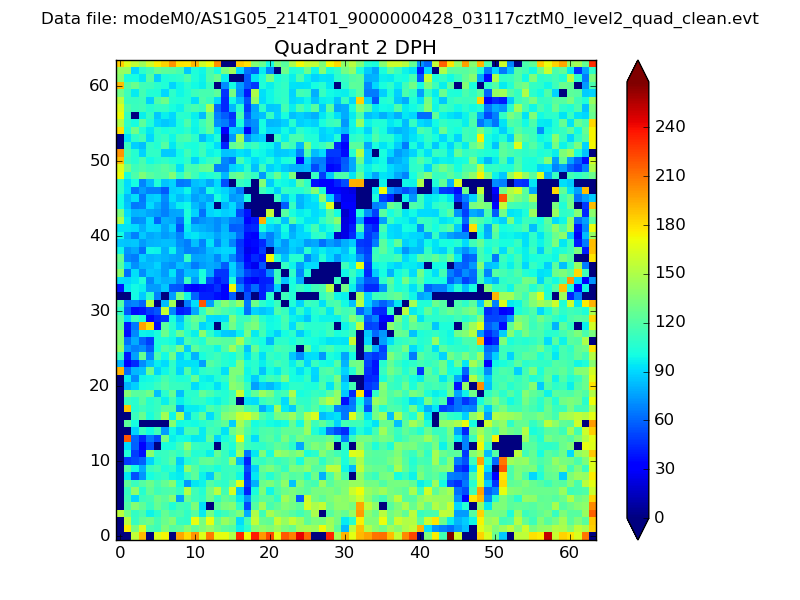
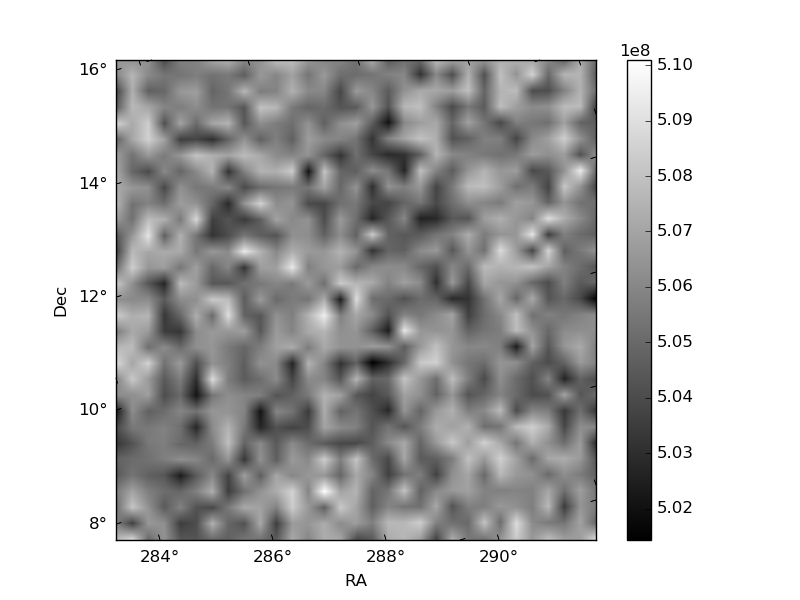
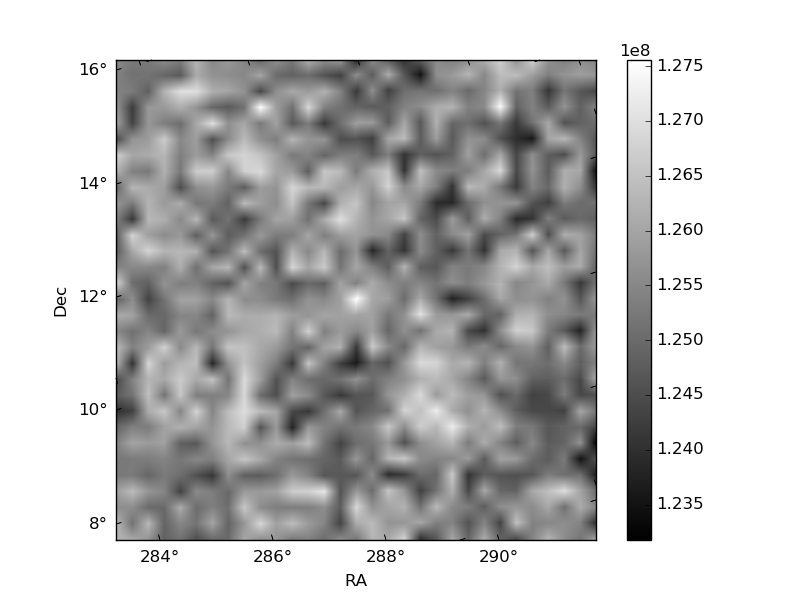
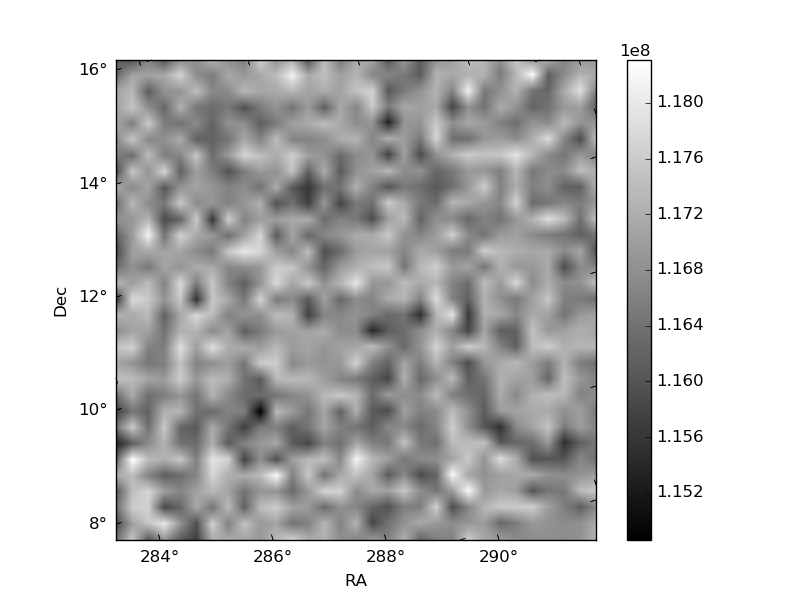
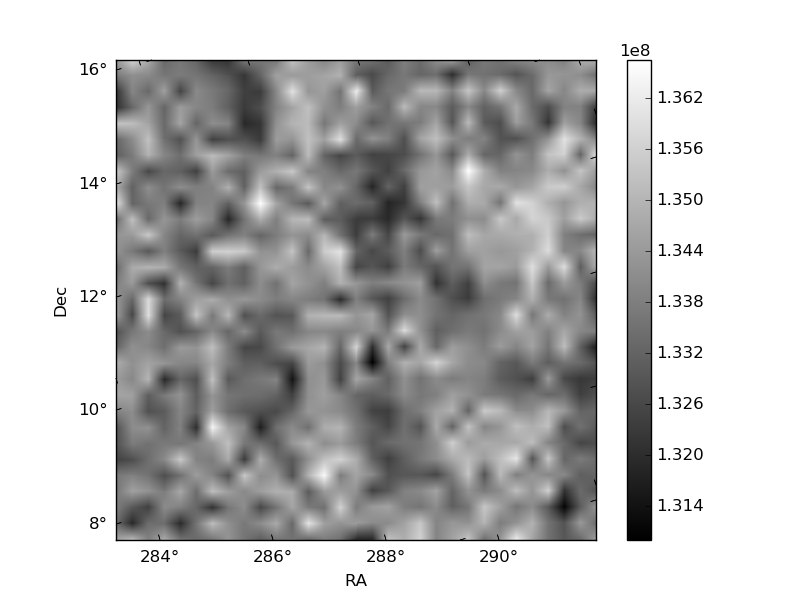
Histogram calculated using DETX and DETY for each event in the final _common_clean file
| Quadrant A | 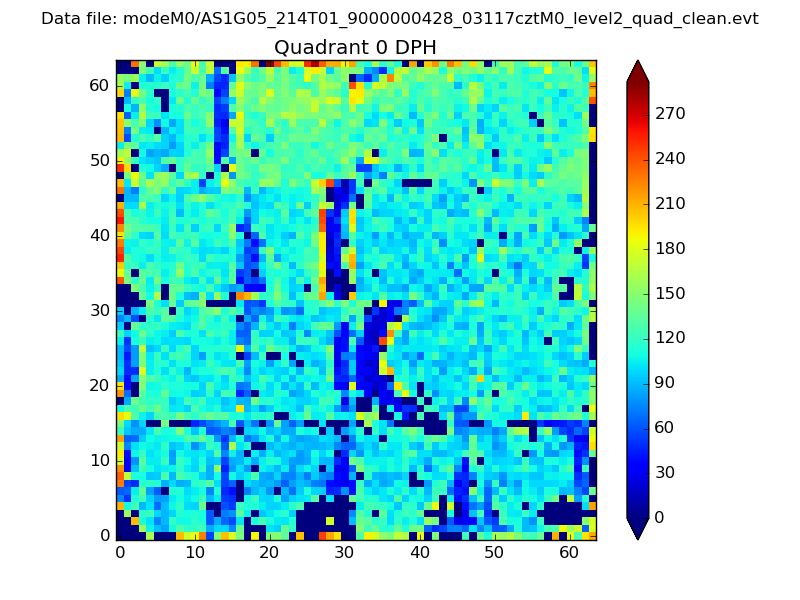 |
 |
Quadrant B |
|---|---|---|---|
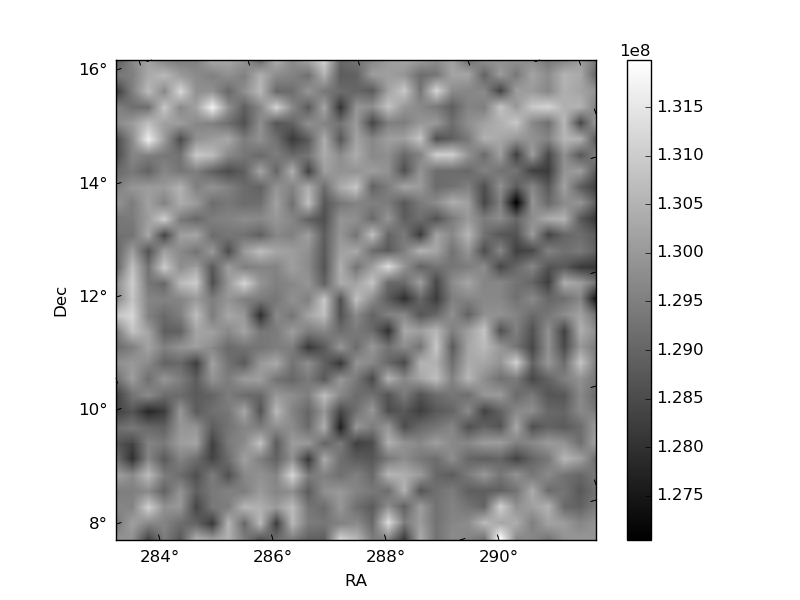
| Quadrant D | 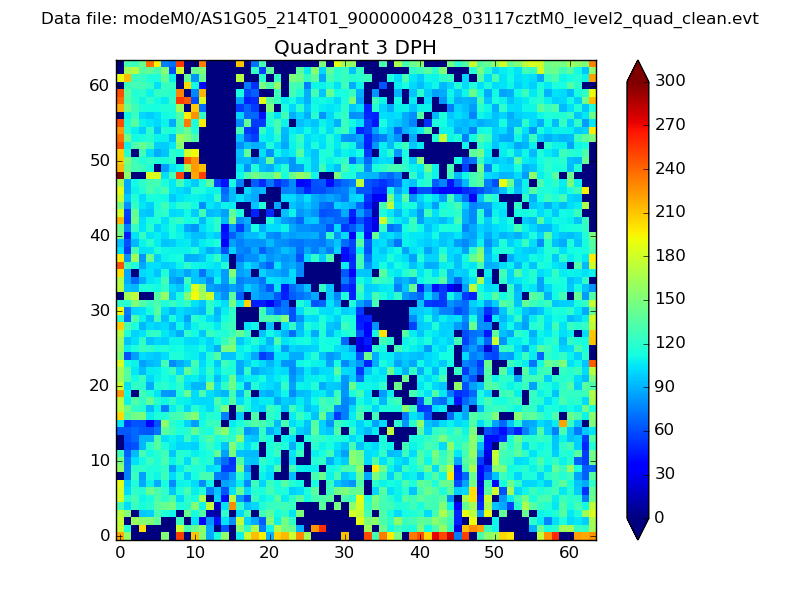 |
 |
Quadrant C |
| Plot type | Count rate plots | Images |
|---|---|---|
| Comparison with Poisson distribution Blue bars denote a histogram of data divided into 1 sec bins. Red curve is a Poisson curve with rate = median count rate of data. |
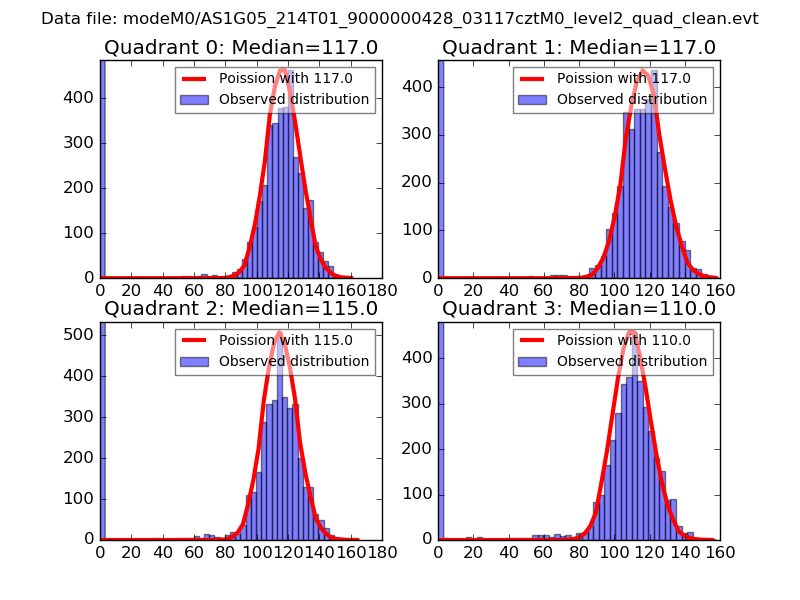 |
 |
| Quadrant-wise count rates Data is divided into 100 sec bins |
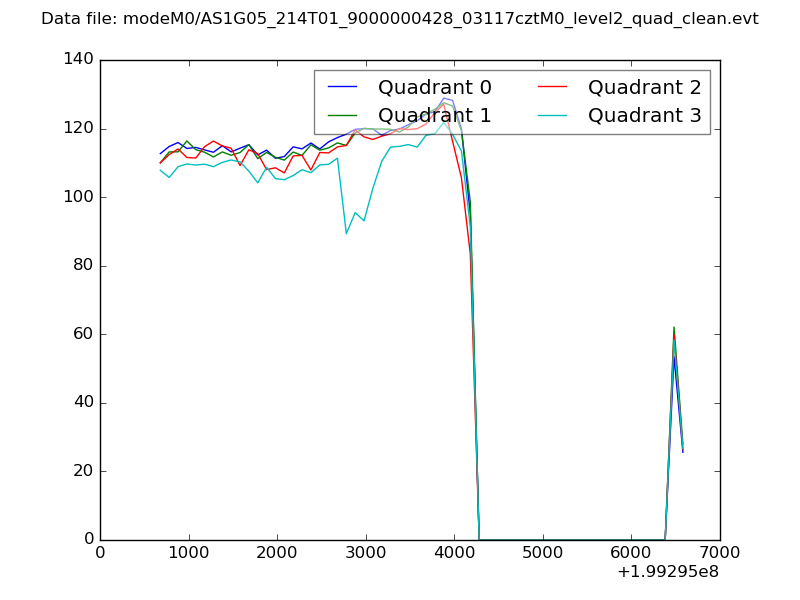 |
|
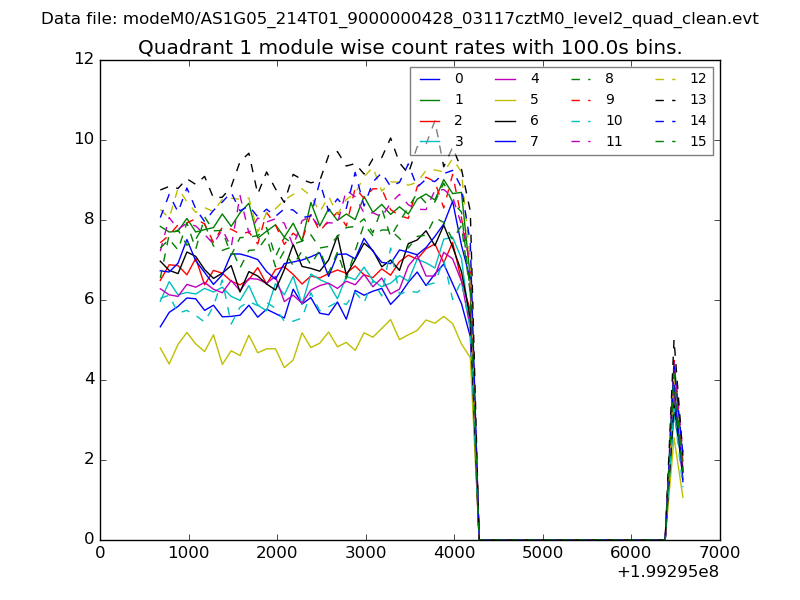
| Module-wise count rates for Quadrant A Data is divided into 100 sec bins |
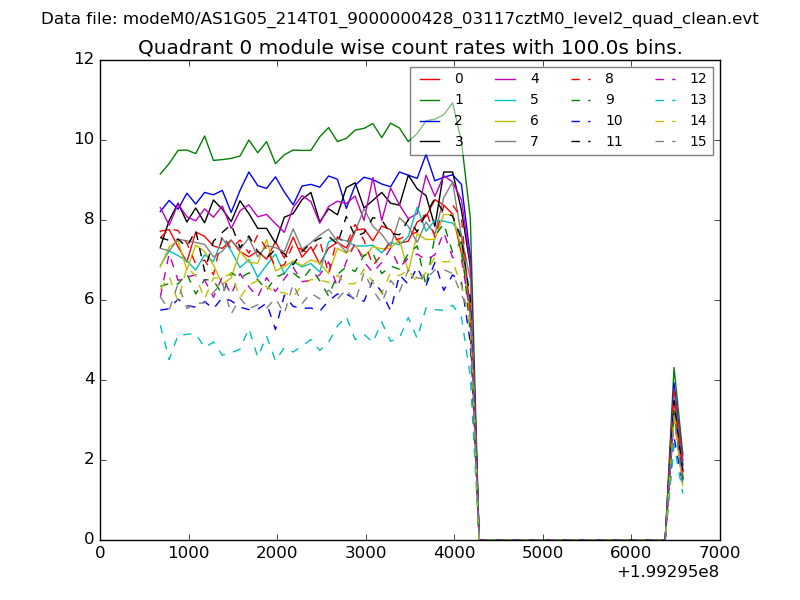 |
 |
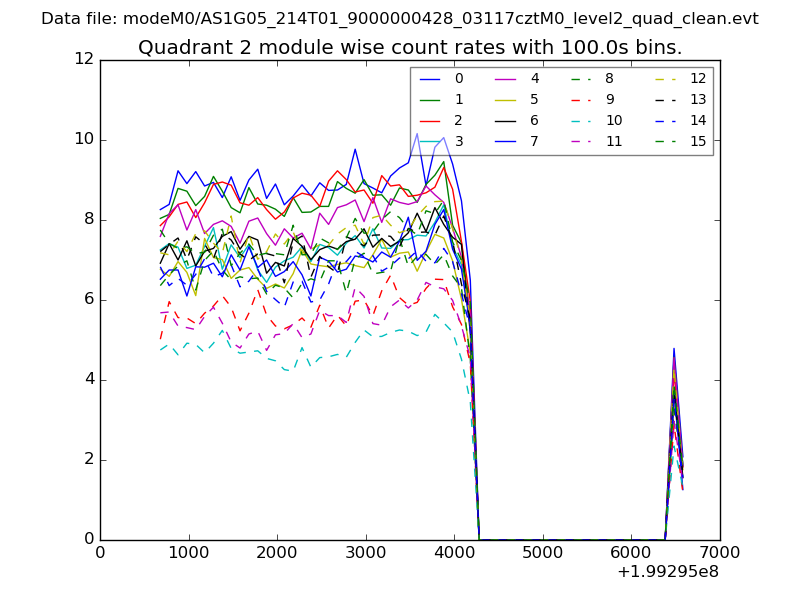
| Module-wise count rates for Quadrant B Data is divided into 100 sec bins |
 |
 |
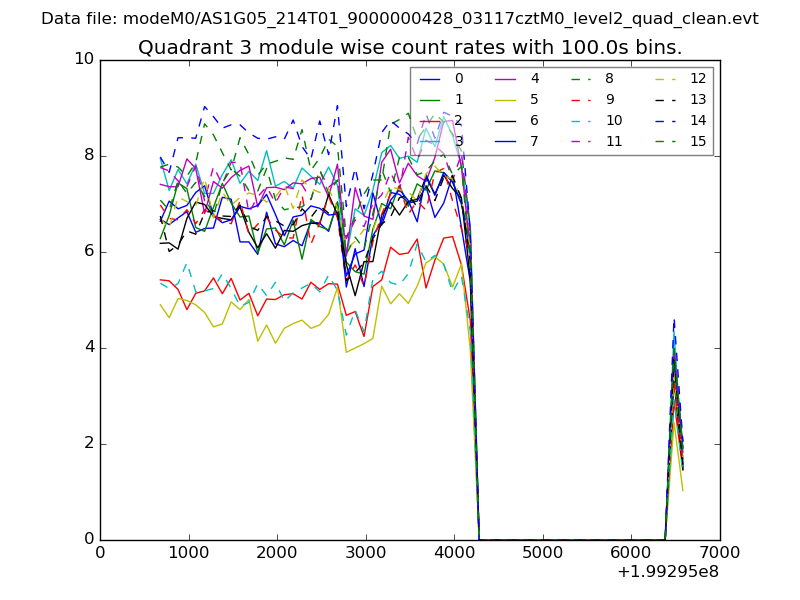
| Module-wise count rates for Quadrant C Data is divided into 100 sec bins |
 |
 |
| Module-wise count rates for Quadrant D Data is divided into 100 sec bins |
 |
 |
| Parameter | Plot |
|---|---|
| CZT HV Monitor | 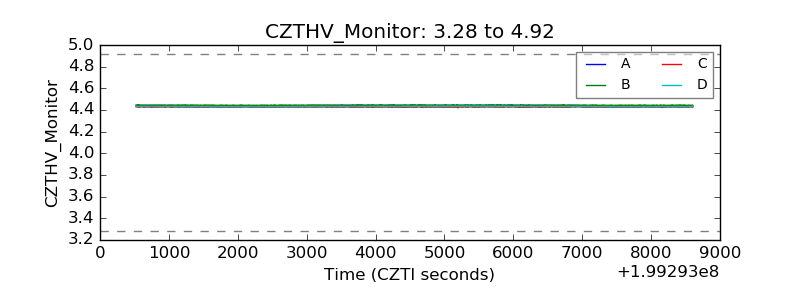 |
| D_VDD | 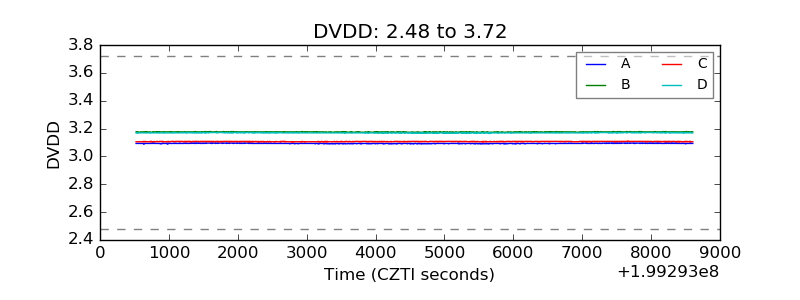 |
| Temperature 1 | 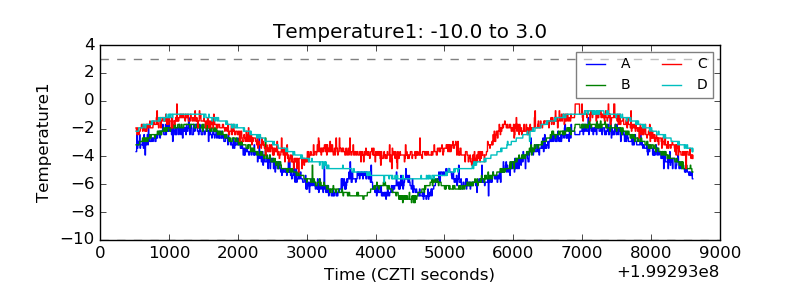 |
| Veto HV Monitor | 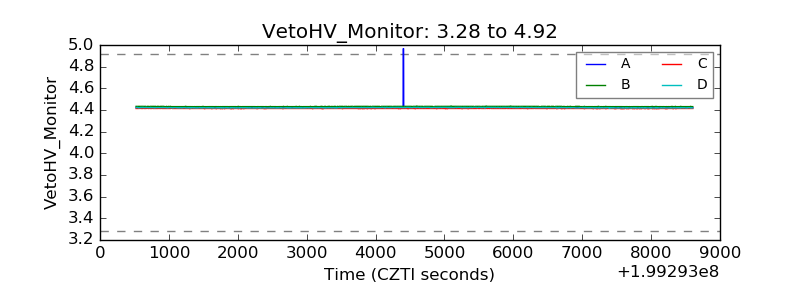 |
| Veto LLD | 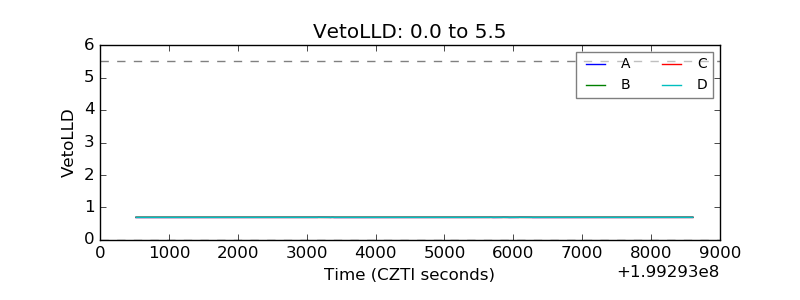 |
| Alpha Counter | 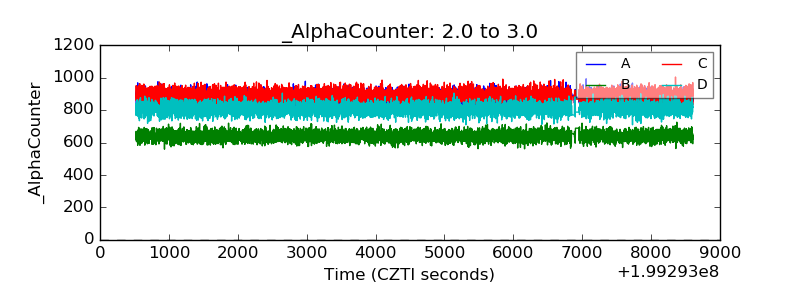 |
| _CPM_Rate | 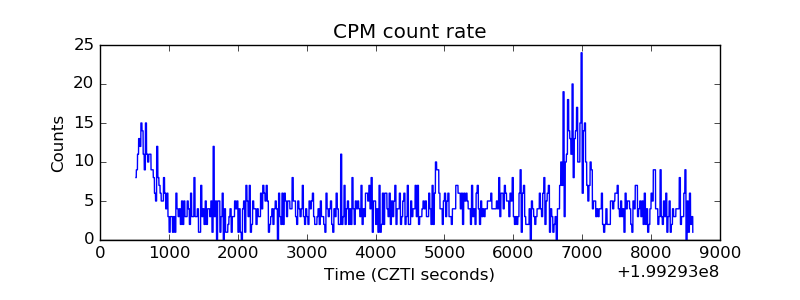 |
| CZT Counter | 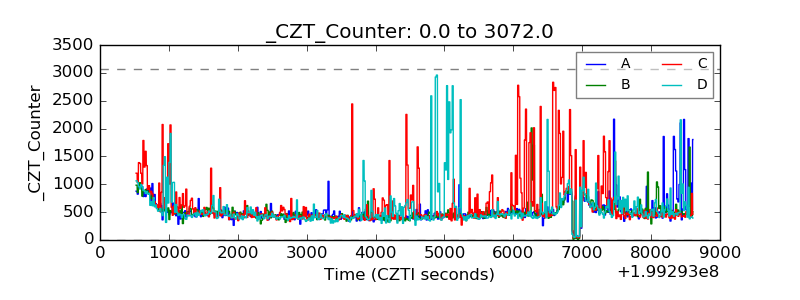 |
| +2.5 Volts monitor |  |
| +5 Volts monitor |  |
| _ROLL_ROT | 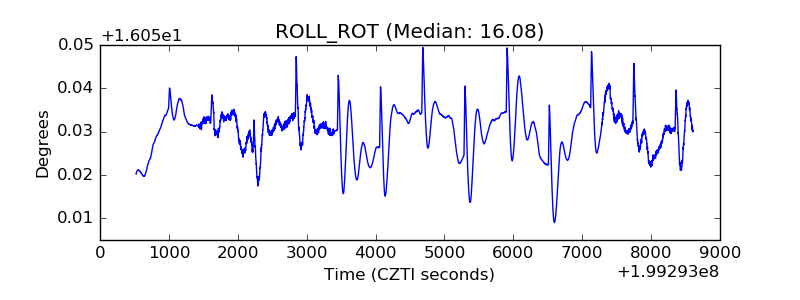 |
| _Roll_DEC | 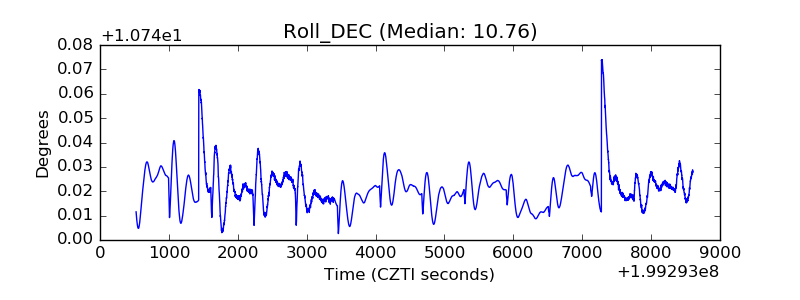 |
| _Roll_RA | 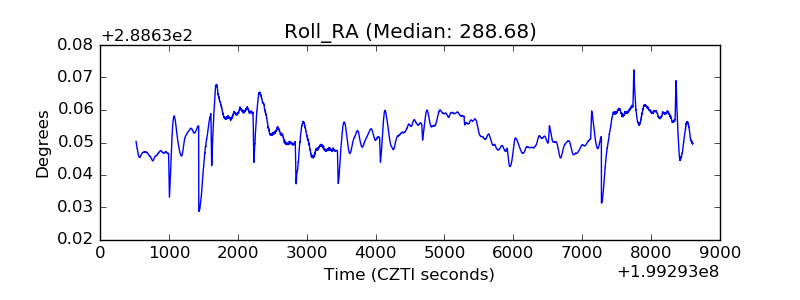 |
| Veto Counter | 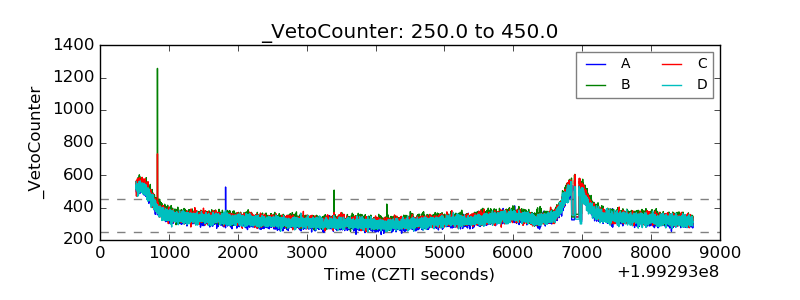 |