| Param | Original file | Final file |
|---|---|---|
| Filename | modeM0/AS1G05_214T01_9000000428_03121cztM0_level2.evt | modeM0/AS1G05_214T01_9000000428_03121cztM0_level2_quad_clean.evt |
| Size (bytes) | 489,041,280 | 87,166,080 |
| Size | 466.4 MB | 83.1 MB |
| Events in quadrant A | 5,265,993 | 501,047 |
| Events in quadrant B | 3,012,190 | 571,794 |
| Events in quadrant C | 3,072,369 | 568,246 |
| Events in quadrant D | 3,013,241 | 539,713 |
| Mode M0 | |||
|---|---|---|---|
| Quadrant | BADHDUFLAG | Total packets | Discarded packets |
| A | 0 | 20112 | 0 |
| B | 0 | 13556 | 0 |
| C | 0 | 13790 | 0 |
| D | 0 | 14045 | 0 |
| Mode SS | |||
|---|---|---|---|
| Quadrant | BADHDUFLAG | Total packets | Discarded packets |
| A | 0 | 134 | 0 |
| B | 0 | 134 | 0 |
| C | 0 | 134 | 0 |
| D | 0 | 134 | 0 |
| Mode M9 | |||
|---|---|---|---|
| Quadrant | BADHDUFLAG | Total packets | Discarded packets |
| A | 0 | 9 | 0 |
| B | 0 | 9 | 0 |
| C | 0 | 9 | 0 |
| D | 0 | 9 | 0 |
| Quadrant | Total seconds | Saturated seconds | Saturation percentage |
|---|---|---|---|
| A | 6570 | 967 | 14.718417% |
| B | 6570 | 28 | 0.426180% |
| C | 6570 | 82 | 1.248097% |
| D | 6570 | 64 | 0.974125% |
Noise dominated data is calculated using 1-second bins in cleaned event files. If a bin has >2000 counts, and if more than 50% of those come from <1% of pixels, then it is considered to be noise-dominated and hence unusable.
| Quadrant | # 1 sec bins | Bins with >0 counts | Bins with >2000 counts | High rate bins dominated by noise | Noise dominated (total time) | Noise dominated (detector-on time) | Marked lightcurve |
|---|---|---|---|---|---|---|---|
| A | 7500 | 6571 | 726 | 726 | 9.68% | 11.05% | 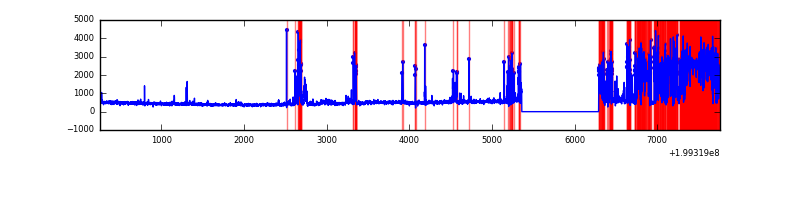 |
| B | 7500 | 6571 | 0 | 0 | 0.00% | 0.00% | 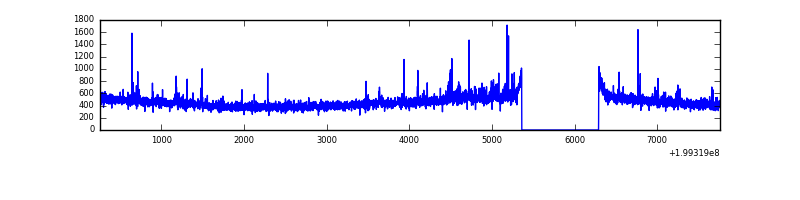 |
| C | 7500 | 6571 | 18 | 18 | 0.24% | 0.27% | 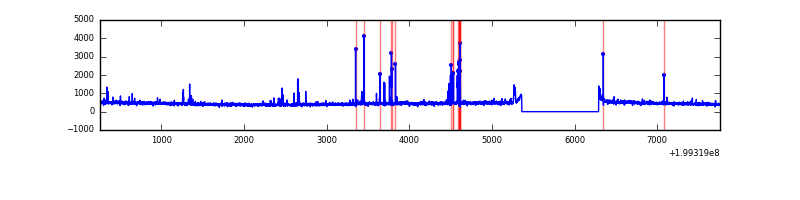 |
| D | 7500 | 6571 | 39 | 39 | 0.52% | 0.59% | 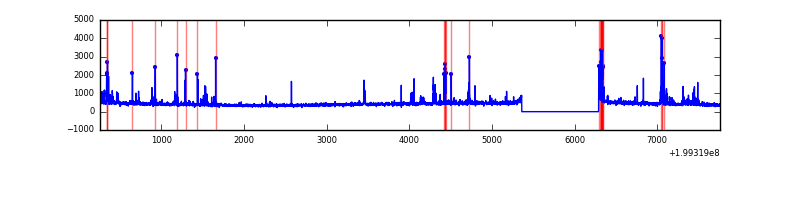 |
Top three noisy pixels from each quadrant. If the there are fewer than three noisy pixels in the level2.evt file, extra rows are filled as -1
| Pixel properties | Quadrant properties | ||||||
|---|---|---|---|---|---|---|---|
| Quadrant | DetID | PixID | Counts | Sigma | Mean | Median | Sigma |
| A | 0 | 13 | 2458021 | 17211.56 | 683 | 667 | 142.8 |
| A | 8 | 15 | 128770 | 897.25 | 683 | 667 | 142.8 |
| A | 12 | 189 | 22553 | 153.29 | 683 | 667 | 142.8 |
| B | 2 | 249 | 33217 | 223.83 | 754 | 737 | 145.1 |
| B | 15 | 204 | 11013 | 70.81 | 754 | 737 | 145.1 |
| B | 4 | 81 | 10916 | 70.15 | 754 | 737 | 145.1 |
| C | 14 | 223 | 164988 | 966.72 | 720 | 725 | 169.9 |
| C | 6 | 80 | 34200 | 197.01 | 720 | 725 | 169.9 |
| C | 0 | 219 | 25643 | 146.65 | 720 | 725 | 169.9 |
| D | 13 | 223 | 187130 | 1075.0 | 710 | 689 | 173.4 |
| D | 13 | 239 | 53734 | 305.85 | 710 | 689 | 173.4 |
| D | 10 | 85 | 21308 | 118.89 | 710 | 689 | 173.4 |
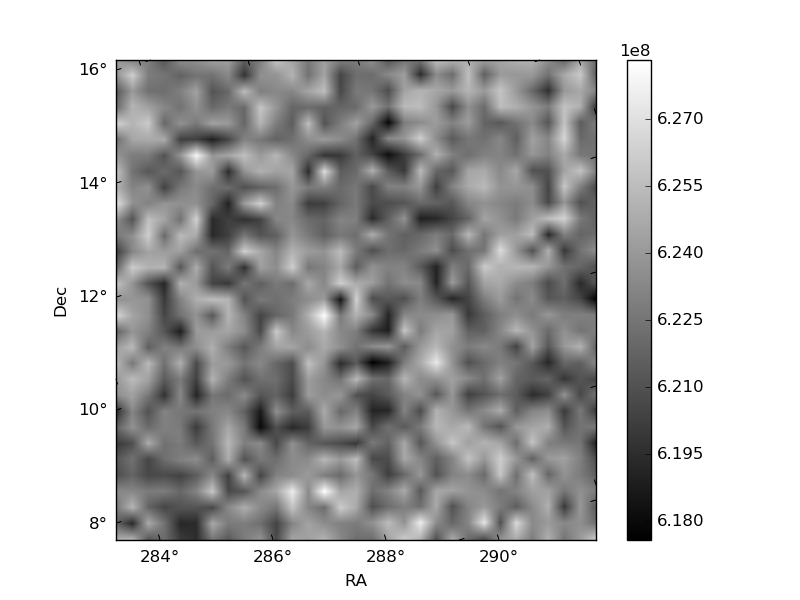
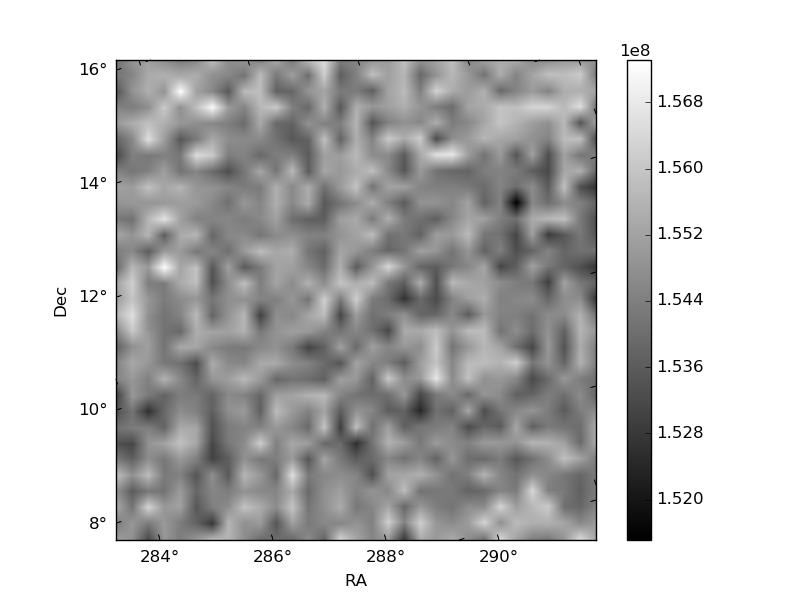
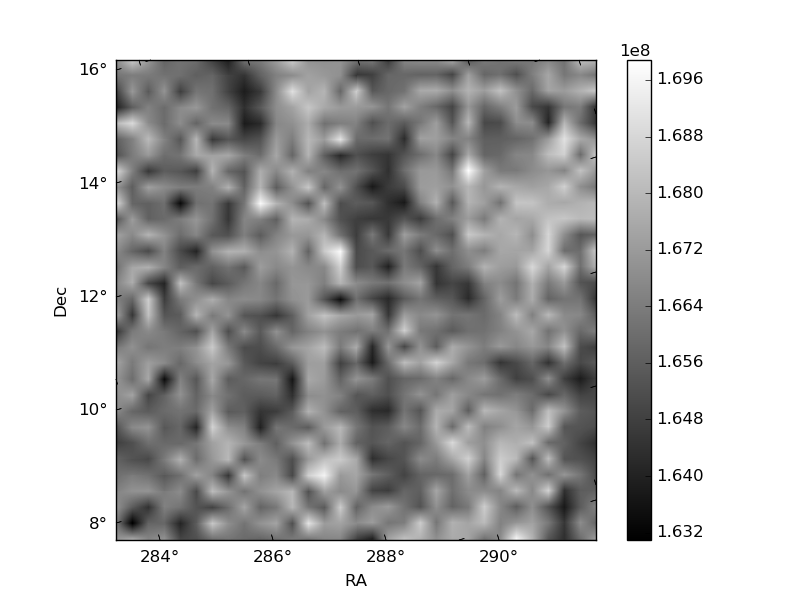
Histogram calculated using DETX and DETY for each event in the final _common_clean file
| Quadrant A | 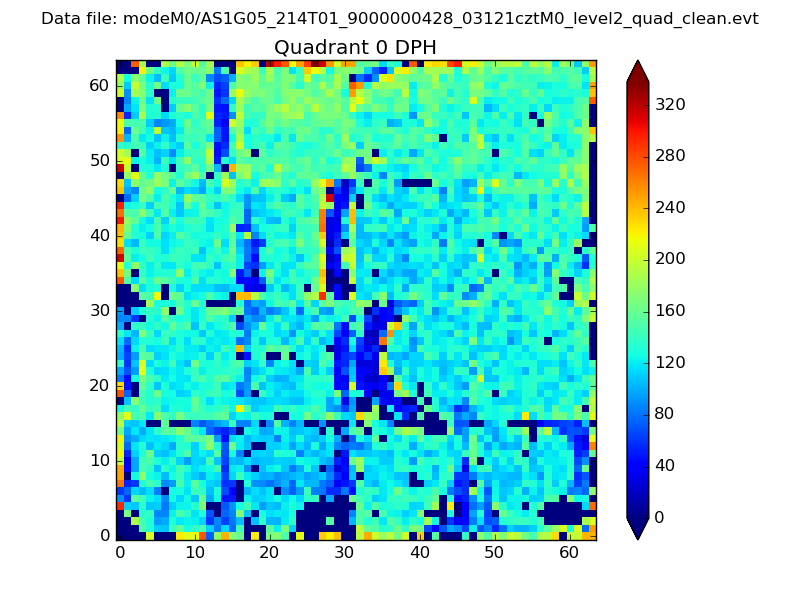 |
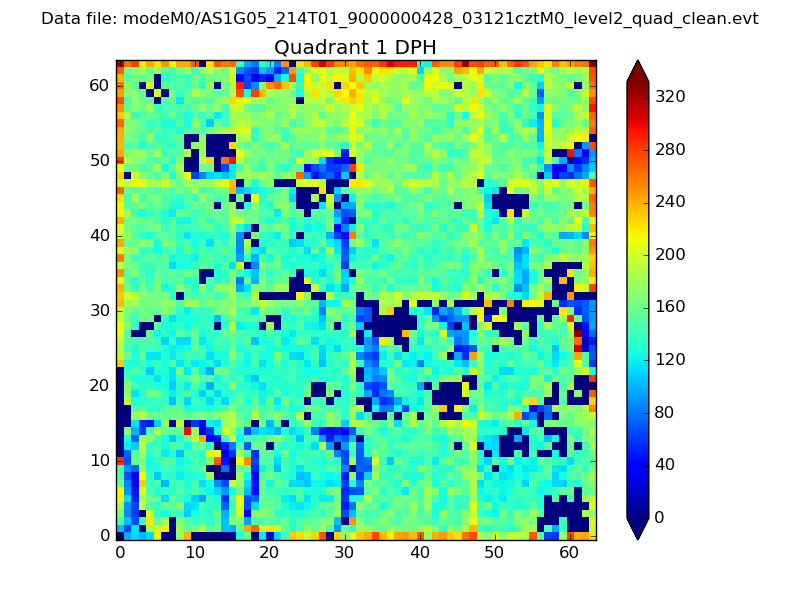 |
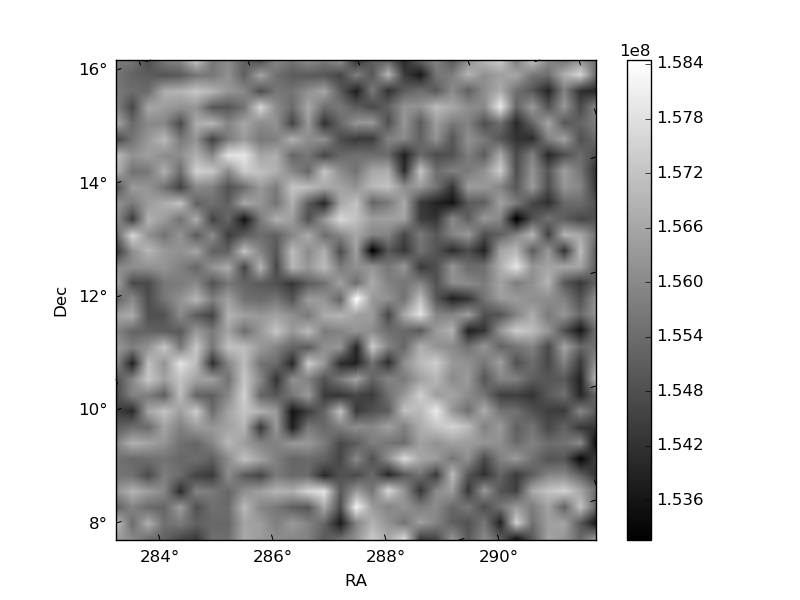
Quadrant B |
|---|---|---|---|
| Quadrant D | 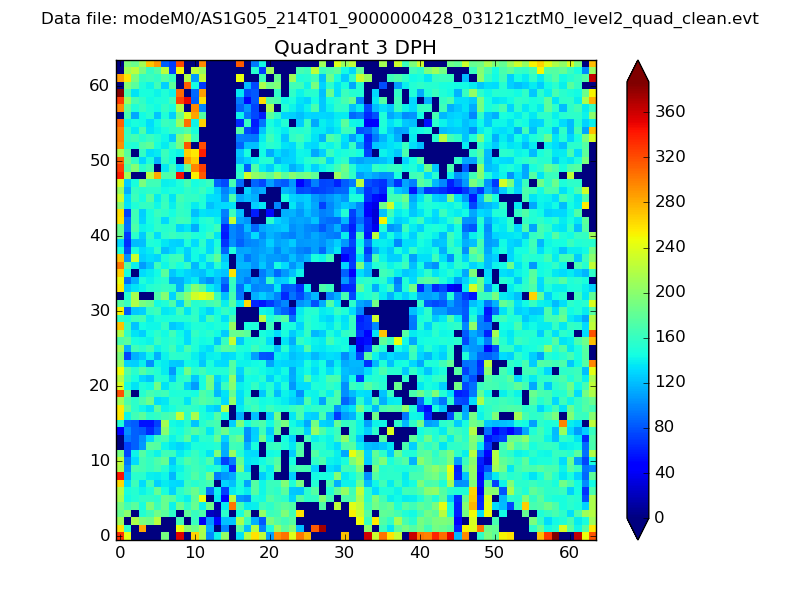 |
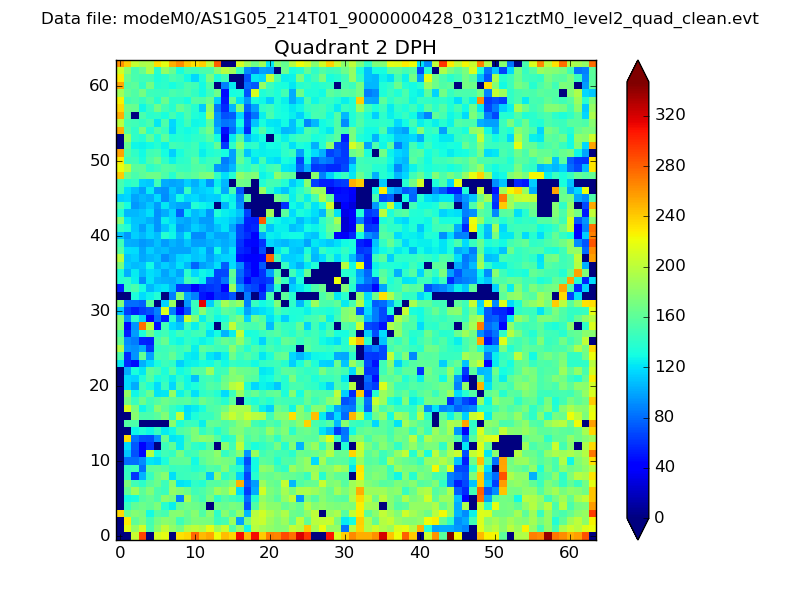 |
Quadrant C |
| Plot type | Count rate plots | Images |
|---|---|---|
| Comparison with Poisson distribution Blue bars denote a histogram of data divided into 1 sec bins. Red curve is a Poisson curve with rate = median count rate of data. |
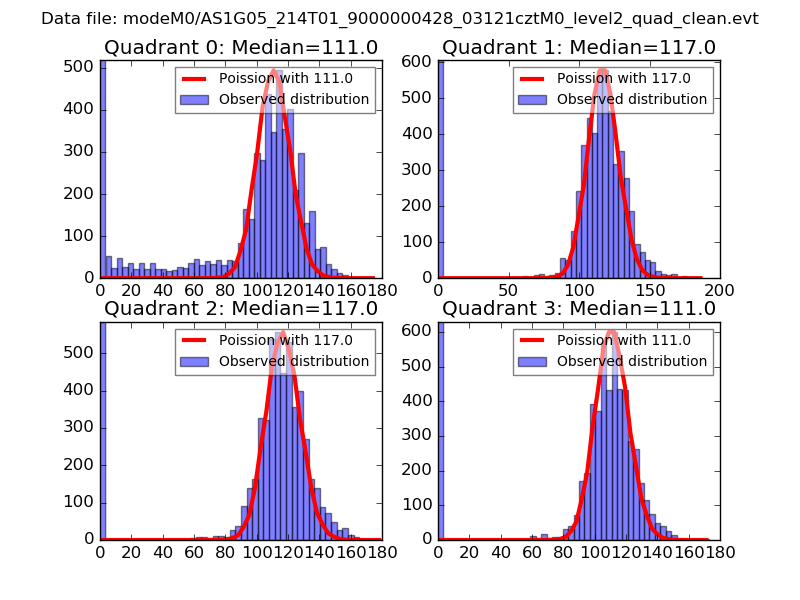 |
 |
| Quadrant-wise count rates Data is divided into 100 sec bins |
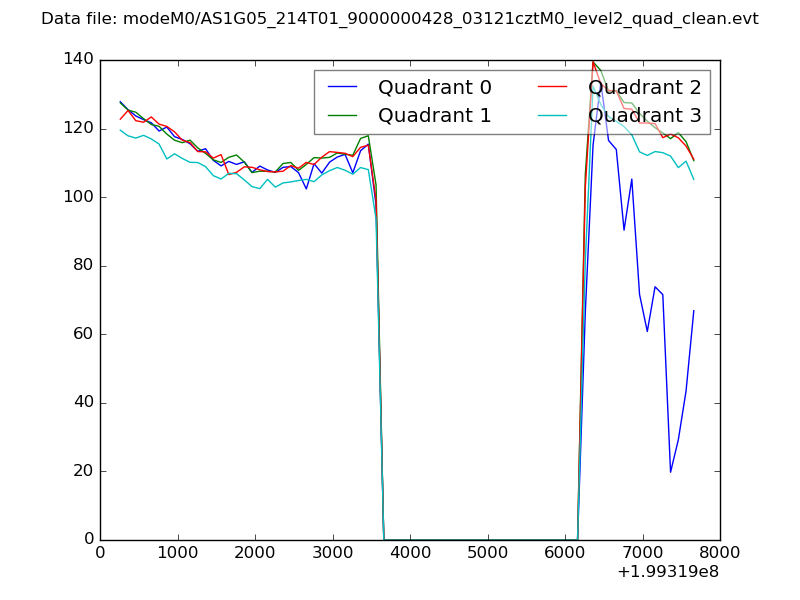 |
|
| Module-wise count rates for Quadrant A Data is divided into 100 sec bins |
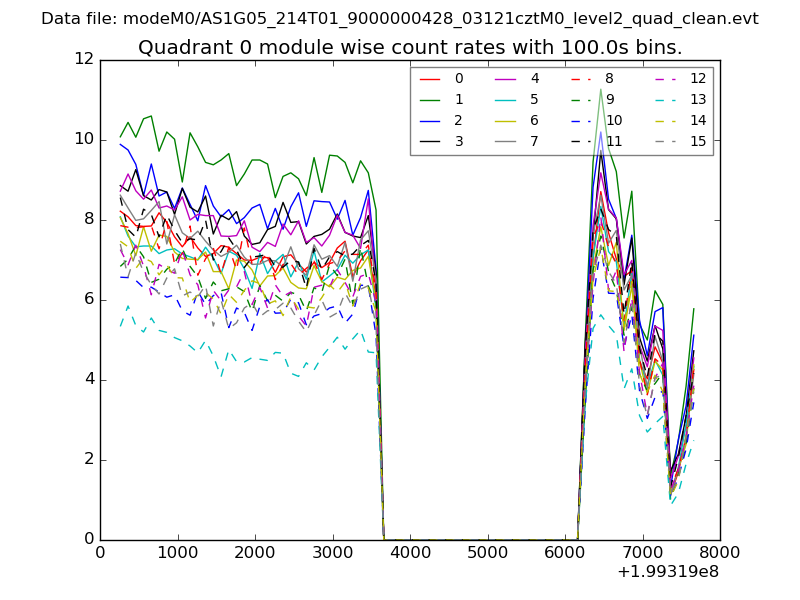 |
 |
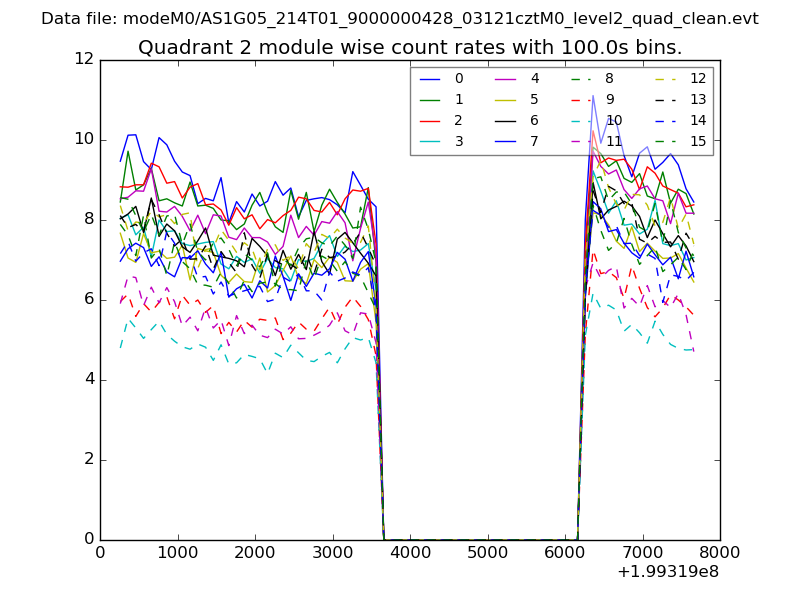
| Module-wise count rates for Quadrant B Data is divided into 100 sec bins |
 |
 |
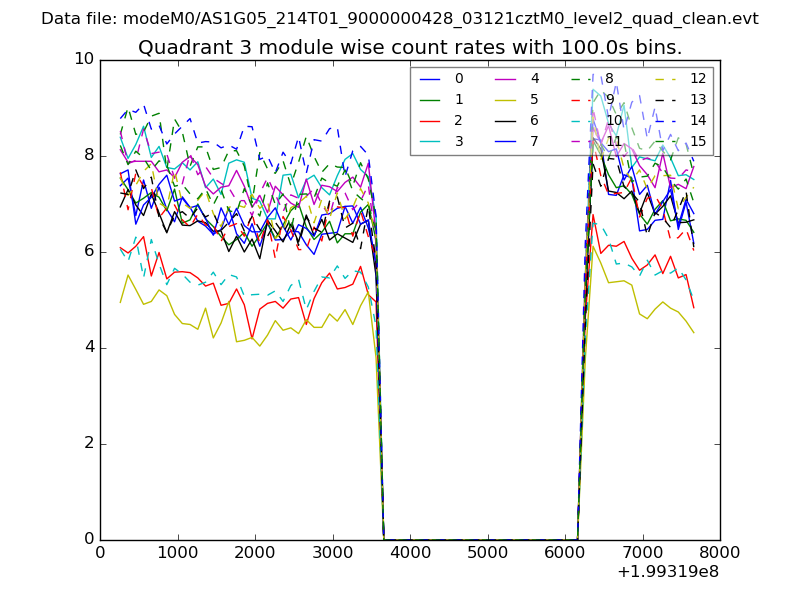
| Module-wise count rates for Quadrant C Data is divided into 100 sec bins |
 |
 |
| Module-wise count rates for Quadrant D Data is divided into 100 sec bins |
 |
 |
| Parameter | Plot |
|---|---|
| CZT HV Monitor | 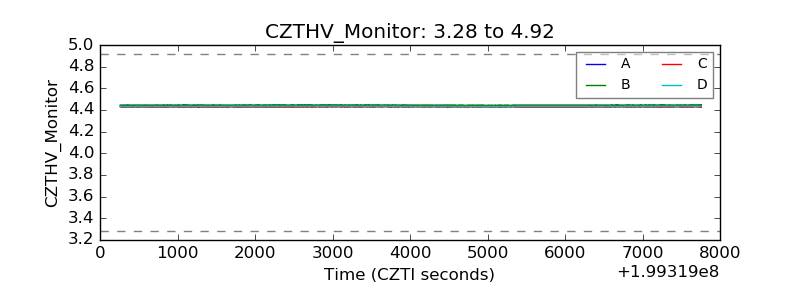 |
| D_VDD | 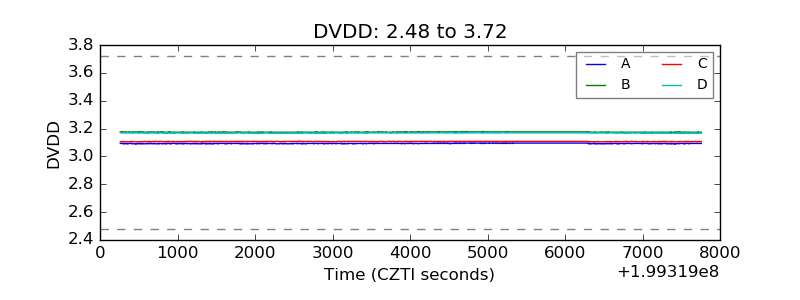 |
| Temperature 1 | 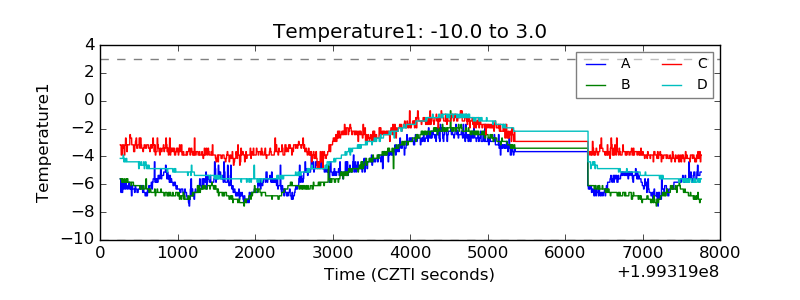 |
| Veto HV Monitor |  |
| Veto LLD | 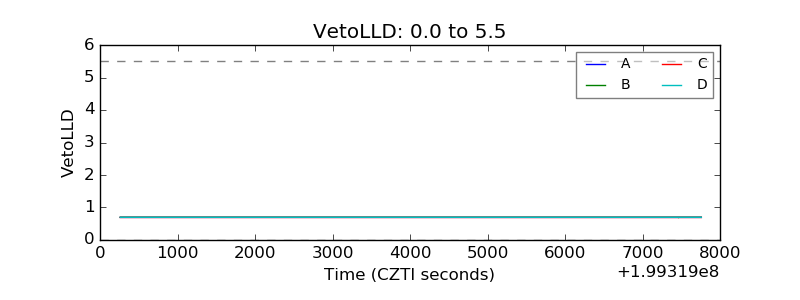 |
| Alpha Counter | 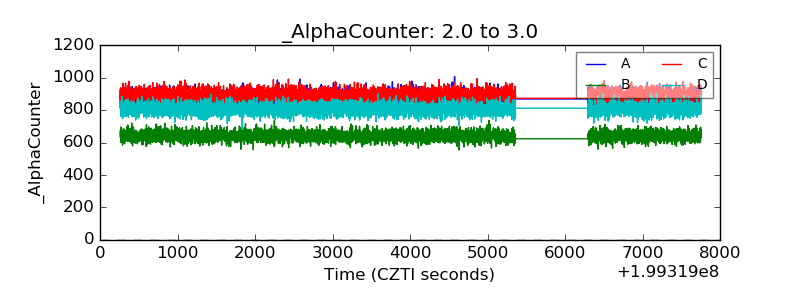 |
| _CPM_Rate | 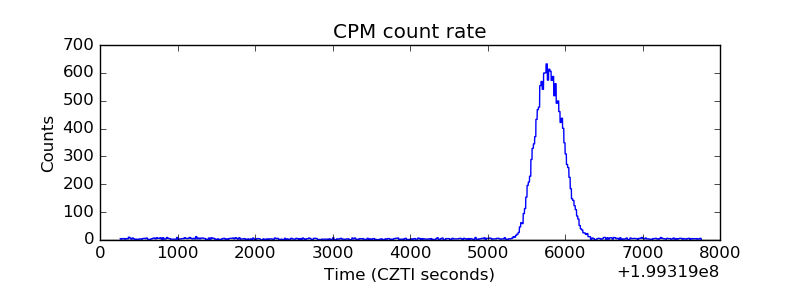 |
| CZT Counter | 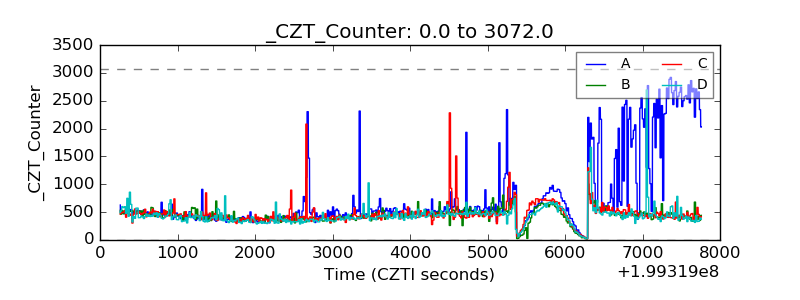 |
| +2.5 Volts monitor |  |
| +5 Volts monitor |  |
| _ROLL_ROT | 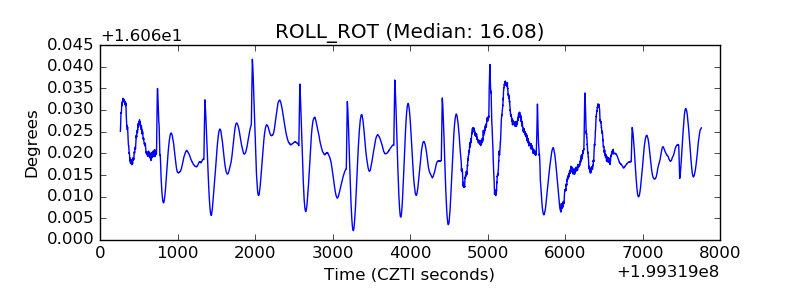 |
| _Roll_DEC | 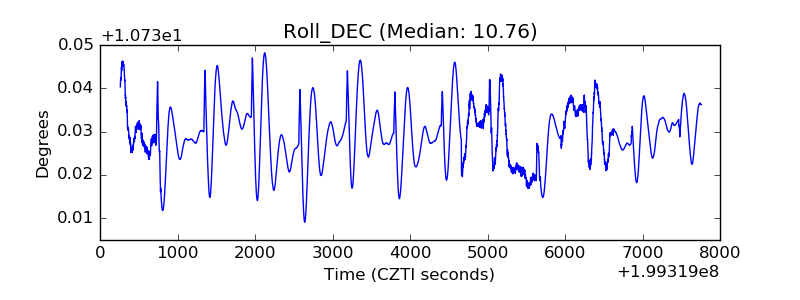 |
| _Roll_RA | 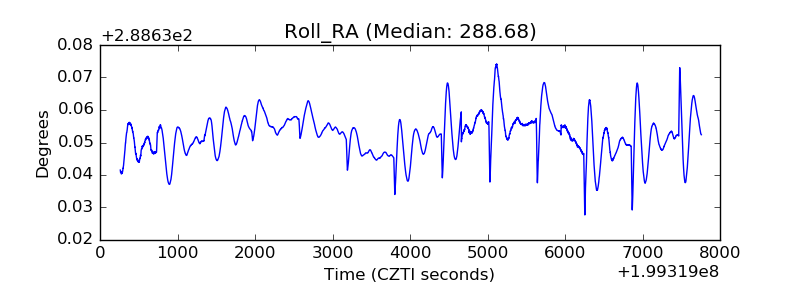 |
| Veto Counter |  |