| Param | Original file | Final file |
|---|---|---|
| Filename | modeM0/AS1G05_214T01_9000000428_03125cztM0_level2.evt | modeM0/AS1G05_214T01_9000000428_03125cztM0_level2_quad_clean.evt |
| Size (bytes) | 387,244,800 | 67,832,640 |
| Size | 369.3 MB | 64.7 MB |
| Events in quadrant A | 2,742,585 | 424,232 |
| Events in quadrant B | 2,754,423 | 431,202 |
| Events in quadrant C | 2,975,505 | 418,054 |
| Events in quadrant D | 2,884,785 | 399,401 |
| Mode M0 | |||
|---|---|---|---|
| Quadrant | BADHDUFLAG | Total packets | Discarded packets |
| A | 0 | 11674 | 0 |
| B | 0 | 11677 | 0 |
| C | 0 | 12438 | 0 |
| D | 0 | 12422 | 0 |
| Mode SS | |||
|---|---|---|---|
| Quadrant | BADHDUFLAG | Total packets | Discarded packets |
| A | 0 | 112 | 0 |
| B | 0 | 112 | 0 |
| C | 0 | 112 | 0 |
| D | 0 | 112 | 0 |
| Mode M9 | |||
|---|---|---|---|
| Quadrant | BADHDUFLAG | Total packets | Discarded packets |
| A | 0 | 12 | 0 |
| B | 0 | 12 | 0 |
| C | 0 | 12 | 0 |
| D | 0 | 12 | 0 |
| Quadrant | Total seconds | Saturated seconds | Saturation percentage |
|---|---|---|---|
| A | 5440 | 64 | 1.176471% |
| B | 5440 | 65 | 1.194853% |
| C | 5440 | 65 | 1.194853% |
| D | 5440 | 69 | 1.268382% |
Noise dominated data is calculated using 1-second bins in cleaned event files. If a bin has >2000 counts, and if more than 50% of those come from <1% of pixels, then it is considered to be noise-dominated and hence unusable.
| Quadrant | # 1 sec bins | Bins with >0 counts | Bins with >2000 counts | High rate bins dominated by noise | Noise dominated (total time) | Noise dominated (detector-on time) | Marked lightcurve |
|---|---|---|---|---|---|---|---|
| A | 6670 | 5441 | 12 | 12 | 0.18% | 0.22% | 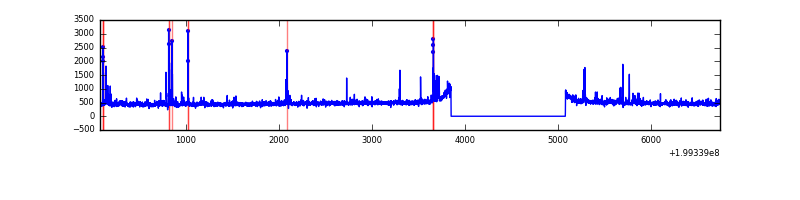 |
| B | 6670 | 5441 | 3 | 3 | 0.04% | 0.06% | 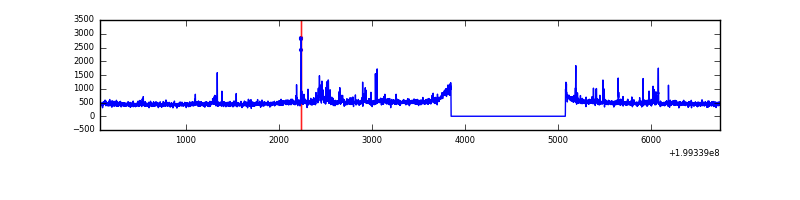 |
| C | 6670 | 5440 | 26 | 26 | 0.39% | 0.48% | 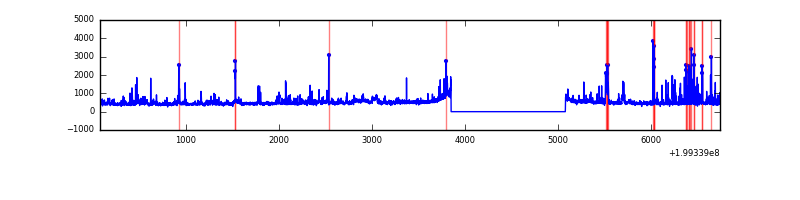 |
| D | 6670 | 5441 | 43 | 43 | 0.64% | 0.79% | 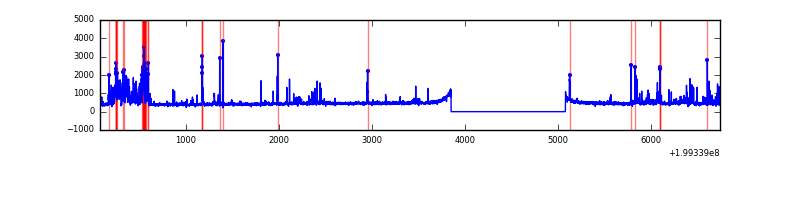 |
Top three noisy pixels from each quadrant. If the there are fewer than three noisy pixels in the level2.evt file, extra rows are filled as -1
| Pixel properties | Quadrant properties | ||||||
|---|---|---|---|---|---|---|---|
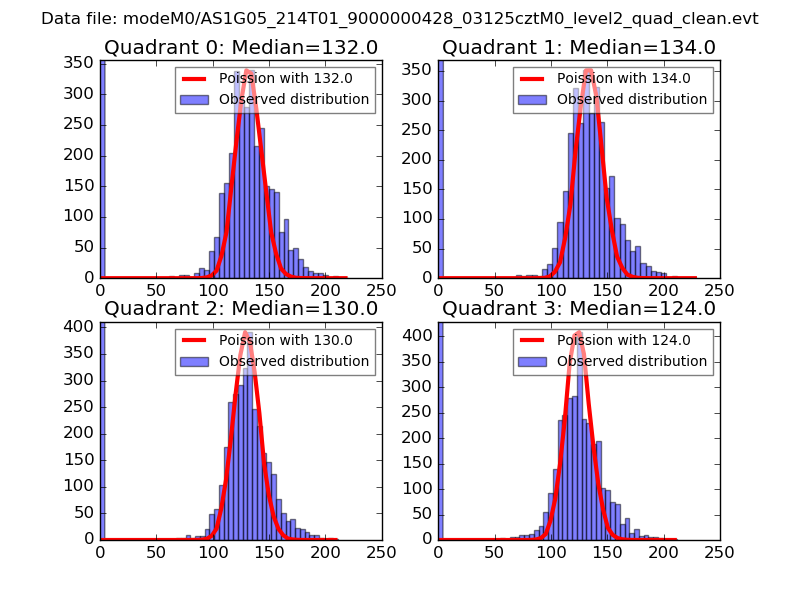
| Quadrant | DetID | PixID | Counts | Sigma | Mean | Median | Sigma |
| A | 0 | 13 | 146458 | 1083.77 | 655 | 642 | 134.5 |
| A | 12 | 247 | 49163 | 360.63 | 655 | 642 | 134.5 |
| A | 3 | 1 | 13049 | 92.21 | 655 | 642 | 134.5 |
| B | 14 | 167 | 54521 | 422.31 | 660 | 646 | 127.6 |
| B | 4 | 81 | 39605 | 305.39 | 660 | 646 | 127.6 |
| B | 2 | 249 | 16235 | 122.2 | 660 | 646 | 127.6 |
| C | 1 | 192 | 159524 | 1093.82 | 624 | 628 | 145.3 |
| C | 0 | 219 | 157924 | 1082.8 | 624 | 628 | 145.3 |
| C | 14 | 223 | 101704 | 695.79 | 624 | 628 | 145.3 |
| D | 13 | 120 | 388935 | 2366.68 | 623 | 610 | 164.1 |
| D | 13 | 223 | 57670 | 347.76 | 623 | 610 | 164.1 |
| D | 2 | 136 | 27183 | 161.95 | 623 | 610 | 164.1 |
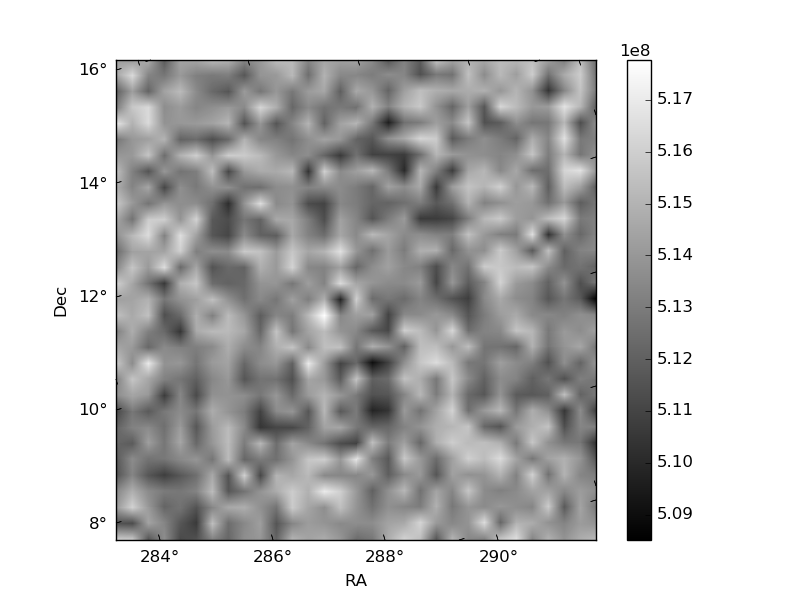
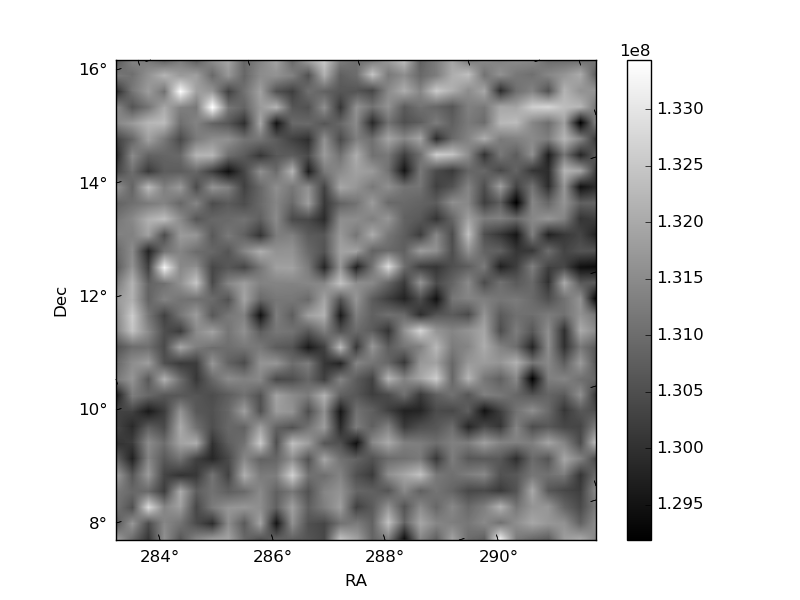
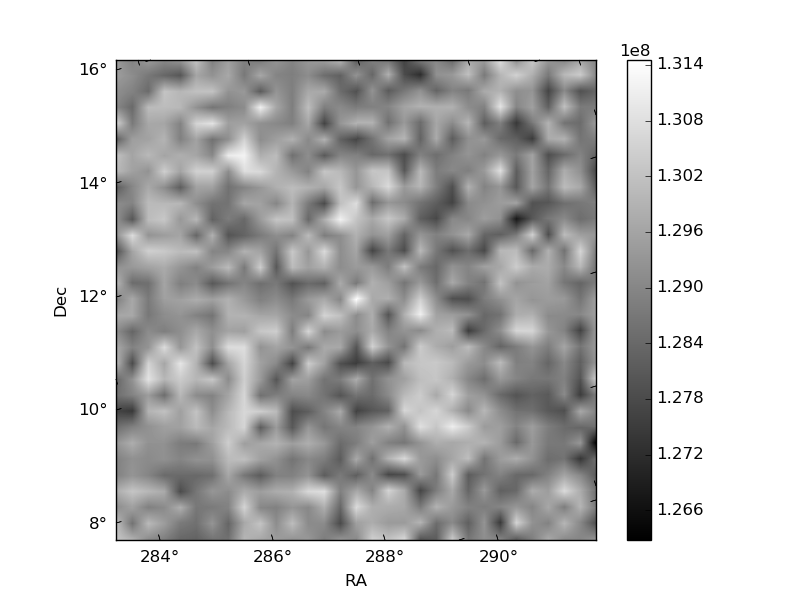
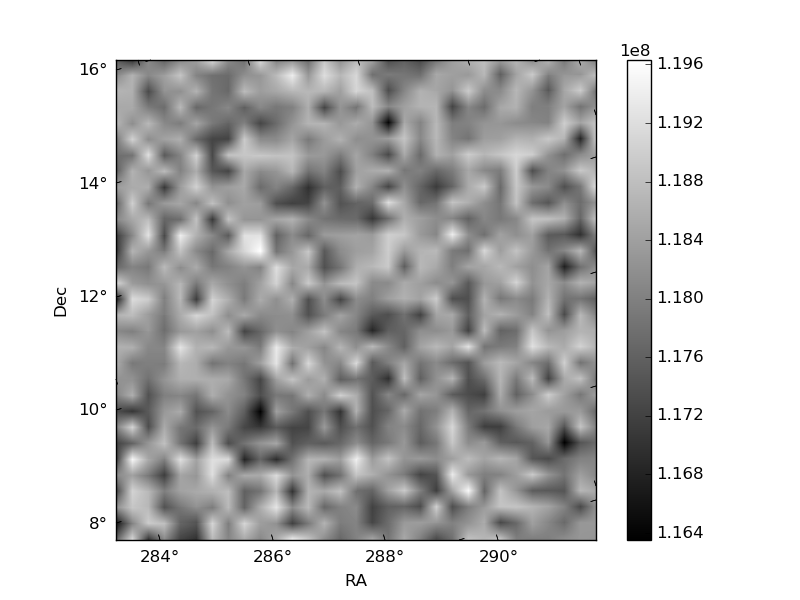
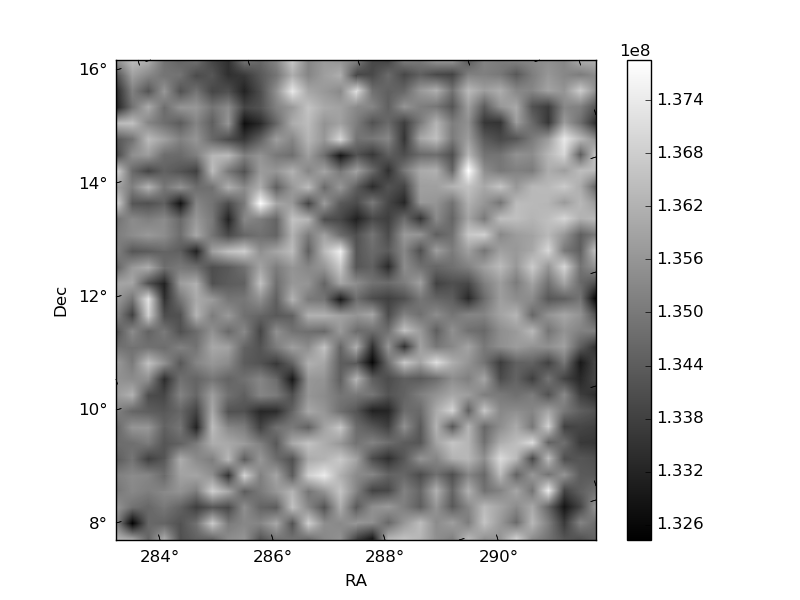
Histogram calculated using DETX and DETY for each event in the final _common_clean file
| Quadrant A | 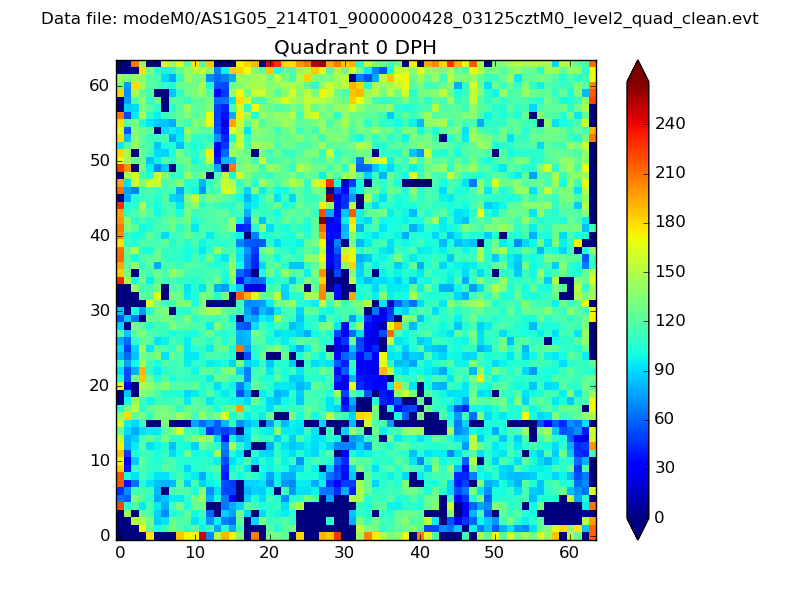 |
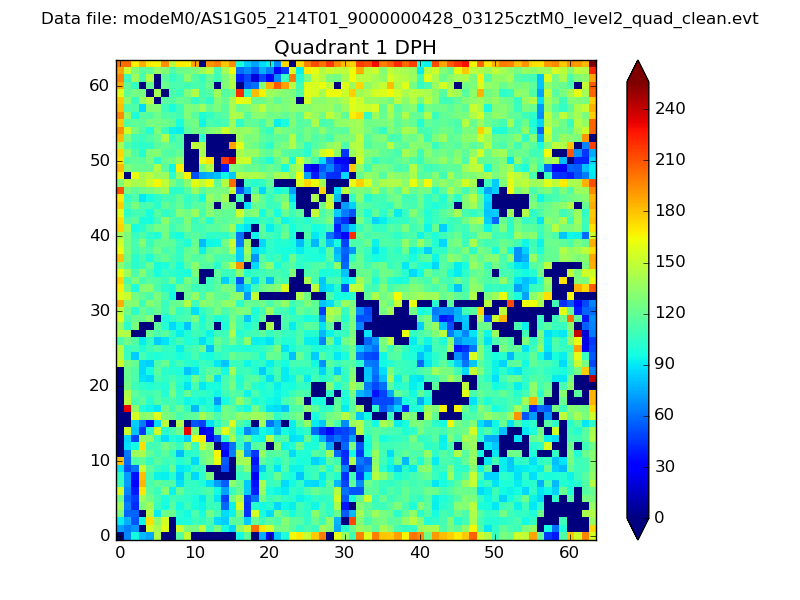 |
Quadrant B |
|---|---|---|---|
| Quadrant D | 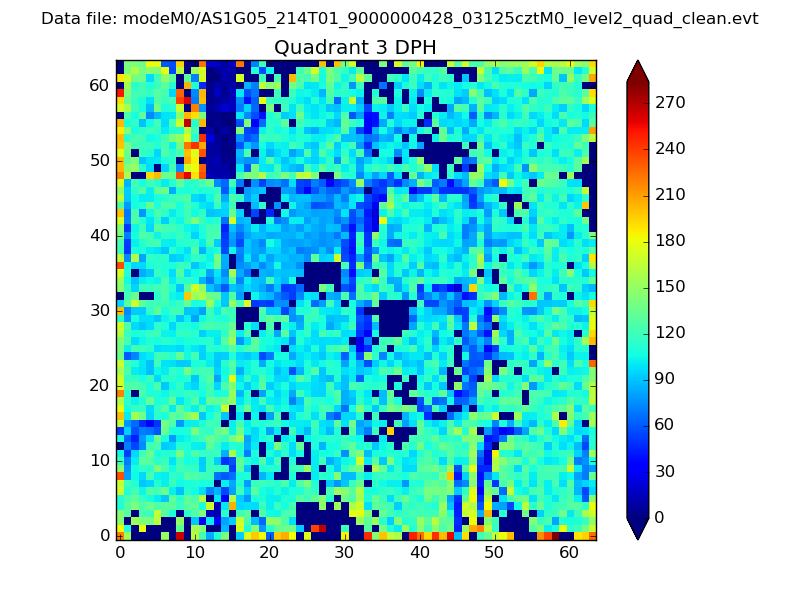 |
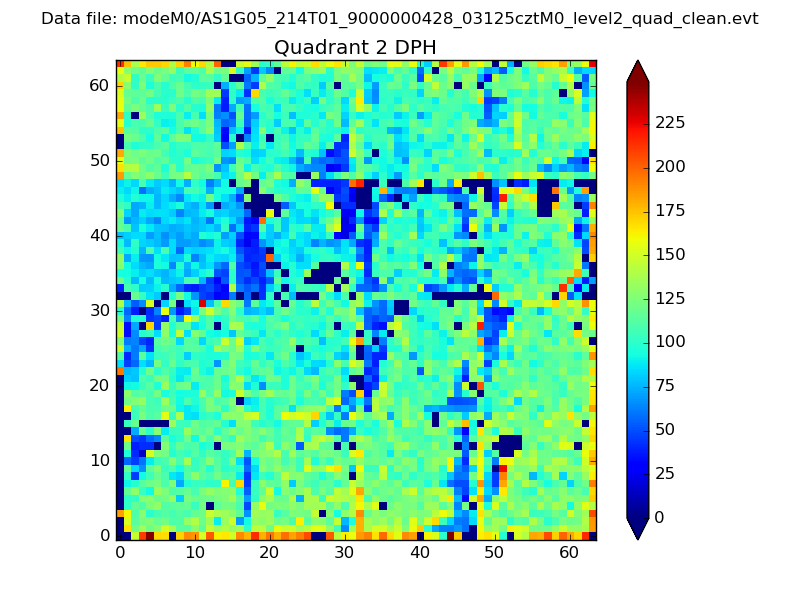 |
Quadrant C |
| Plot type | Count rate plots | Images |
|---|---|---|
| Comparison with Poisson distribution Blue bars denote a histogram of data divided into 1 sec bins. Red curve is a Poisson curve with rate = median count rate of data. |
 |
 |
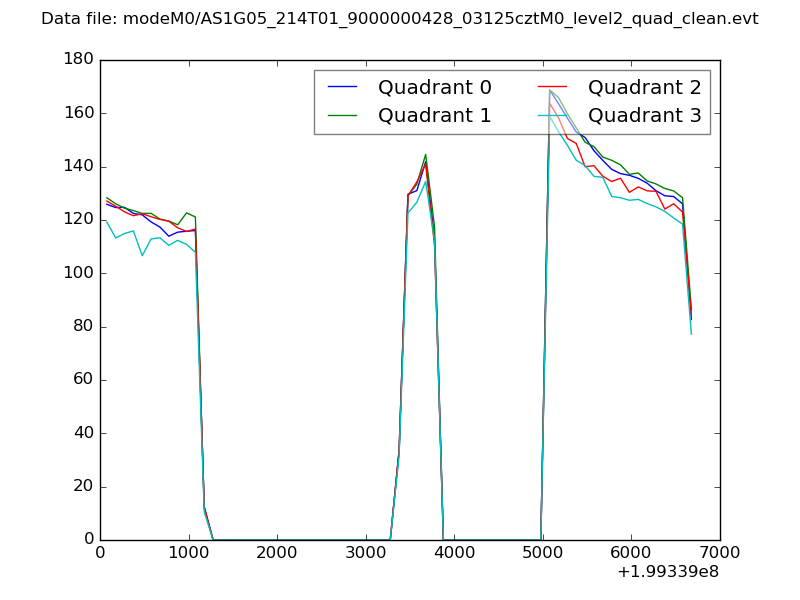
| Quadrant-wise count rates Data is divided into 100 sec bins |
 |
|
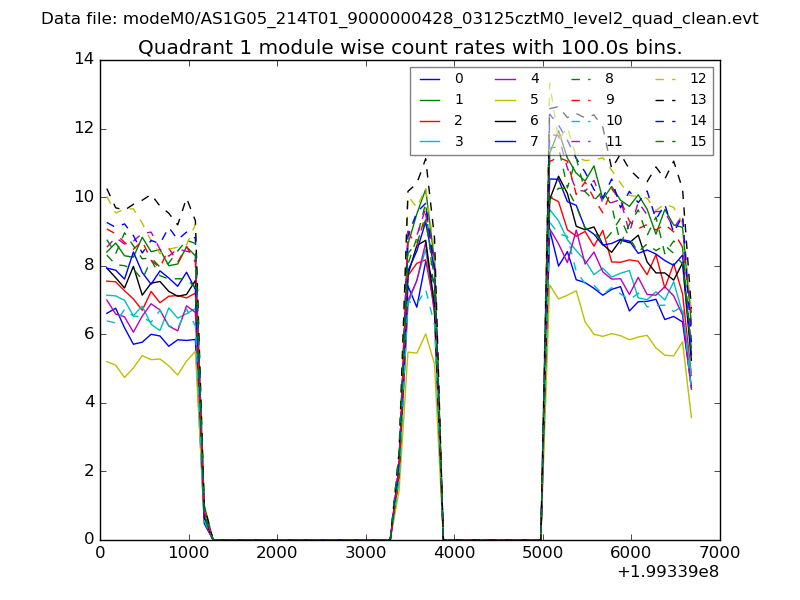
| Module-wise count rates for Quadrant A Data is divided into 100 sec bins |
 |
 |
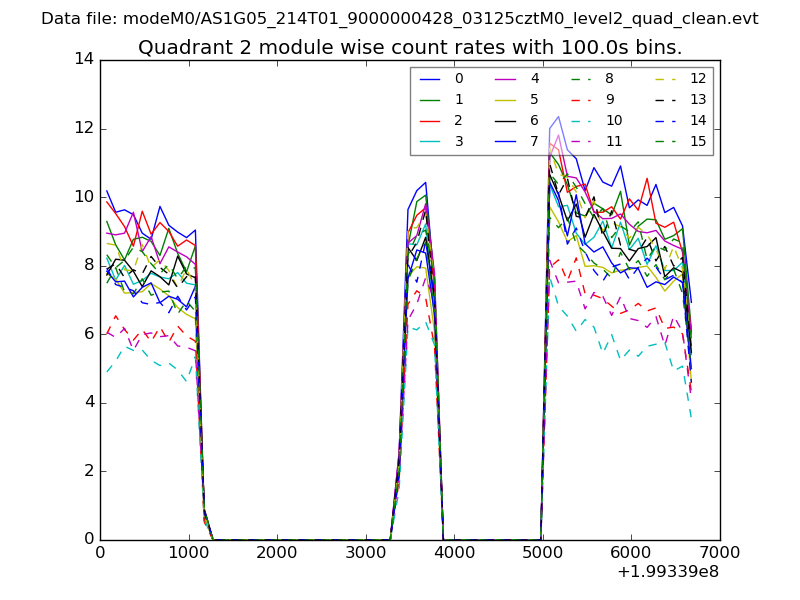
| Module-wise count rates for Quadrant B Data is divided into 100 sec bins |
 |
 |
| Module-wise count rates for Quadrant C Data is divided into 100 sec bins |
 |
 |
| Module-wise count rates for Quadrant D Data is divided into 100 sec bins |
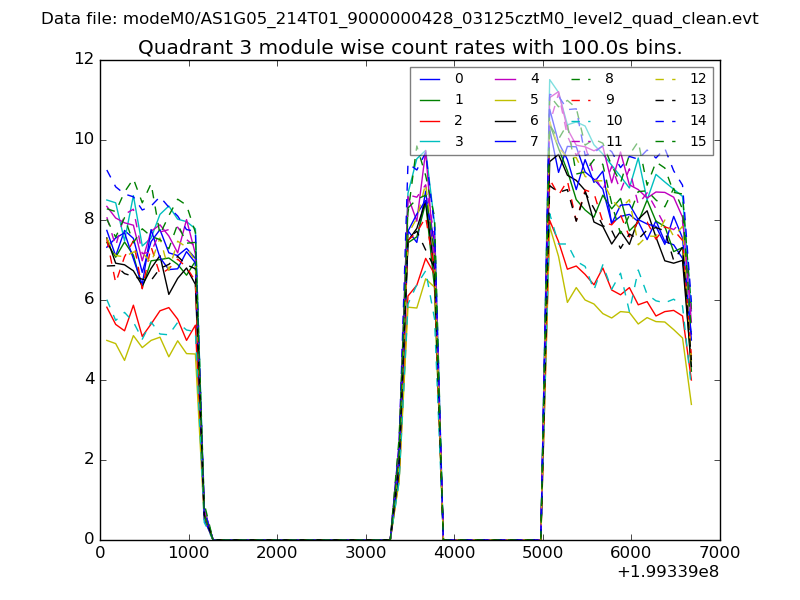 |
 |
| Parameter | Plot |
|---|---|
| CZT HV Monitor | 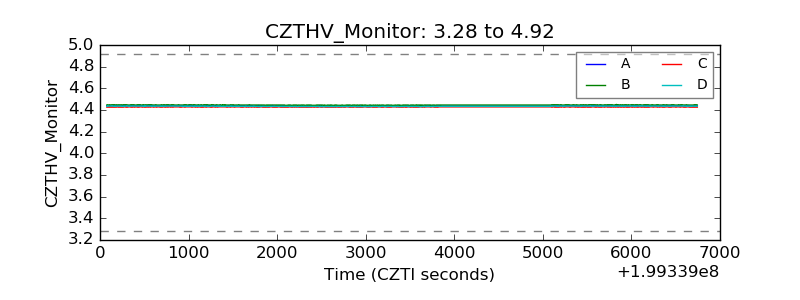 |
| D_VDD | 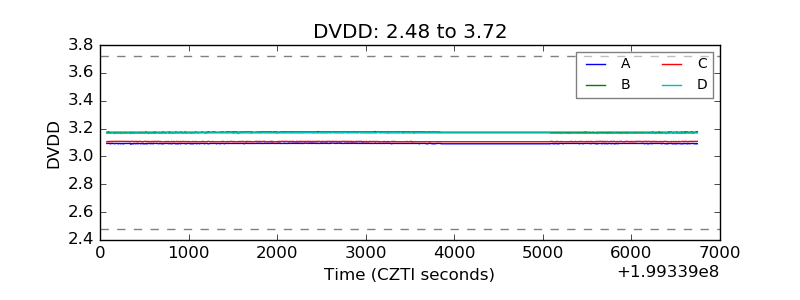 |
| Temperature 1 | 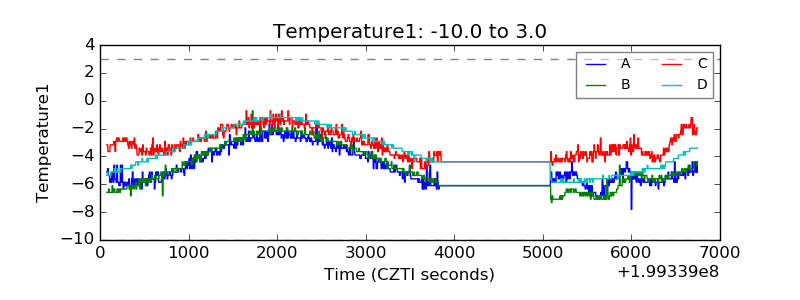 |
| Veto HV Monitor | 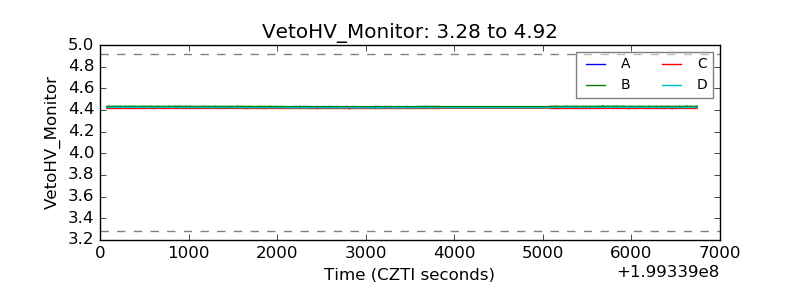 |
| Veto LLD | 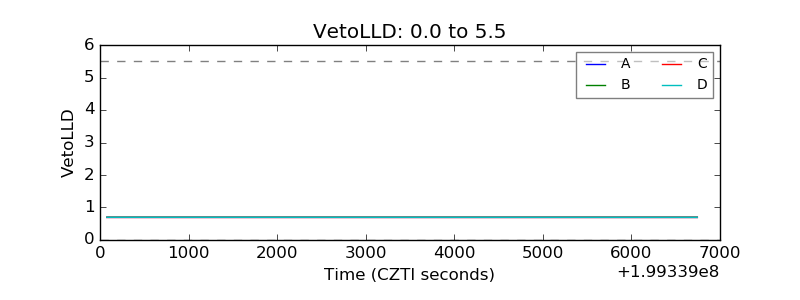 |
| Alpha Counter | 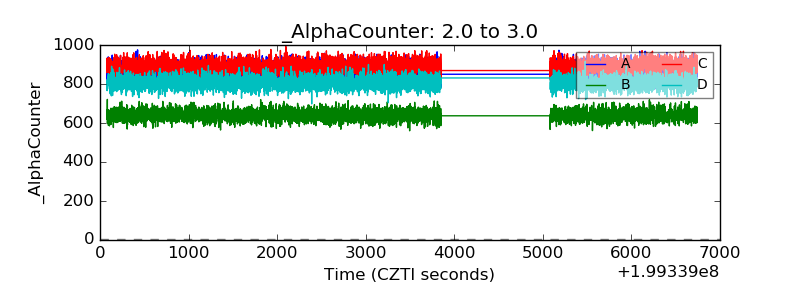 |
| _CPM_Rate |  |
| CZT Counter | 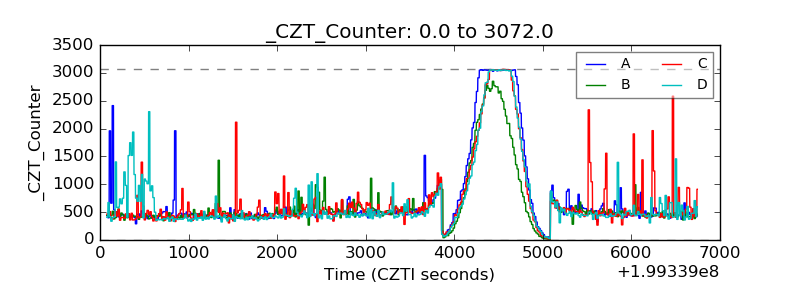 |
| +2.5 Volts monitor |  |
| +5 Volts monitor |  |
| _ROLL_ROT | 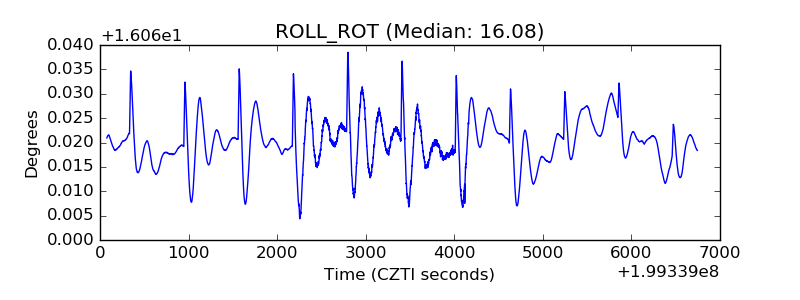 |
| _Roll_DEC | 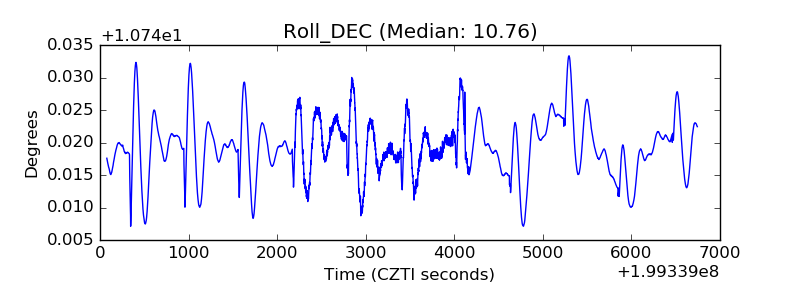 |
| _Roll_RA | 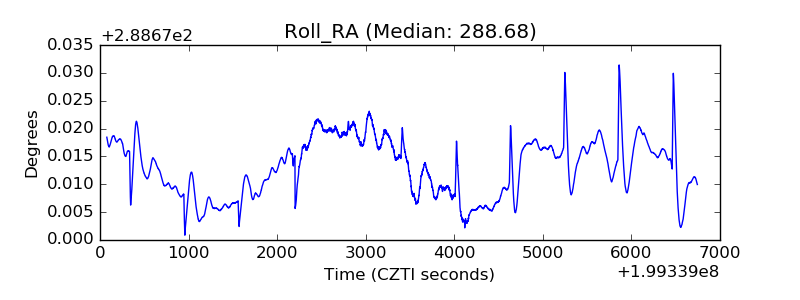 |
| Veto Counter | 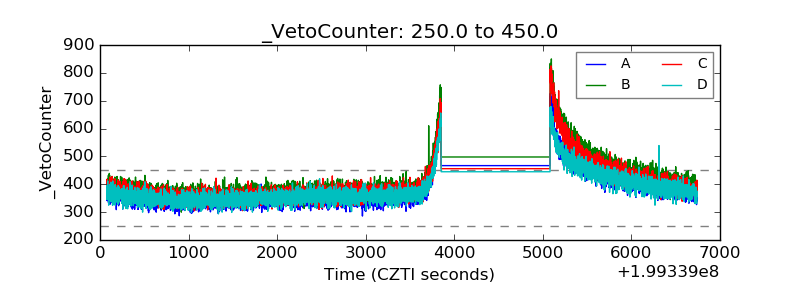 |