| Param | Original file | Final file |
|---|---|---|
| Filename | modeM0/AS1G05_214T01_9000000428_03126cztM0_level2.evt | modeM0/AS1G05_214T01_9000000428_03126cztM0_level2_quad_clean.evt |
| Size (bytes) | 79,234,560 | 15,258,240 |
| Size | 75.6 MB | 14.6 MB |
| Events in quadrant A | 544,848 | 94,032 |
| Events in quadrant B | 512,334 | 97,006 |
| Events in quadrant C | 598,839 | 93,701 |
| Events in quadrant D | 661,900 | 89,153 |
| Mode M0 | |||
|---|---|---|---|
| Quadrant | BADHDUFLAG | Total packets | Discarded packets |
| A | 0 | 2362 | 0 |
| B | 0 | 2314 | 0 |
| C | 0 | 2615 | 0 |
| D | 0 | 2797 | 0 |
| Mode SS | |||
|---|---|---|---|
| Quadrant | BADHDUFLAG | Total packets | Discarded packets |
| A | 0 | 24 | 0 |
| B | 0 | 24 | 0 |
| C | 0 | 24 | 0 |
| D | 0 | 24 | 0 |
| Quadrant | Total seconds | Saturated seconds | Saturation percentage |
|---|---|---|---|
| A | 1151 | 1 | 0.086881% |
| B | 1151 | 0 | 0.000000% |
| C | 1151 | 11 | 0.955691% |
| D | 1151 | 41 | 3.562120% |
Noise dominated data is calculated using 1-second bins in cleaned event files. If a bin has >2000 counts, and if more than 50% of those come from <1% of pixels, then it is considered to be noise-dominated and hence unusable.
| Quadrant | # 1 sec bins | Bins with >0 counts | Bins with >2000 counts | High rate bins dominated by noise | Noise dominated (total time) | Noise dominated (detector-on time) | Marked lightcurve |
|---|---|---|---|---|---|---|---|
| A | 1151 | 1151 | 0 | 0 | 0.00% | 0.00% |  |
| B | 1151 | 1151 | 0 | 0 | 0.00% | 0.00% |  |
| C | 1151 | 1151 | 12 | 12 | 1.04% | 1.04% |  |
| D | 1151 | 1151 | 35 | 35 | 3.04% | 3.04% |  |
Top three noisy pixels from each quadrant. If the there are fewer than three noisy pixels in the level2.evt file, extra rows are filled as -1
| Pixel properties | Quadrant properties | ||||||
|---|---|---|---|---|---|---|---|
| Quadrant | DetID | PixID | Counts | Sigma | Mean | Median | Sigma |
| A | 12 | 247 | 34616 | 1229.48 | 128 | 126 | 28.1 |
| A | 0 | 13 | 8435 | 296.19 | 128 | 126 | 28.1 |
| A | 0 | 5 | 3314 | 113.64 | 128 | 126 | 28.1 |
| B | 4 | 216 | 3187 | 114.28 | 128 | 126 | 26.8 |
| B | 15 | 204 | 2439 | 86.35 | 128 | 126 | 26.8 |
| B | 0 | 198 | 2373 | 83.89 | 128 | 126 | 26.8 |
| C | 1 | 192 | 73227 | 2466.55 | 121 | 121 | 29.6 |
| C | 5 | 250 | 26481 | 889.37 | 121 | 121 | 29.6 |
| C | 0 | 219 | 9445 | 314.59 | 121 | 121 | 29.6 |
| D | 13 | 223 | 102292 | 3324.17 | 120 | 116 | 30.7 |
| D | 13 | 120 | 38309 | 1242.56 | 120 | 116 | 30.7 |
| D | 2 | 136 | 27633 | 895.23 | 120 | 116 | 30.7 |
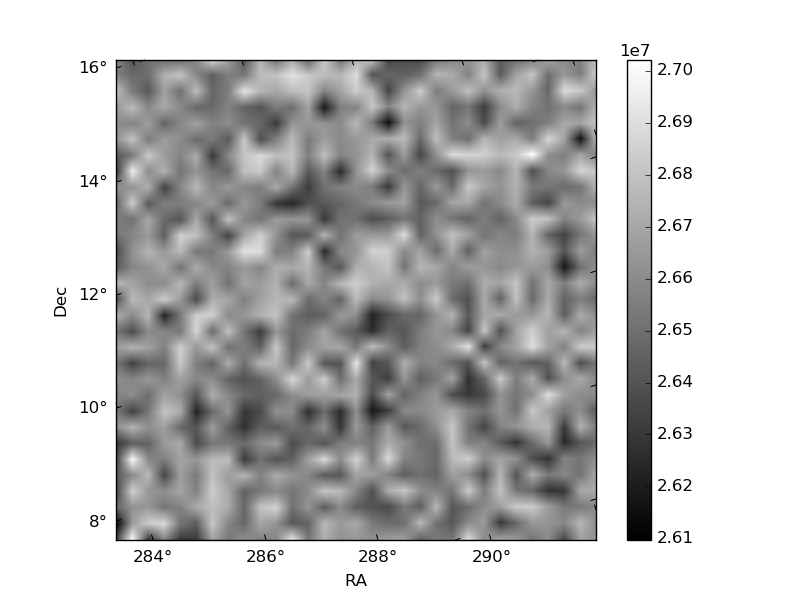
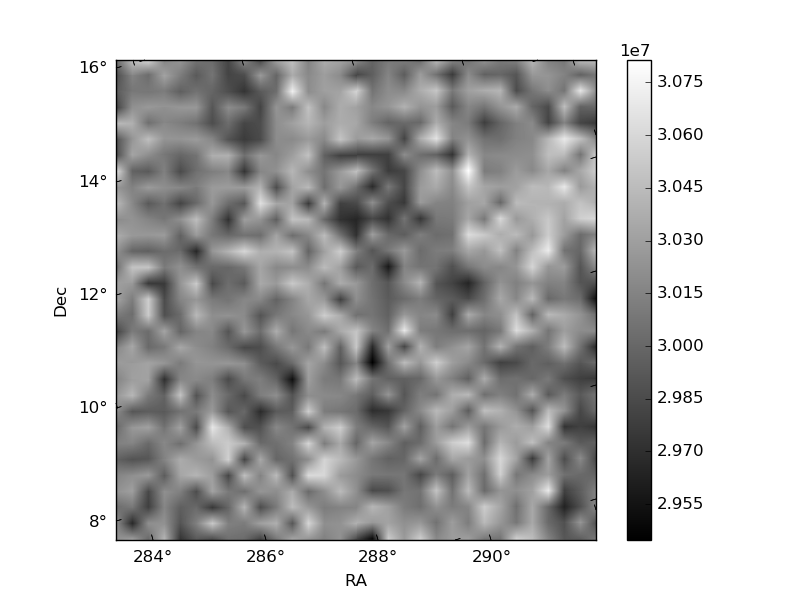
Histogram calculated using DETX and DETY for each event in the final _common_clean file
| Quadrant A | 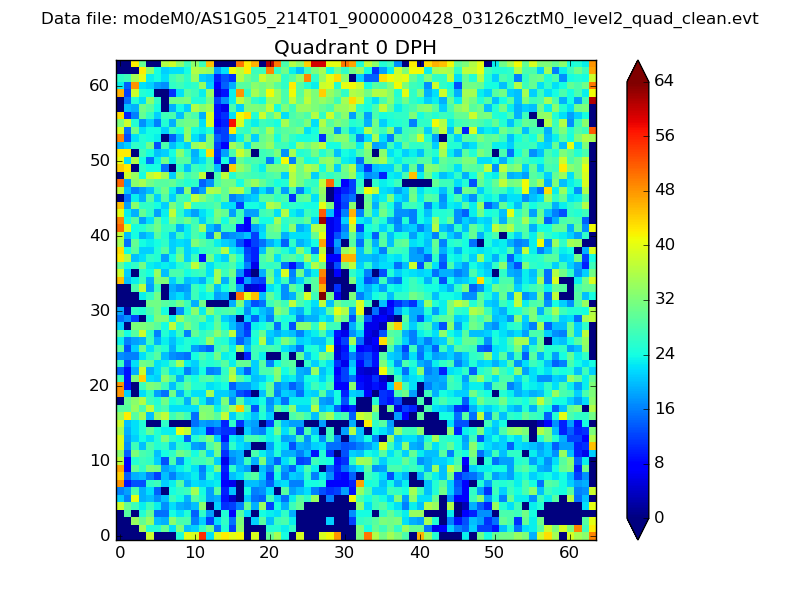 |
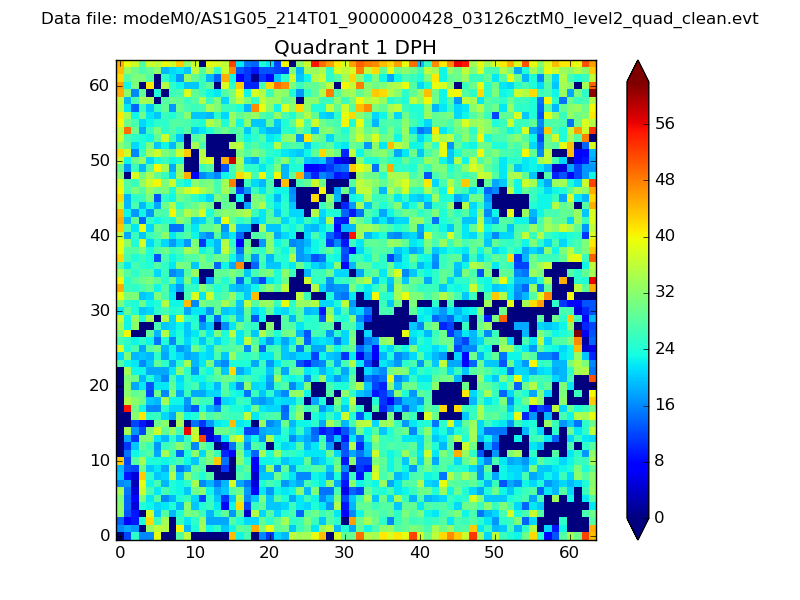 |
Quadrant B |
|---|---|---|---|
| Quadrant D | 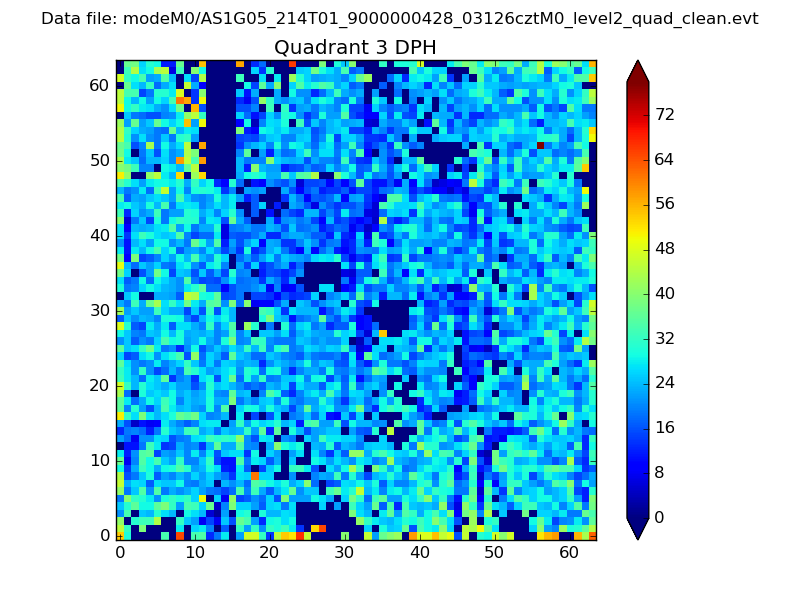 |
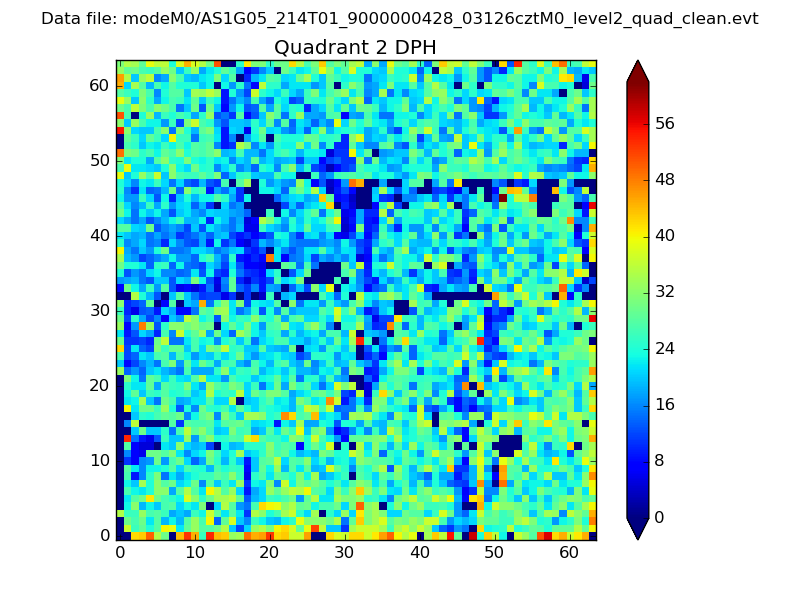 |
Quadrant C |
| Plot type | Count rate plots | Images |
|---|---|---|
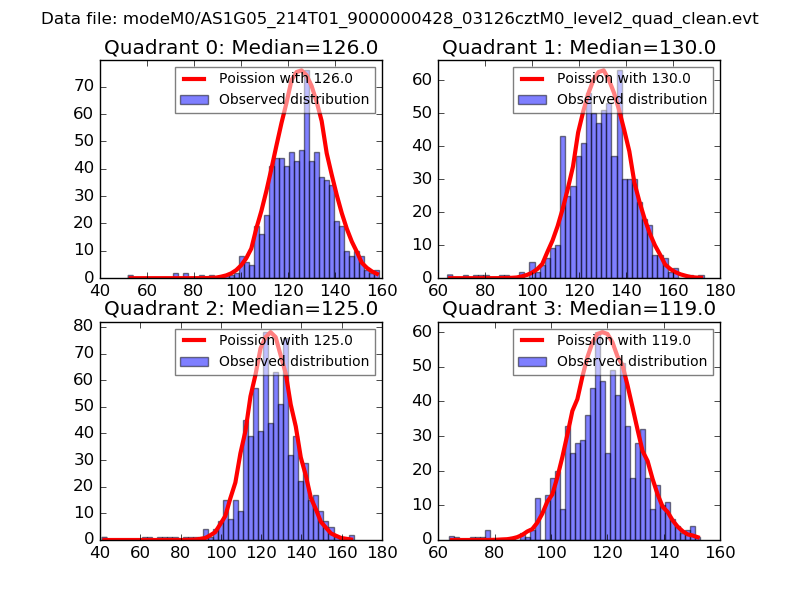
| Comparison with Poisson distribution Blue bars denote a histogram of data divided into 1 sec bins. Red curve is a Poisson curve with rate = median count rate of data. |
 |
 |
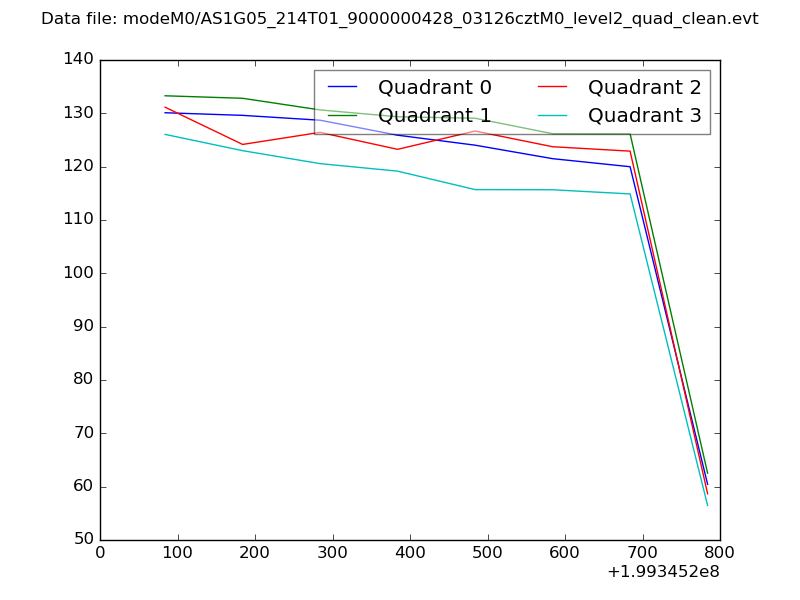
| Quadrant-wise count rates Data is divided into 100 sec bins |
 |
|
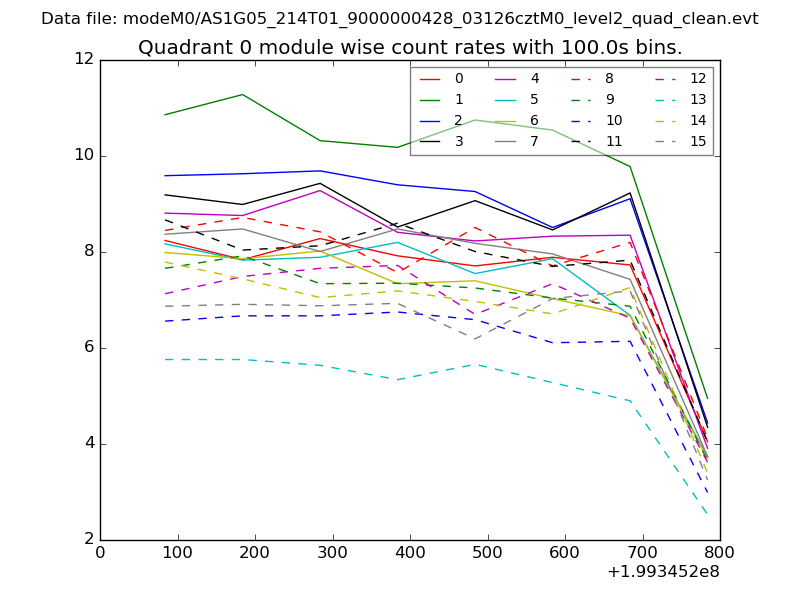
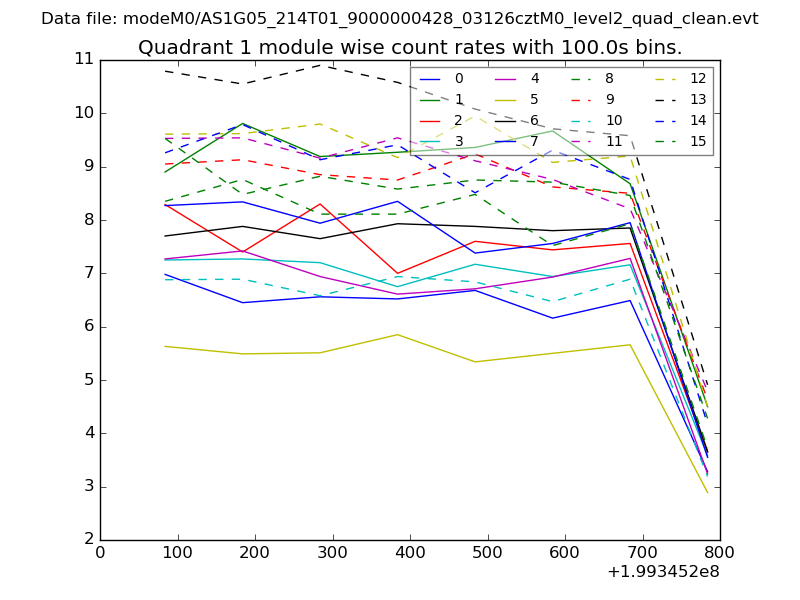
| Module-wise count rates for Quadrant A Data is divided into 100 sec bins |
 |
 |
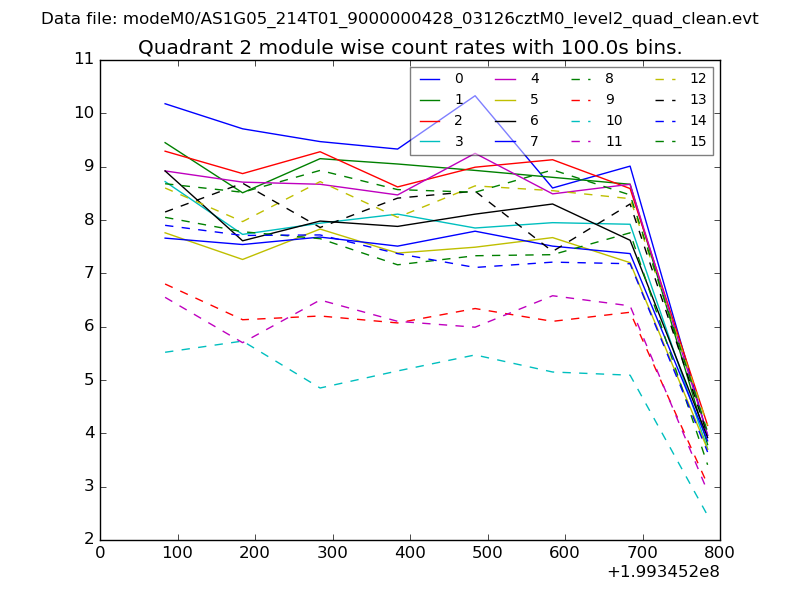
| Module-wise count rates for Quadrant B Data is divided into 100 sec bins |
 |
 |
| Module-wise count rates for Quadrant C Data is divided into 100 sec bins |
 |
 |
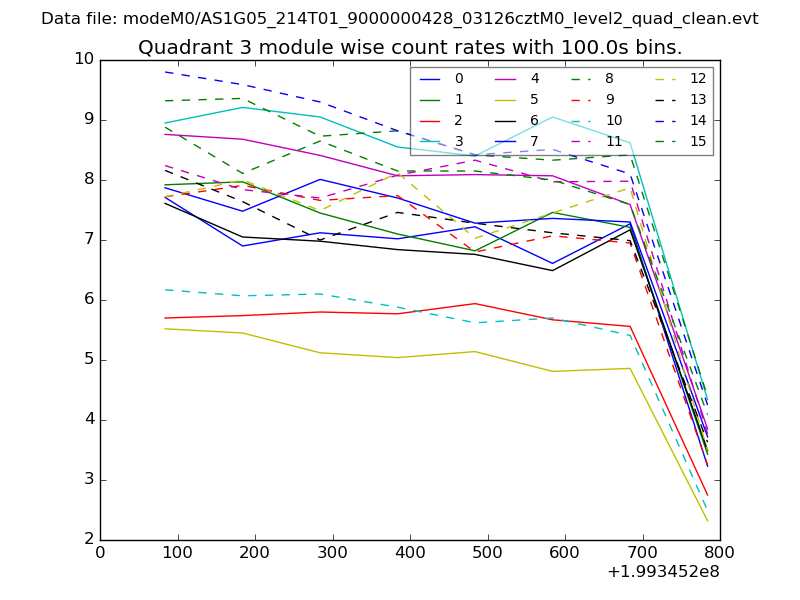
| Module-wise count rates for Quadrant D Data is divided into 100 sec bins |
 |
 |
| Parameter | Plot |
|---|---|
| CZT HV Monitor | 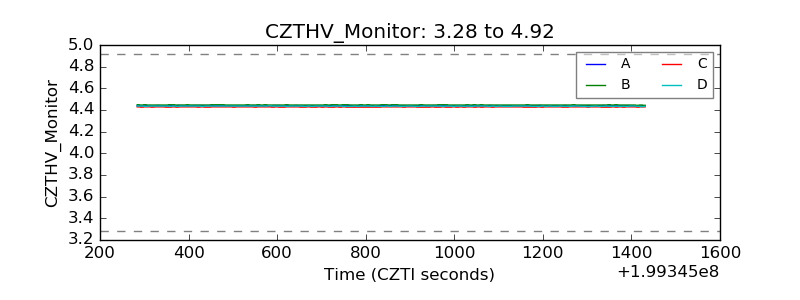 |
| D_VDD | 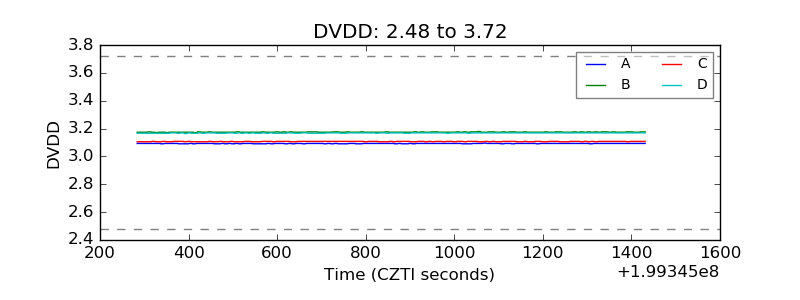 |
| Temperature 1 | 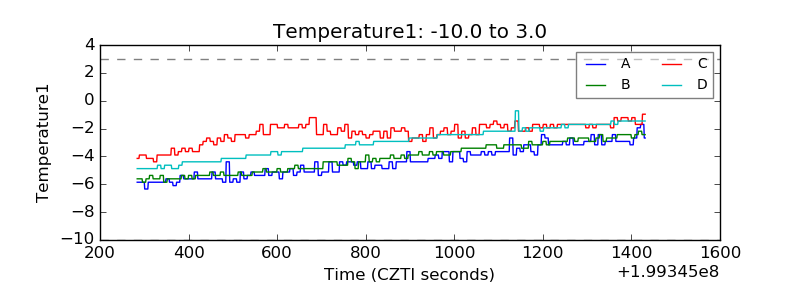 |
| Veto HV Monitor | 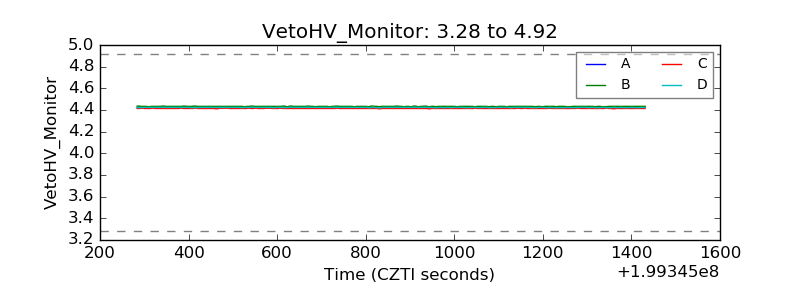 |
| Veto LLD | 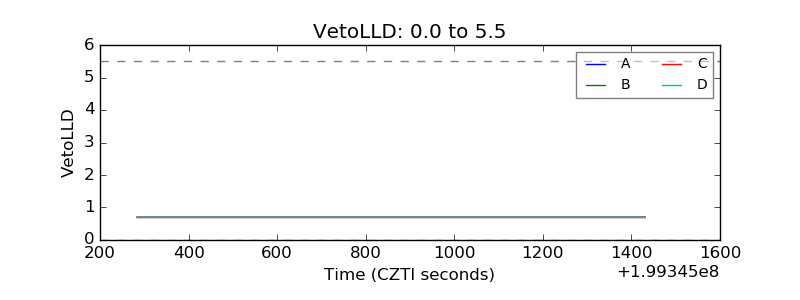 |
| Alpha Counter | 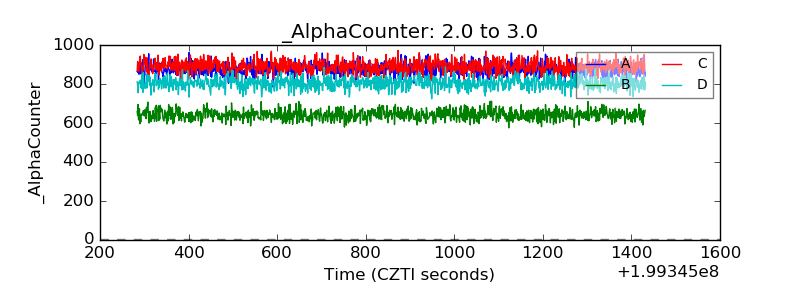 |
| _CPM_Rate | 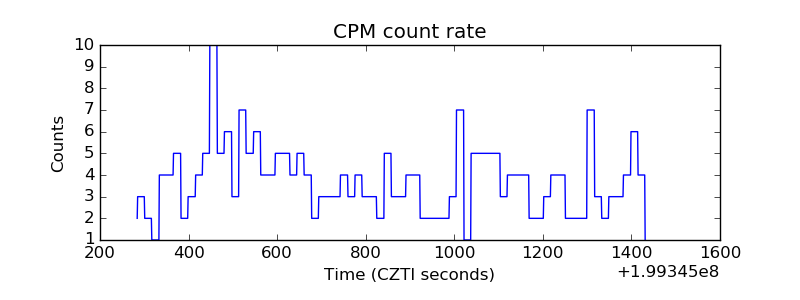 |
| CZT Counter | 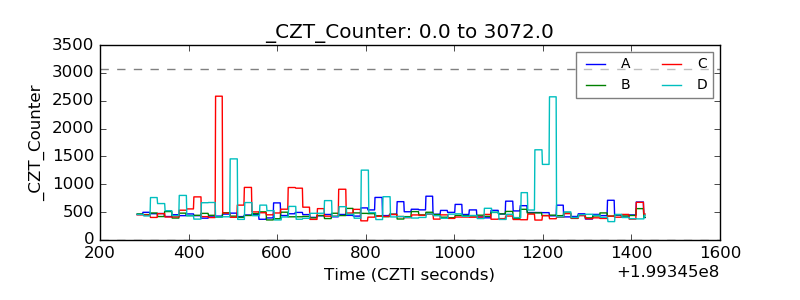 |
| +2.5 Volts monitor | 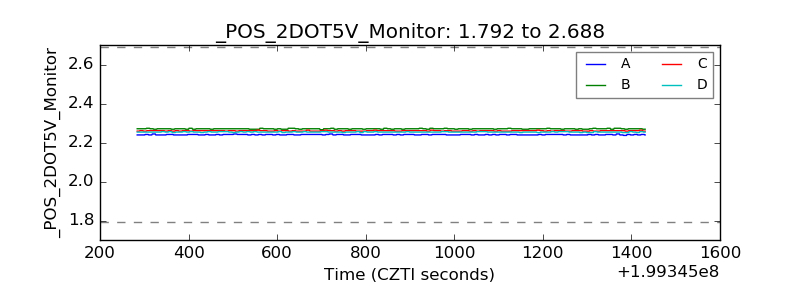 |
| +5 Volts monitor |  |
| _ROLL_ROT | 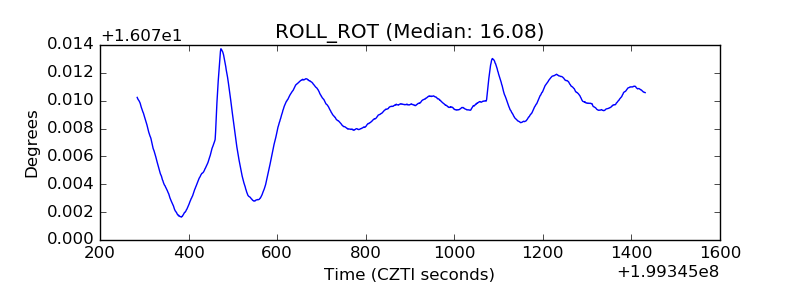 |
| _Roll_DEC | 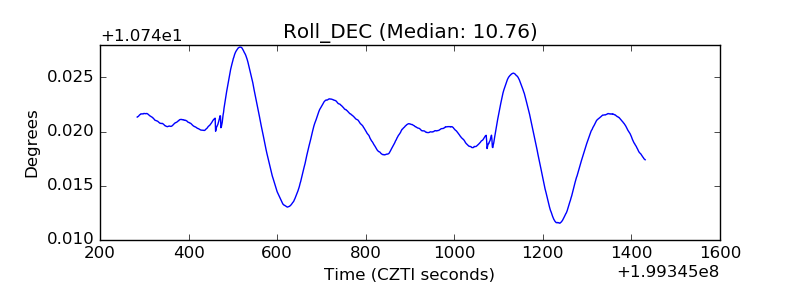 |
| _Roll_RA | 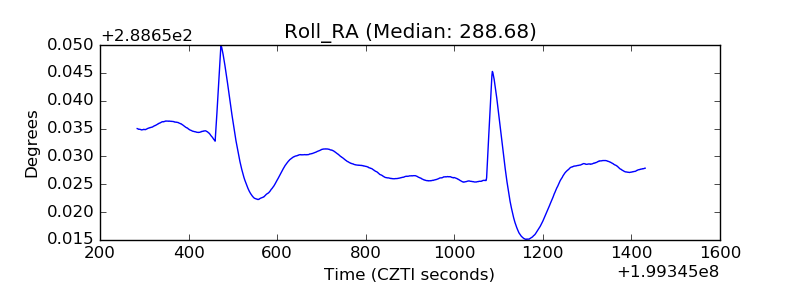 |
| Veto Counter | 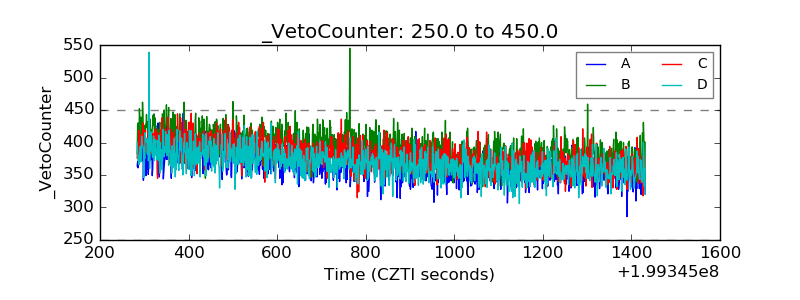 |