| Param | Original file | Final file |
|---|---|---|
| Filename | modeM0/AS1T01_118T01_9000000430cztM0_level2.fits | modeM0/AS1T01_118T01_9000000430cztM0_level2_quad_clean.evt |
| Size (bytes) | 975,072,960 | 945,576,000 |
| Size | 929.9 MB | 901.8 MB |
| Events in quadrant A | 5,941,744 | 5,732,229 |
| Events in quadrant B | 5,756,488 | 5,765,275 |
| Events in quadrant C | 5,189,148 | 4,559,711 |
| Events in quadrant D | 5,057,692 | 5,008,050 |
| Mode SS | |||
|---|---|---|---|
| Quadrant | BADHDUFLAG | Total packets | Discarded packets |
| A | 0 | 2244 | 0 |
| B | 0 | 2244 | 0 |
| C | 0 | 2244 | 0 |
| D | 0 | 2244 | 0 |
| Mode M0 | |||
|---|---|---|---|
| Quadrant | BADHDUFLAG | Total packets | Discarded packets |
| A | 0 | 243583 | 0 |
| B | 0 | 241007 | 0 |
| C | 0 | 424961 | 0 |
| D | 0 | 257601 | 0 |
| Mode M9 | |||
|---|---|---|---|
| Quadrant | BADHDUFLAG | Total packets | Discarded packets |
| A | 0 | 153 | 0 |
| B | 0 | 153 | 0 |
| C | 0 | 153 | 0 |
| D | 0 | 153 | 0 |
| Quadrant | Total seconds | Saturated seconds | Saturation percentage |
|---|---|---|---|
| A | 110472 | 3452 | 3.124774% |
| B | 110472 | 2644 | 2.393367% |
| C | 110449 | 23645 | 21.408071% |
| D | 110472 | 3333 | 3.017054% |
Noise dominated data is calculated using 1-second bins in cleaned event files. If a bin has >2000 counts, and if more than 50% of those come from <1% of pixels, then it is considered to be noise-dominated and hence unusable.
| Quadrant | # 1 sec bins | Bins with >0 counts | Bins with >2000 counts | High rate bins dominated by noise | Noise dominated (total time) | Noise dominated (detector-on time) | Marked lightcurve |
|---|---|---|---|---|---|---|---|
| A | 125802 | 110442 | 0 | 0 | 0.00% | 0.00% |  |
| B | 125802 | 110464 | 0 | 0 | 0.00% | 0.00% | 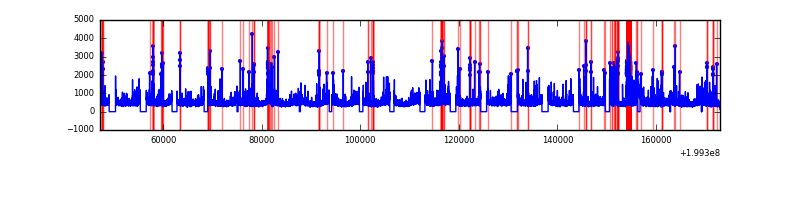 |
| C | 125802 | 108941 | 0 | 0 | 0.00% | 0.00% |  |
| D | 125801 | 110453 | 0 | 0 | 0.00% | 0.00% |  |
Top three noisy pixels from each quadrant. If the there are fewer than three noisy pixels in the level2.evt file, extra rows are filled as -1
| Pixel properties | Quadrant properties | ||||||
|---|---|---|---|---|---|---|---|
| Quadrant | DetID | PixID | Counts | Sigma | Mean | Median | Sigma |
| A | 14 | 188 | 5773 | 10.89 | 1542 | 1435 | 398.3 |
| A | 14 | 204 | 5025 | 9.01 | 1542 | 1435 | 398.3 |
| A | 0 | 29 | 4987 | 8.92 | 1542 | 1435 | 398.3 |
| B | 2 | 9 | 4955 | 11.45 | 1523 | 1443 | 306.6 |
| B | 12 | 226 | 4316 | 9.37 | 1523 | 1443 | 306.6 |
| B | 14 | 254 | 4133 | 8.77 | 1523 | 1443 | 306.6 |
| C | 1 | 80 | 3835 | 6.98 | 1372 | 1261 | 368.8 |
| C | 1 | 81 | 3747 | 6.74 | 1372 | 1261 | 368.8 |
| C | 7 | 111 | 3569 | 6.26 | 1372 | 1261 | 368.8 |
| D | 3 | 14 | 3776 | 6.33 | 1447 | 1310 | 389.8 |
| D | 4 | 160 | 3753 | 6.27 | 1447 | 1310 | 389.8 |
| D | 7 | 3 | 3658 | 6.02 | 1447 | 1310 | 389.8 |
Histogram calculated using DETX and DETY for each event in the final _common_clean file
| Quadrant A | 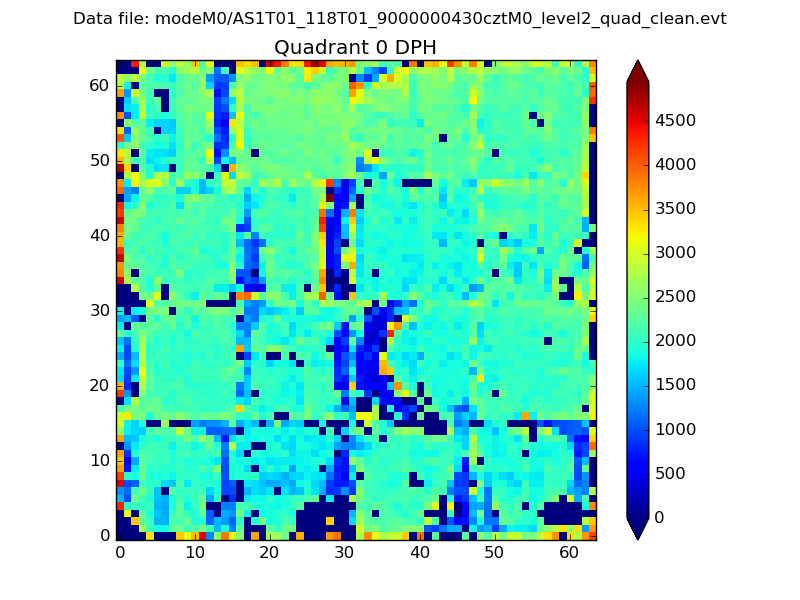 |
 |
Quadrant B |
|---|---|---|---|
| Quadrant D |  |
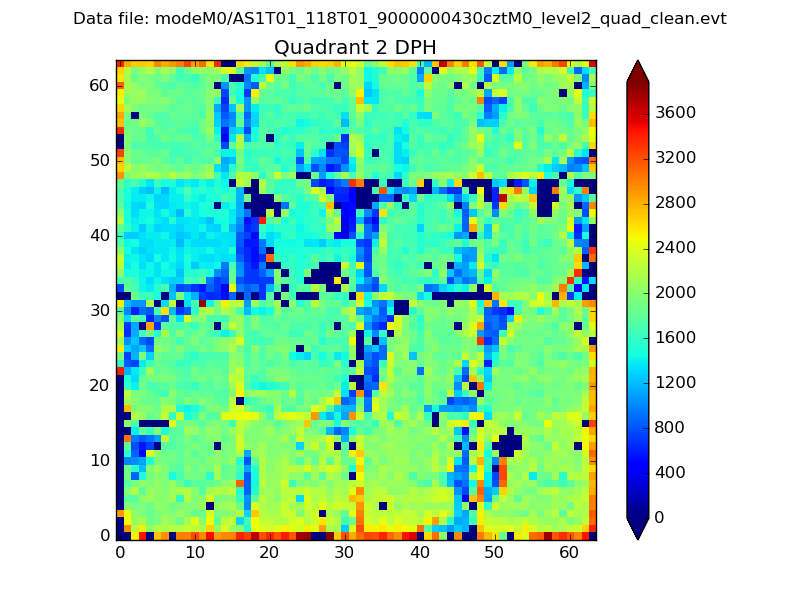 |
Quadrant C |
| Plot type | Count rate plots | Images |
|---|---|---|
| Comparison with Poisson distribution Blue bars denote a histogram of data divided into 1 sec bins. Red curve is a Poisson curve with rate = median count rate of data. |
 |
 |
| Quadrant-wise count rates Data is divided into 100 sec bins |
 |
|
| Module-wise count rates for Quadrant A Data is divided into 100 sec bins |
 |
 |
| Module-wise count rates for Quadrant B Data is divided into 100 sec bins |
 |
 |
| Module-wise count rates for Quadrant C Data is divided into 100 sec bins |
 |
 |
| Module-wise count rates for Quadrant D Data is divided into 100 sec bins |
 |
 |
| Parameter | Plot |
|---|---|
| CZT HV Monitor | 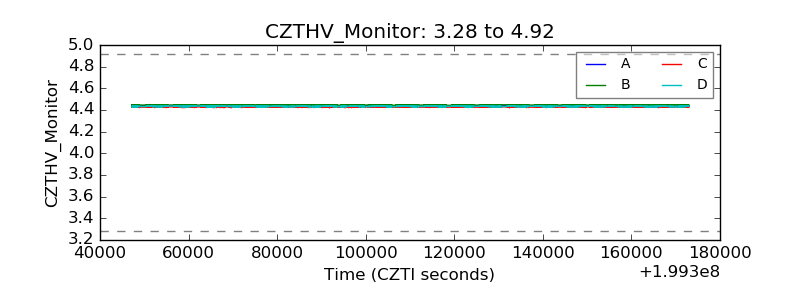 |
| D_VDD |  |
| Temperature 1 |  |
| Veto HV Monitor |  |
| Veto LLD |  |
| Alpha Counter |  |
| _CPM_Rate |  |
| CZT Counter |  |
| +2.5 Volts monitor |  |
| +5 Volts monitor |  |
| _ROLL_ROT |  |
| _Roll_DEC |  |
| _Roll_RA |  |
| Veto Counter |  |