| Param | Original file | Final file |
|---|---|---|
| Filename | modeM0/AS1T01_118T01_9000000430_03126cztM0_level2.evt | modeM0/AS1T01_118T01_9000000430_03126cztM0_level2_quad_clean.evt |
| Size (bytes) | 303,952,320 | 47,882,880 |
| Size | 289.9 MB | 45.7 MB |
| Events in quadrant A | 2,171,097 | 312,807 |
| Events in quadrant B | 1,621,203 | 330,121 |
| Events in quadrant C | 3,685,858 | 281,077 |
| Events in quadrant D | 1,518,915 | 308,392 |
| Mode SS | |||
|---|---|---|---|
| Quadrant | BADHDUFLAG | Total packets | Discarded packets |
| A | 0 | 64 | 0 |
| B | 0 | 64 | 0 |
| C | 0 | 64 | 0 |
| D | 0 | 64 | 0 |
| Mode M0 | |||
|---|---|---|---|
| Quadrant | BADHDUFLAG | Total packets | Discarded packets |
| A | 0 | 8408 | 2 |
| B | 0 | 6617 | 1 |
| C | 0 | 13054 | 1 |
| D | 0 | 6515 | 1 |
| Mode M9 | |||
|---|---|---|---|
| Quadrant | BADHDUFLAG | Total packets | Discarded packets |
| A | 0 | 13 | 0 |
| B | 0 | 13 | 0 |
| C | 0 | 13 | 0 |
| D | 0 | 13 | 0 |
| Quadrant | Total seconds | Saturated seconds | Saturation percentage |
|---|---|---|---|
| A | 3042 | 246 | 8.086785% |
| B | 3042 | 40 | 1.314924% |
| C | 3042 | 536 | 17.619987% |
| D | 3042 | 29 | 0.953320% |
Noise dominated data is calculated using 1-second bins in cleaned event files. If a bin has >2000 counts, and if more than 50% of those come from <1% of pixels, then it is considered to be noise-dominated and hence unusable.
| Quadrant | # 1 sec bins | Bins with >0 counts | Bins with >2000 counts | High rate bins dominated by noise | Noise dominated (total time) | Noise dominated (detector-on time) | Marked lightcurve |
|---|---|---|---|---|---|---|---|
| A | 4347 | 3043 | 134 | 134 | 3.08% | 4.40% | 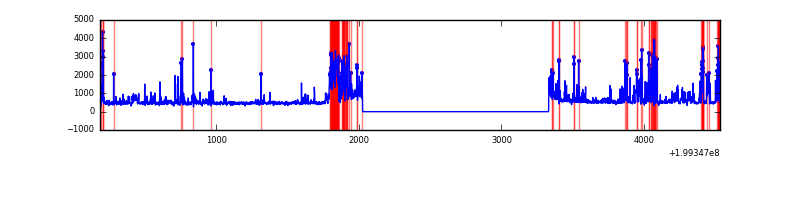 |
| B | 4347 | 3043 | 8 | 8 | 0.18% | 0.26% | 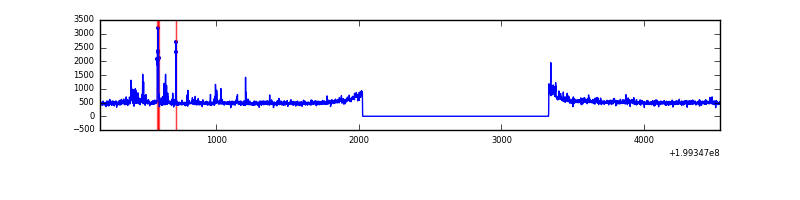 |
| C | 4347 | 3043 | 464 | 464 | 10.67% | 15.25% | 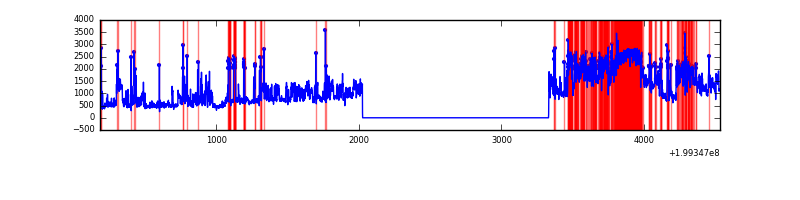 |
| D | 4347 | 3043 | 3 | 3 | 0.07% | 0.10% | 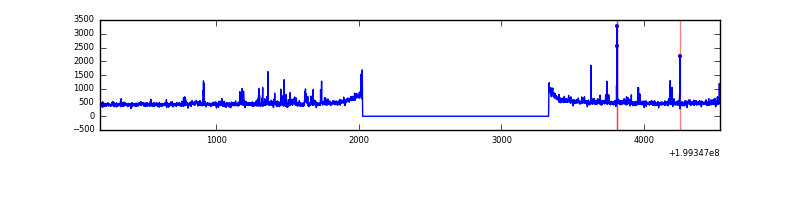 |
Top three noisy pixels from each quadrant. If the there are fewer than three noisy pixels in the level2.evt file, extra rows are filled as -1
| Pixel properties | Quadrant properties | ||||||
|---|---|---|---|---|---|---|---|
| Quadrant | DetID | PixID | Counts | Sigma | Mean | Median | Sigma |
| A | 0 | 13 | 441908 | 5661.72 | 376 | 367 | 78.0 |
| A | 12 | 247 | 258424 | 3308.97 | 376 | 367 | 78.0 |
| A | 0 | 166 | 11148 | 138.24 | 376 | 367 | 78.0 |
| B | 4 | 81 | 64270 | 835.58 | 391 | 383 | 76.5 |
| B | 15 | 85 | 11110 | 140.3 | 391 | 383 | 76.5 |
| B | 2 | 249 | 9086 | 113.83 | 391 | 383 | 76.5 |
| C | 0 | 219 | 2105214 | 25423.57 | 348 | 349 | 82.8 |
| C | 5 | 250 | 69570 | 836.08 | 348 | 349 | 82.8 |
| C | 0 | 235 | 48506 | 581.66 | 348 | 349 | 82.8 |
| D | 13 | 120 | 21054 | 224.91 | 374 | 363 | 92.0 |
| D | 13 | 114 | 19214 | 204.91 | 374 | 363 | 92.0 |
| D | 2 | 136 | 18411 | 196.18 | 374 | 363 | 92.0 |
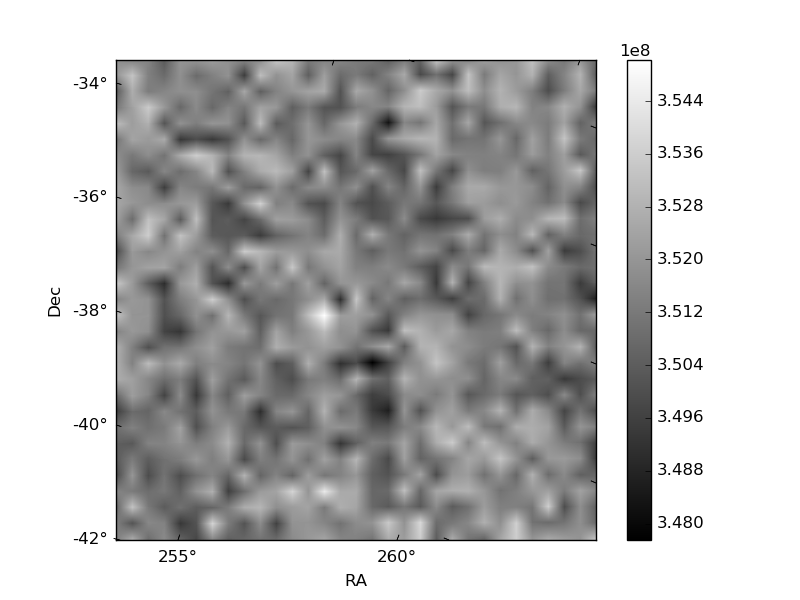
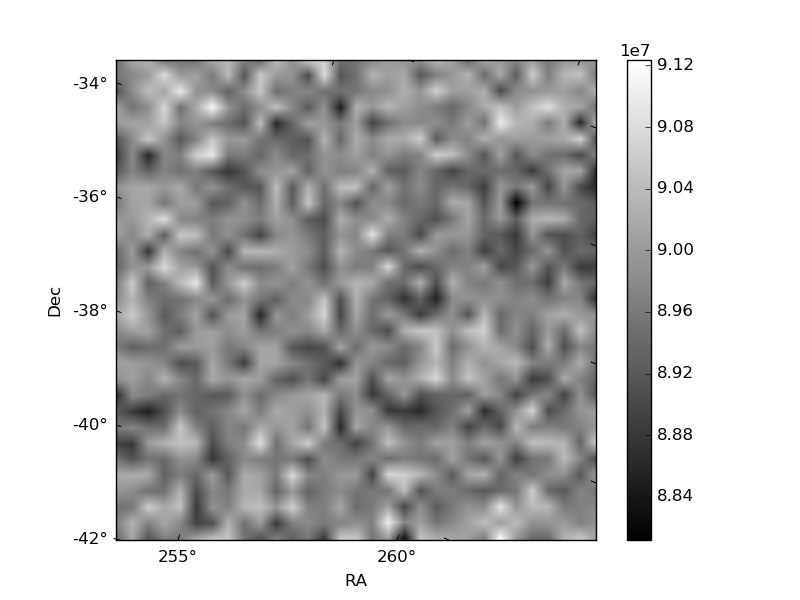
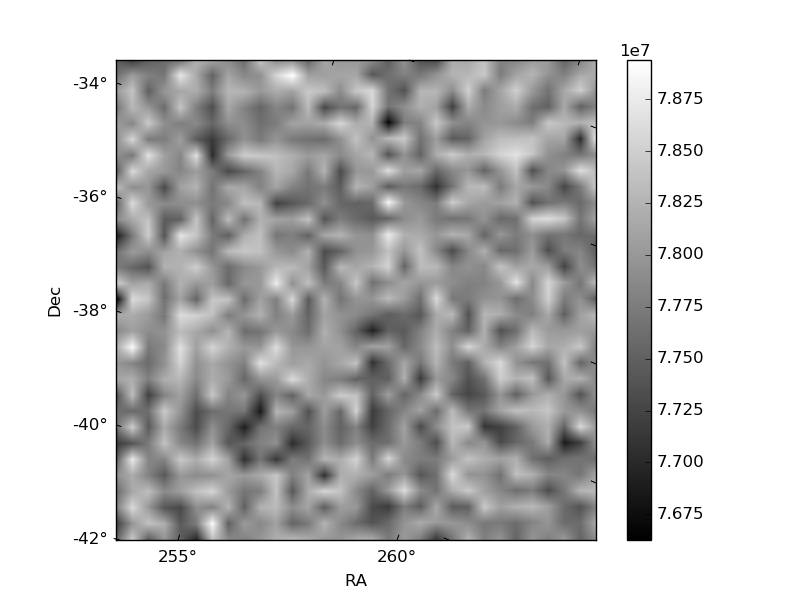
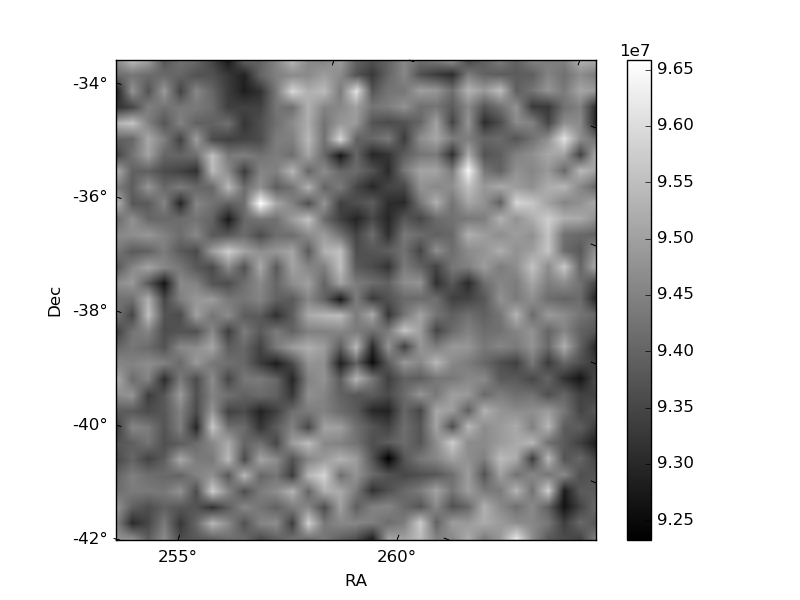
Histogram calculated using DETX and DETY for each event in the final _common_clean file
| Quadrant A | 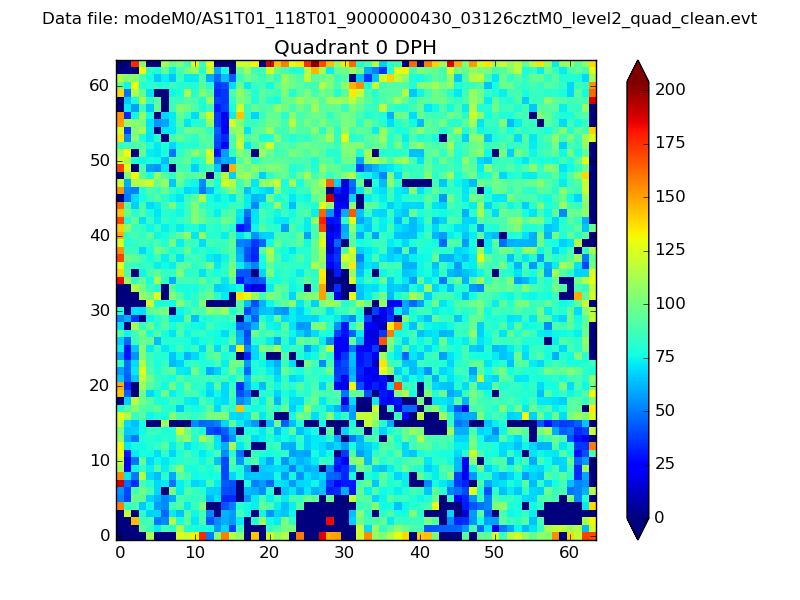 |
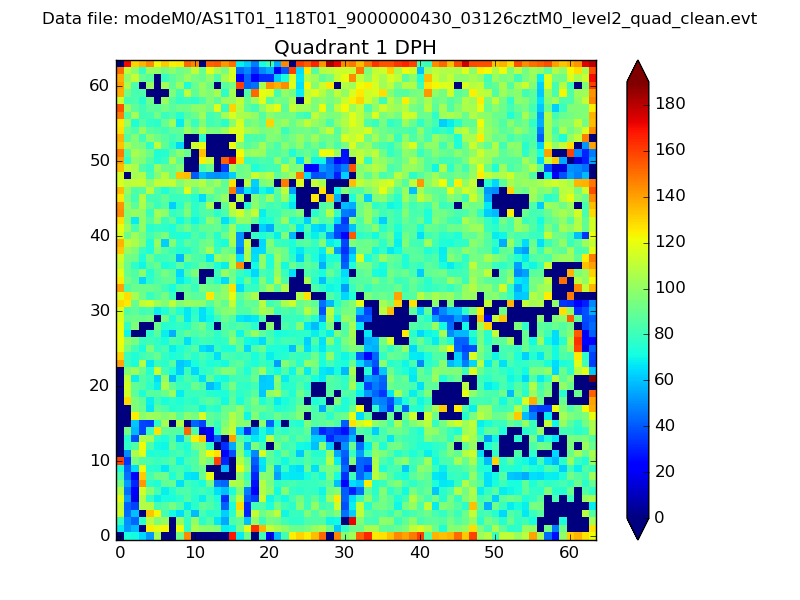 |
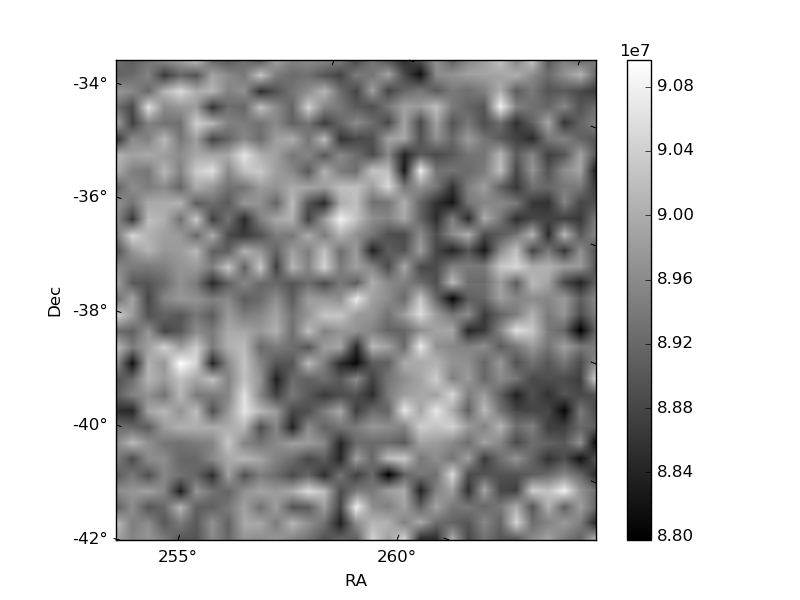
Quadrant B |
|---|---|---|---|
| Quadrant D | 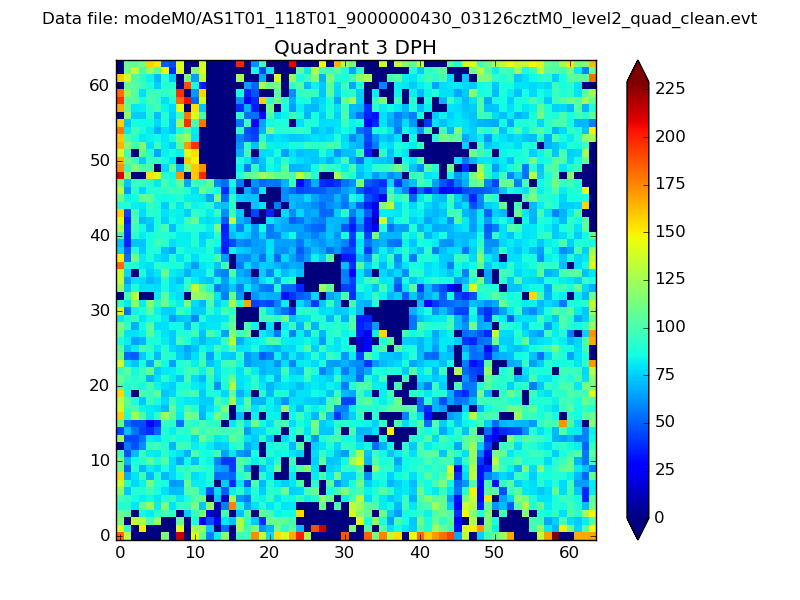 |
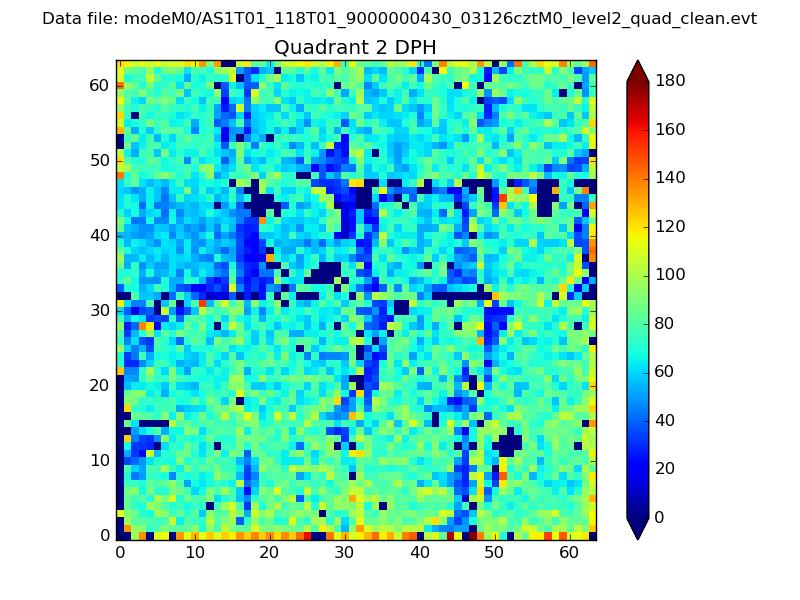 |
Quadrant C |
| Plot type | Count rate plots | Images |
|---|---|---|
| Comparison with Poisson distribution Blue bars denote a histogram of data divided into 1 sec bins. Red curve is a Poisson curve with rate = median count rate of data. |
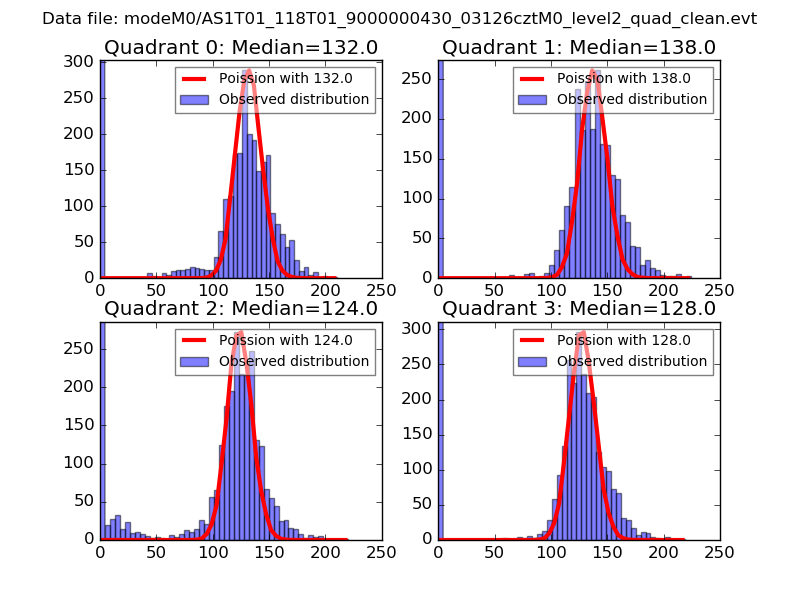 |
 |
| Quadrant-wise count rates Data is divided into 100 sec bins |
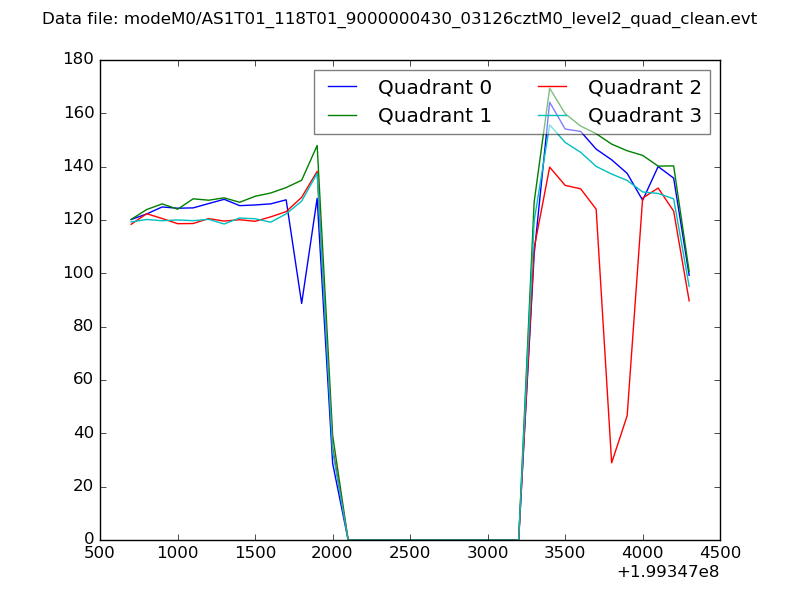 |
|
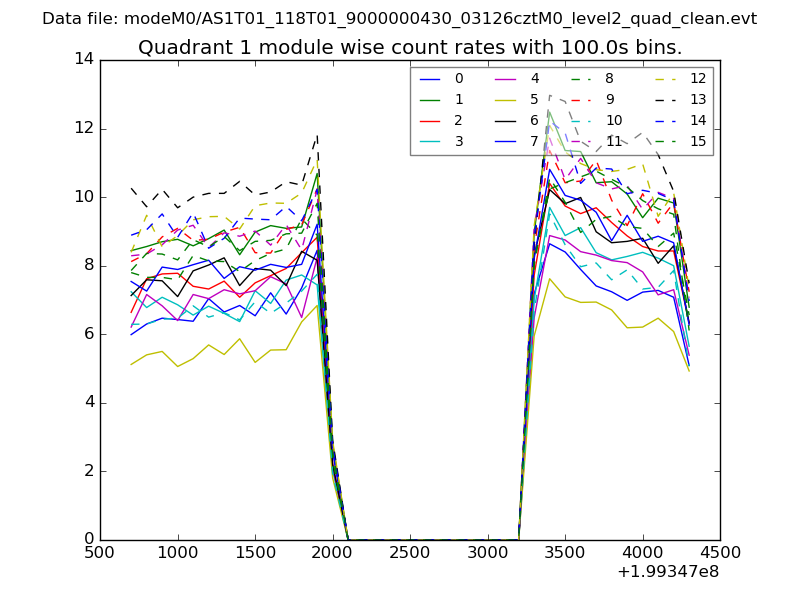
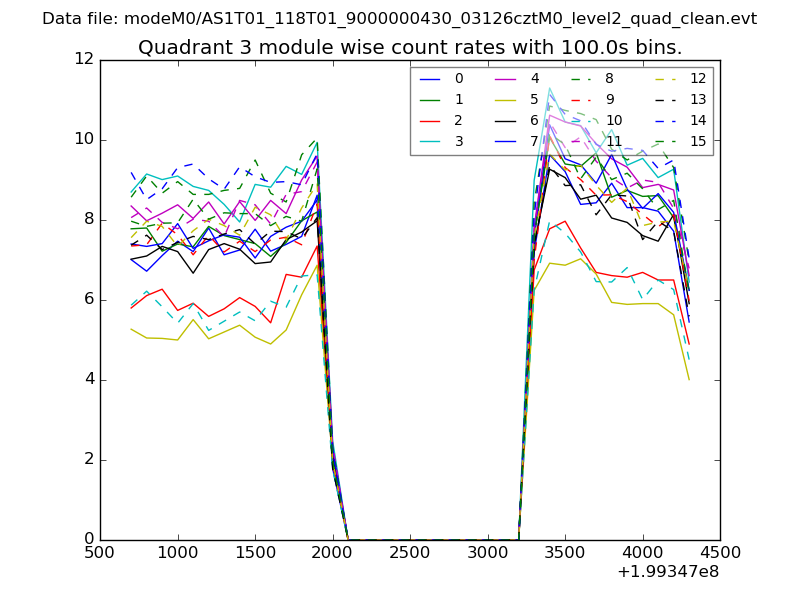
| Module-wise count rates for Quadrant A Data is divided into 100 sec bins |
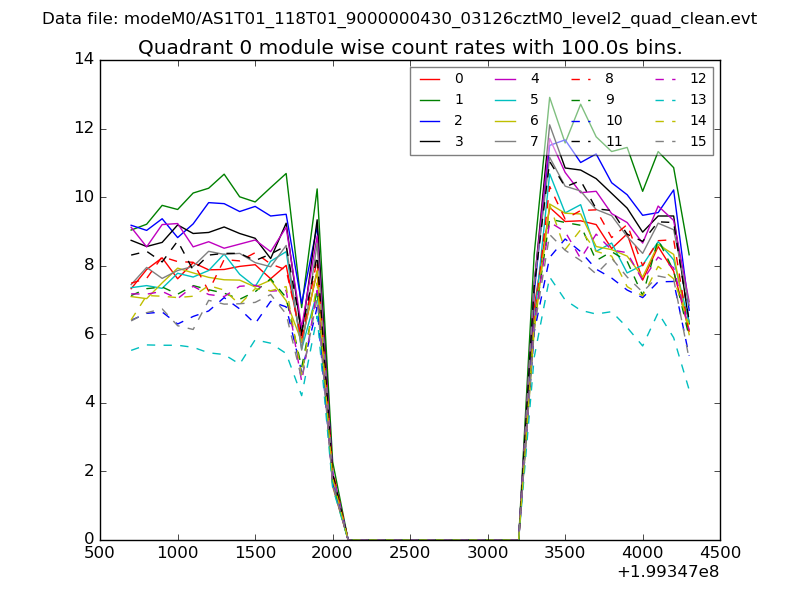 |
 |
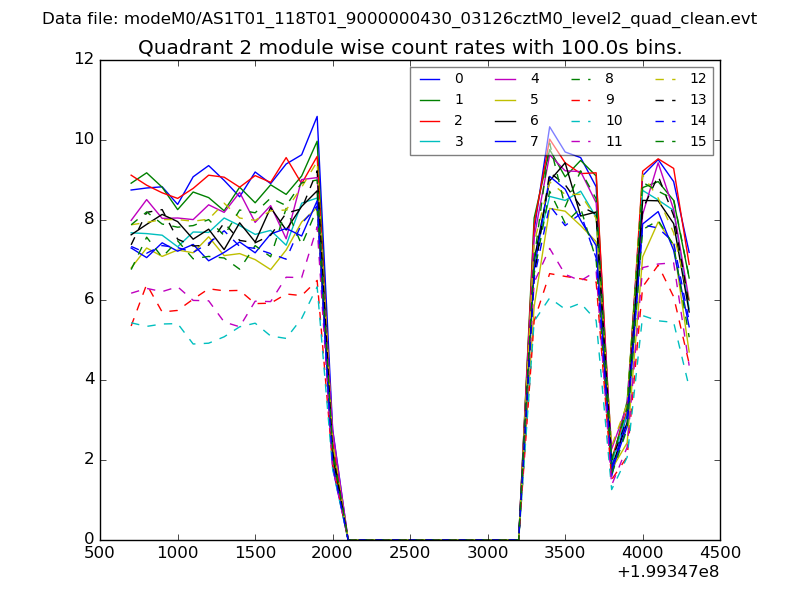
| Module-wise count rates for Quadrant B Data is divided into 100 sec bins |
 |
 |
| Module-wise count rates for Quadrant C Data is divided into 100 sec bins |
 |
 |
| Module-wise count rates for Quadrant D Data is divided into 100 sec bins |
 |
 |
| Parameter | Plot |
|---|---|
| CZT HV Monitor | 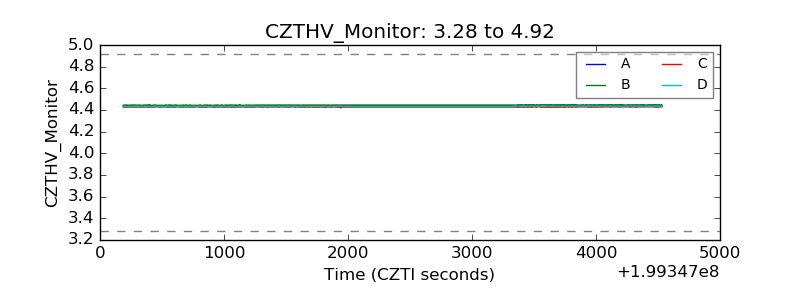 |
| D_VDD | 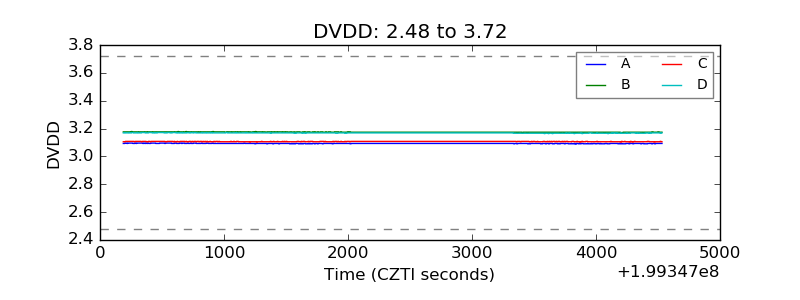 |
| Temperature 1 | 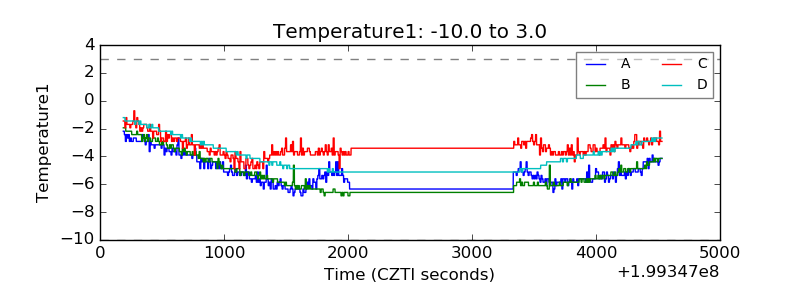 |
| Veto HV Monitor | 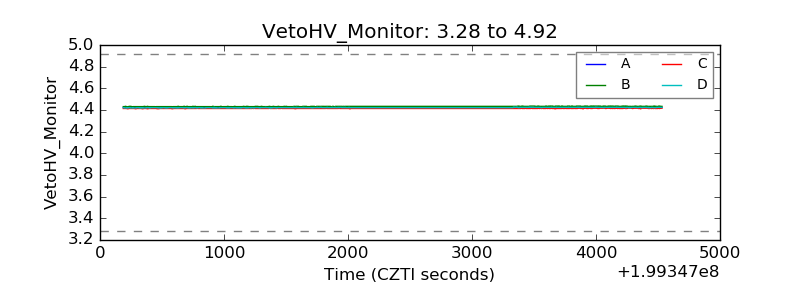 |
| Veto LLD | 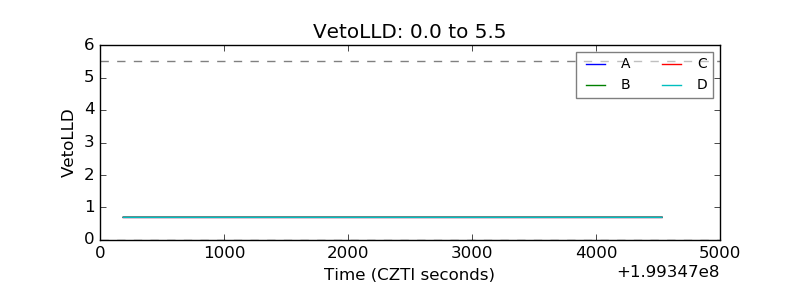 |
| Alpha Counter | 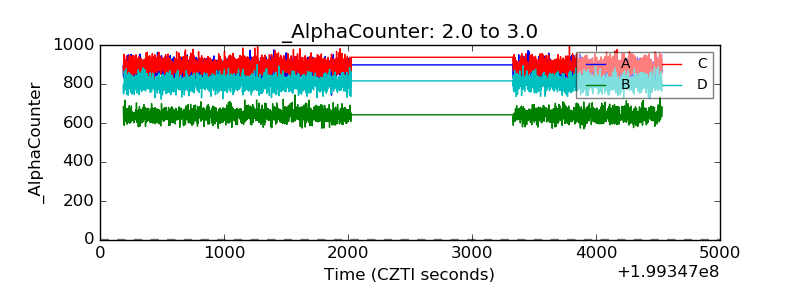 |
| _CPM_Rate | 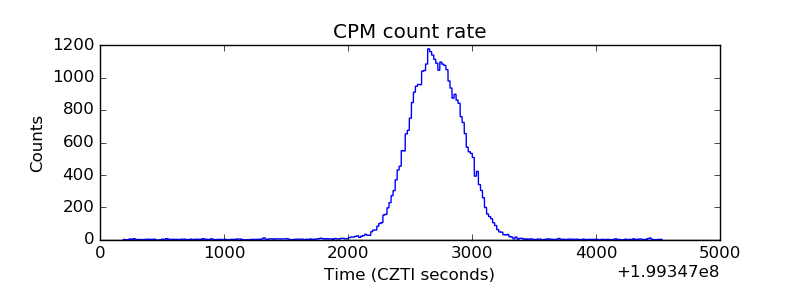 |
| CZT Counter | 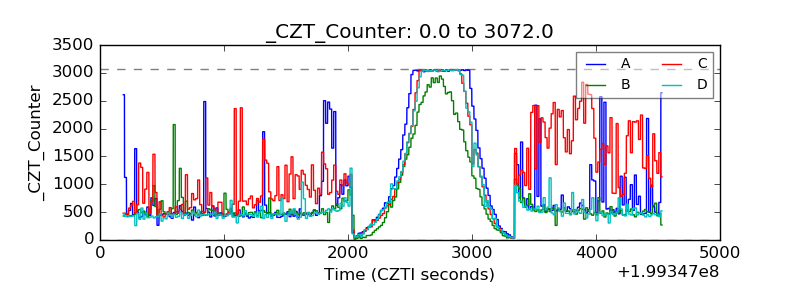 |
| +2.5 Volts monitor |  |
| +5 Volts monitor |  |
| _ROLL_ROT | 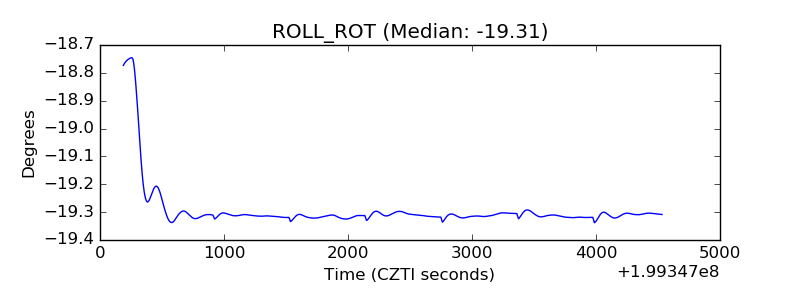 |
| _Roll_DEC | 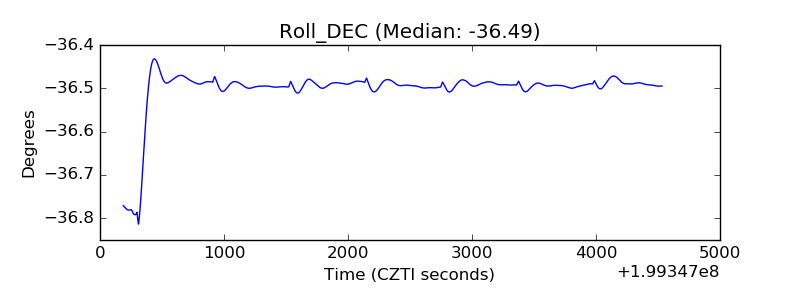 |
| _Roll_RA | 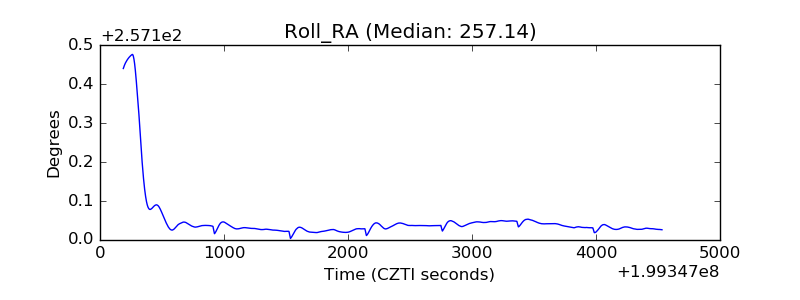 |
| Veto Counter | 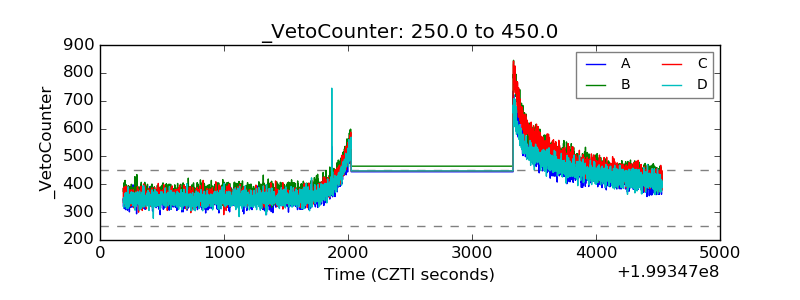 |