| Param | Original file | Final file |
|---|---|---|
| Filename | modeM0/AS1T01_118T01_9000000430_03127cztM0_level2.evt | modeM0/AS1T01_118T01_9000000430_03127cztM0_level2_quad_clean.evt |
| Size (bytes) | 695,937,600 | 65,352,960 |
| Size | 663.7 MB | 62.3 MB |
| Events in quadrant A | 4,753,155 | 381,745 |
| Events in quadrant B | 2,952,504 | 433,301 |
| Events in quadrant C | 9,408,109 | 341,380 |
| Events in quadrant D | 3,557,914 | 402,913 |
| Mode SS | |||
|---|---|---|---|
| Quadrant | BADHDUFLAG | Total packets | Discarded packets |
| A | 0 | 122 | 0 |
| B | 0 | 122 | 0 |
| C | 0 | 122 | 0 |
| D | 0 | 122 | 0 |
| Mode M0 | |||
|---|---|---|---|
| Quadrant | BADHDUFLAG | Total packets | Discarded packets |
| A | 0 | 17984 | 2 |
| B | 0 | 12492 | 1 |
| C | 0 | 32073 | 1 |
| D | 0 | 14500 | 1 |
| Mode M9 | |||
|---|---|---|---|
| Quadrant | BADHDUFLAG | Total packets | Discarded packets |
| A | 0 | 12 | 0 |
| B | 0 | 12 | 0 |
| C | 0 | 12 | 0 |
| D | 0 | 12 | 0 |
| Quadrant | Total seconds | Saturated seconds | Saturation percentage |
|---|---|---|---|
| A | 5993 | 743 | 12.397797% |
| B | 5993 | 103 | 1.718672% |
| C | 5993 | 1756 | 29.300851% |
| D | 5993 | 222 | 3.704322% |
Noise dominated data is calculated using 1-second bins in cleaned event files. If a bin has >2000 counts, and if more than 50% of those come from <1% of pixels, then it is considered to be noise-dominated and hence unusable.
| Quadrant | # 1 sec bins | Bins with >0 counts | Bins with >2000 counts | High rate bins dominated by noise | Noise dominated (total time) | Noise dominated (detector-on time) | Marked lightcurve |
|---|---|---|---|---|---|---|---|
| A | 7203 | 5993 | 538 | 538 | 7.47% | 8.98% | 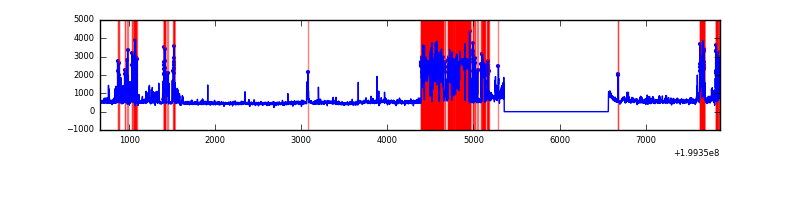 |
| B | 7203 | 5993 | 1 | 1 | 0.01% | 0.02% | 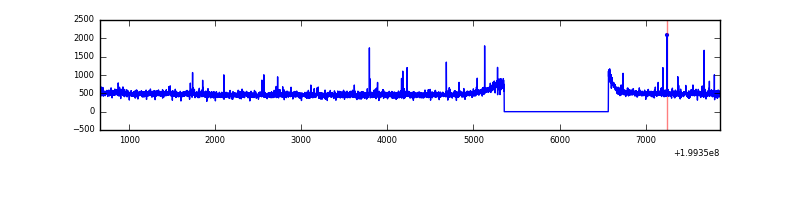 |
| C | 7202 | 5992 | 1614 | 1614 | 22.41% | 26.94% | 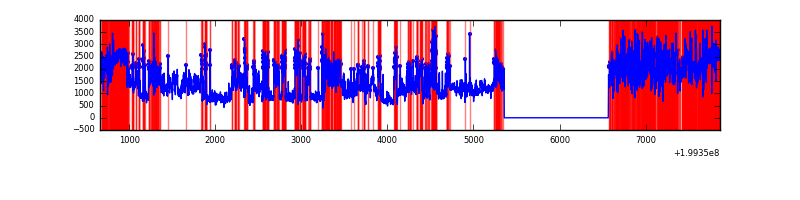 |
| D | 7203 | 5993 | 123 | 123 | 1.71% | 2.05% | 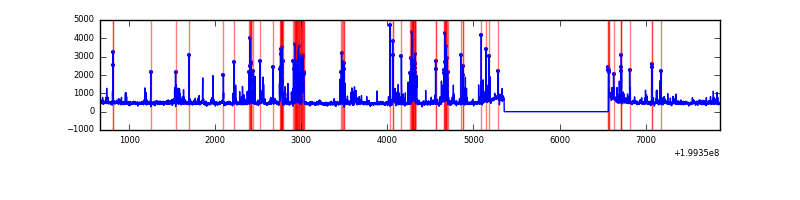 |
Top three noisy pixels from each quadrant. If the there are fewer than three noisy pixels in the level2.evt file, extra rows are filled as -1
| Pixel properties | Quadrant properties | ||||||
|---|---|---|---|---|---|---|---|
| Quadrant | DetID | PixID | Counts | Sigma | Mean | Median | Sigma |
| A | 12 | 247 | 1481085 | 10443.74 | 696 | 680 | 141.8 |
| A | 0 | 13 | 295004 | 2076.35 | 696 | 680 | 141.8 |
| A | 8 | 15 | 259141 | 1823.35 | 696 | 680 | 141.8 |
| B | 4 | 81 | 31932 | 221.34 | 741 | 724 | 141.0 |
| B | 15 | 204 | 12650 | 84.58 | 741 | 724 | 141.0 |
| B | 2 | 249 | 10865 | 71.92 | 741 | 724 | 141.0 |
| C | 0 | 219 | 6396408 | 44220.94 | 623 | 626 | 144.6 |
| C | 0 | 235 | 439060 | 3031.37 | 623 | 626 | 144.6 |
| C | 6 | 80 | 41198 | 280.52 | 623 | 626 | 144.6 |
| D | 13 | 223 | 361835 | 1953.64 | 702 | 688 | 184.9 |
| D | 12 | 233 | 230941 | 1245.56 | 702 | 688 | 184.9 |
| D | 13 | 114 | 75312 | 403.68 | 702 | 688 | 184.9 |
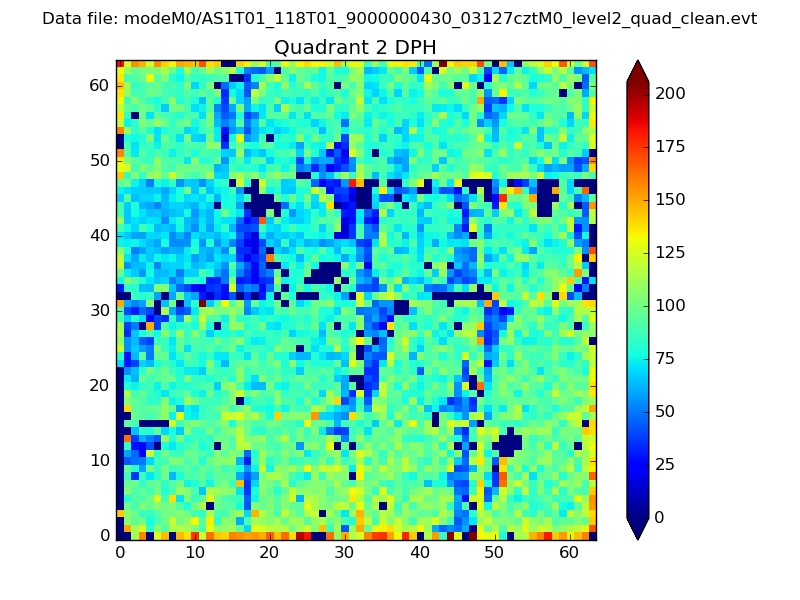
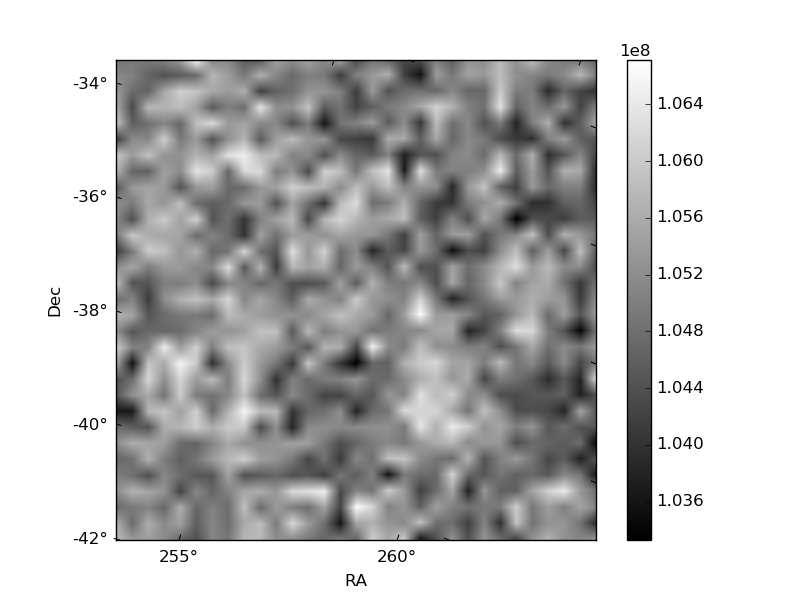
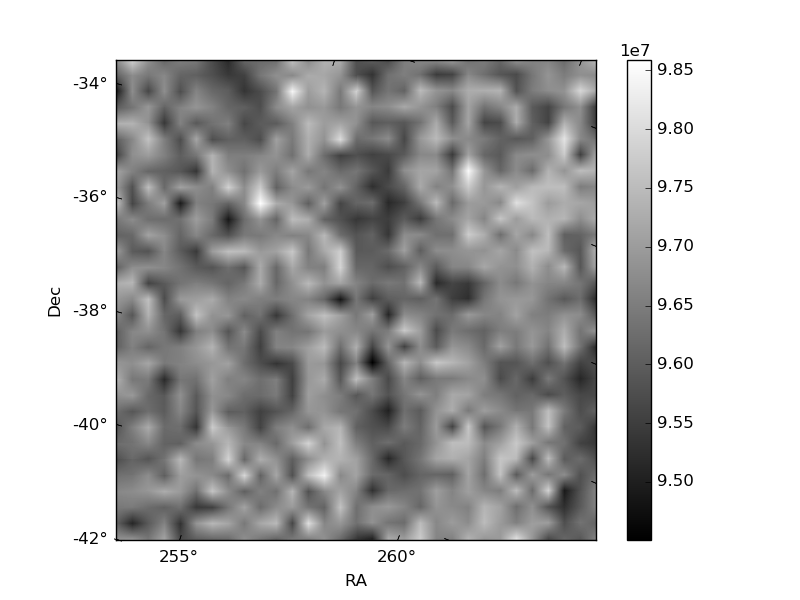
Histogram calculated using DETX and DETY for each event in the final _common_clean file
| Quadrant A | 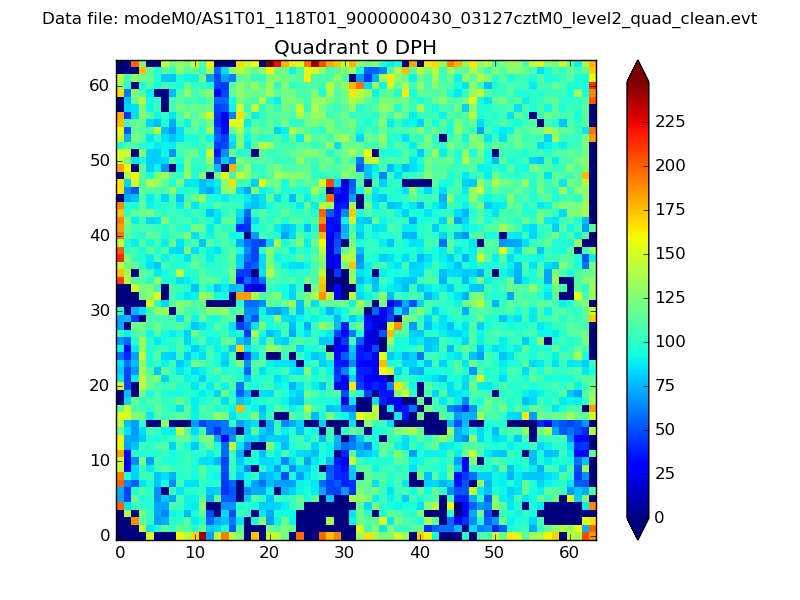 |
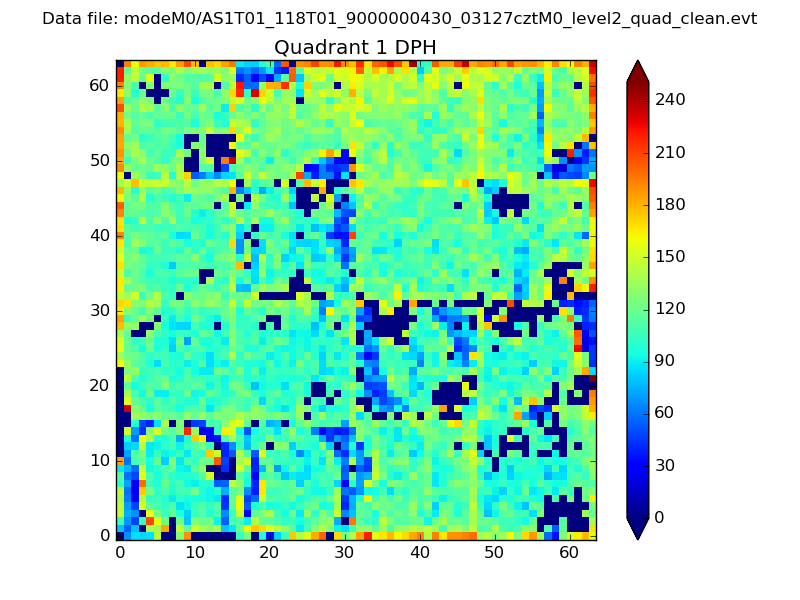 |
Quadrant B |
|---|---|---|---|
| Quadrant D | 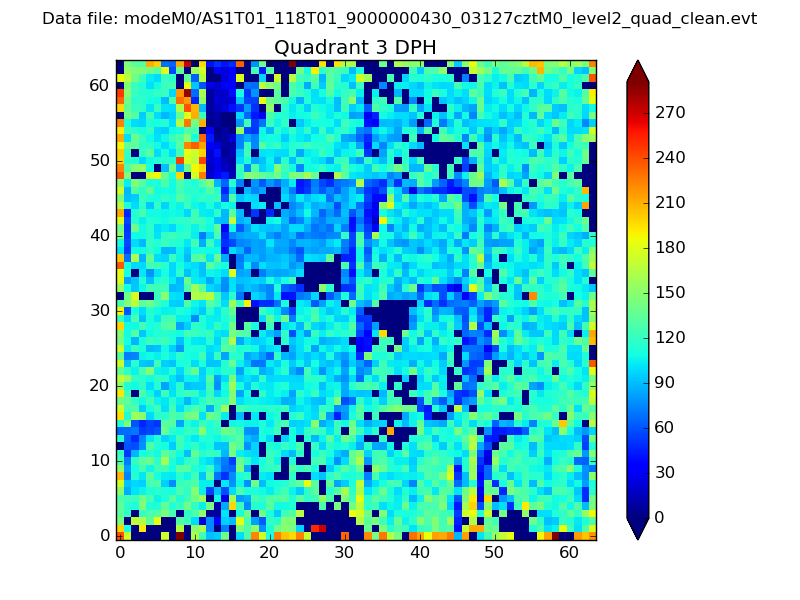 |
 |
Quadrant C |
| Plot type | Count rate plots | Images |
|---|---|---|
| Comparison with Poisson distribution Blue bars denote a histogram of data divided into 1 sec bins. Red curve is a Poisson curve with rate = median count rate of data. |
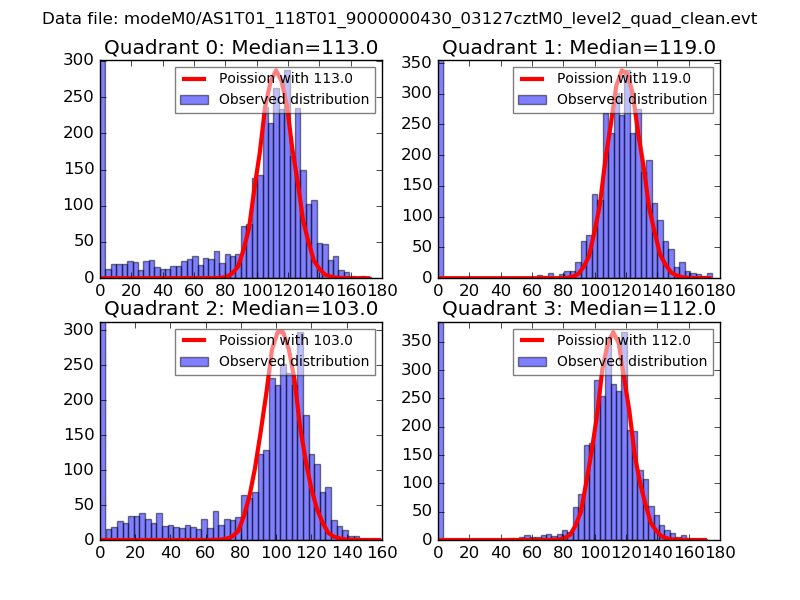 |
 |
| Quadrant-wise count rates Data is divided into 100 sec bins |
 |
|
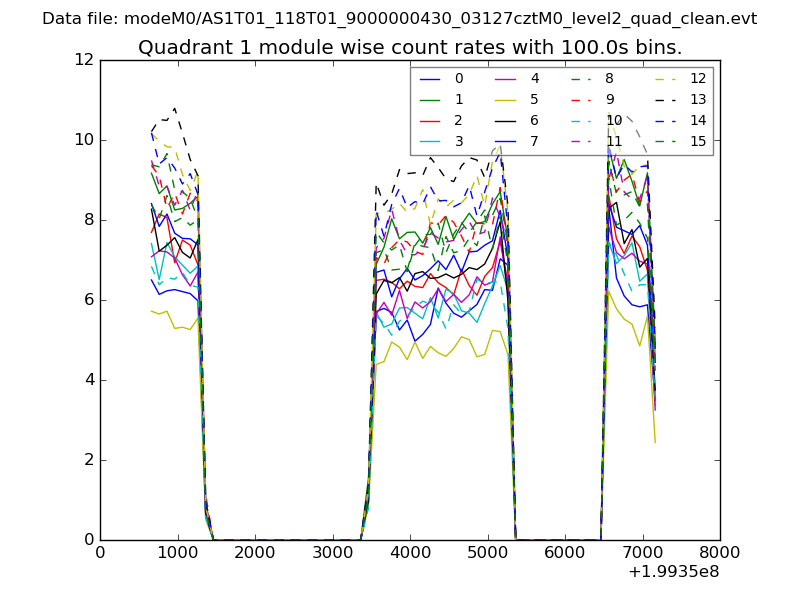
| Module-wise count rates for Quadrant A Data is divided into 100 sec bins |
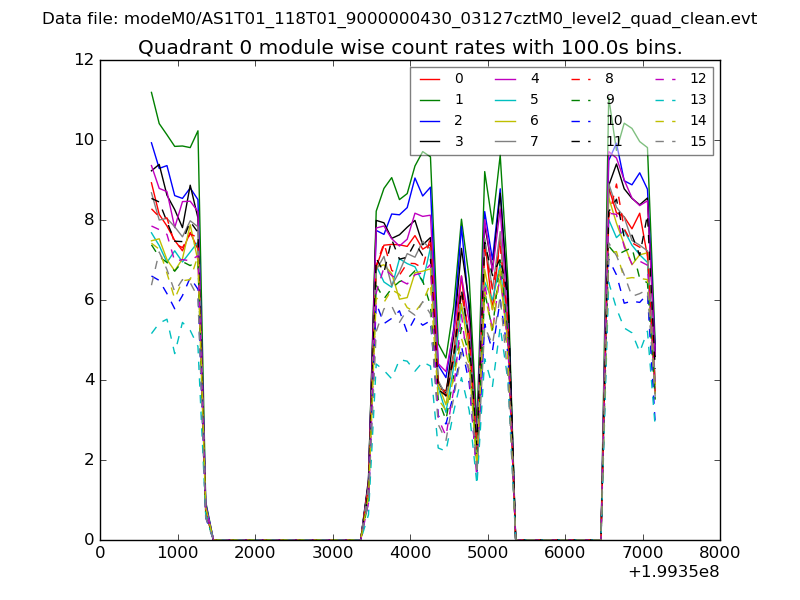 |
 |
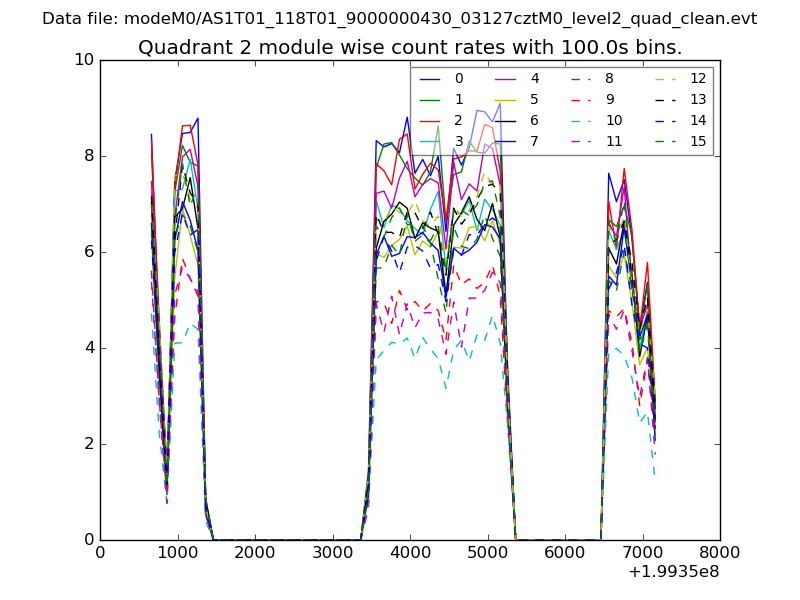
| Module-wise count rates for Quadrant B Data is divided into 100 sec bins |
 |
 |
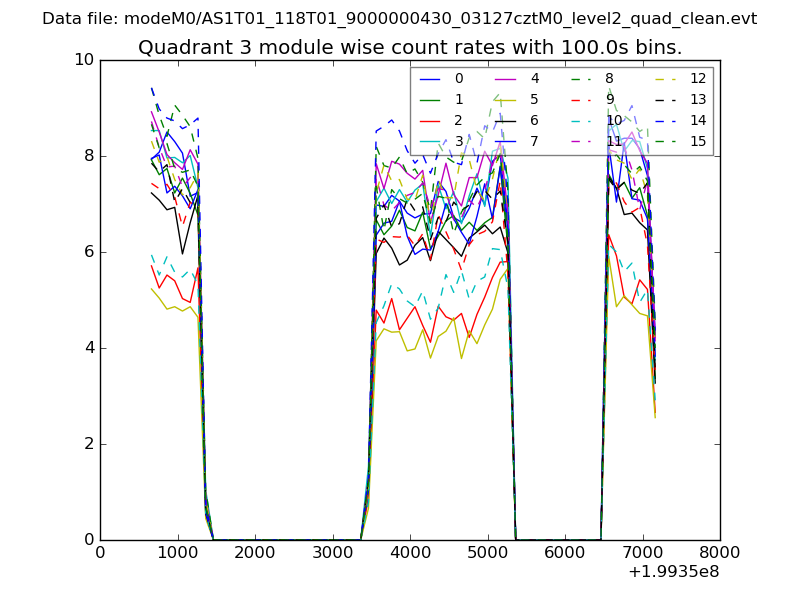
| Module-wise count rates for Quadrant C Data is divided into 100 sec bins |
 |
 |
| Module-wise count rates for Quadrant D Data is divided into 100 sec bins |
 |
 |
| Parameter | Plot |
|---|---|
| CZT HV Monitor | 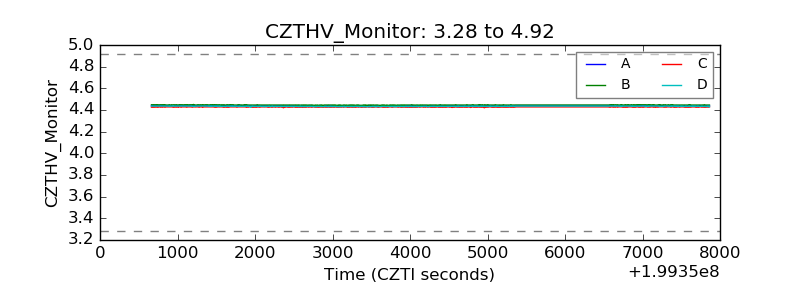 |
| D_VDD | 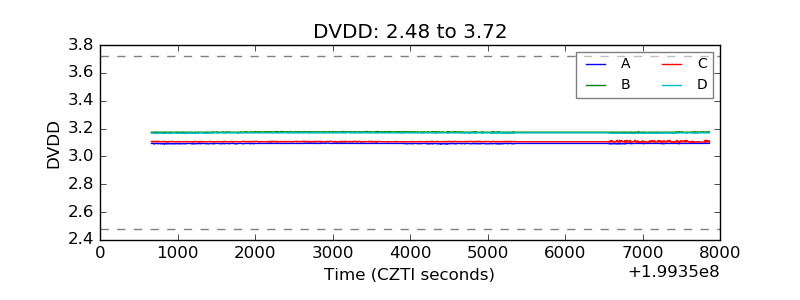 |
| Temperature 1 |  |
| Veto HV Monitor | 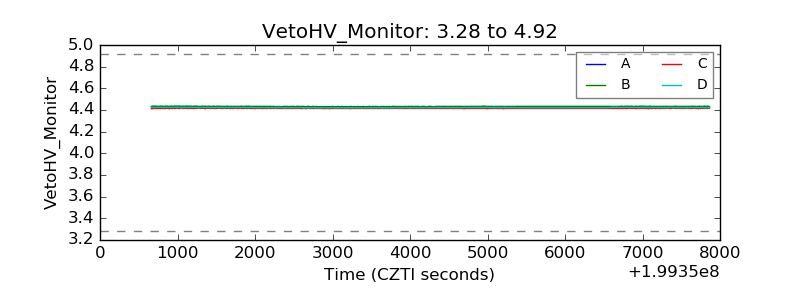 |
| Veto LLD | 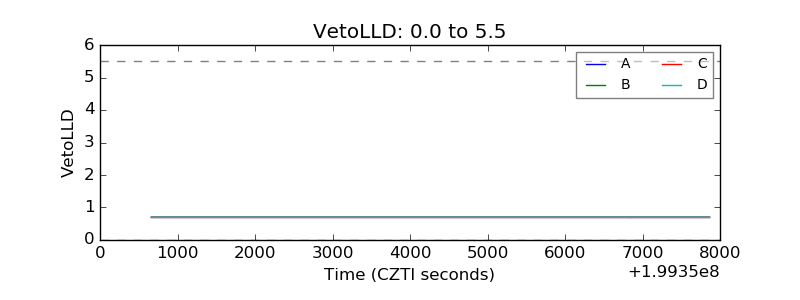 |
| Alpha Counter | 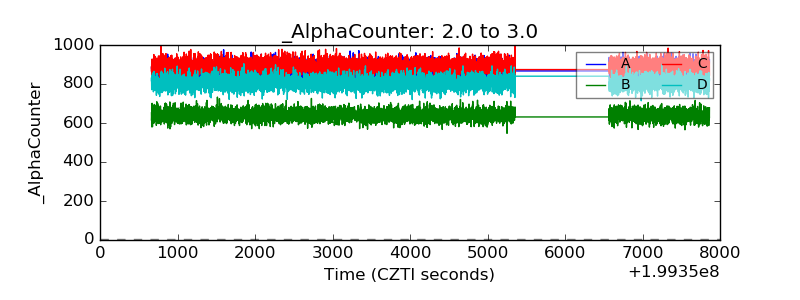 |
| _CPM_Rate | 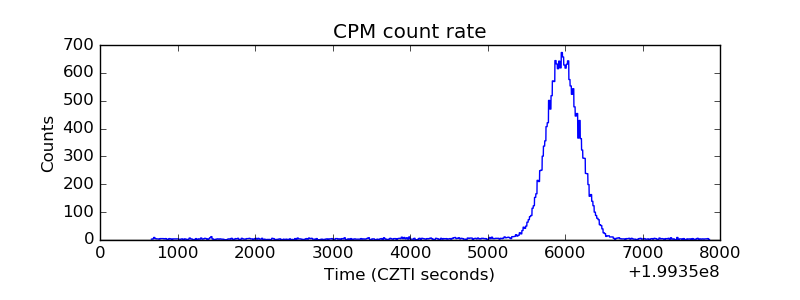 |
| CZT Counter | 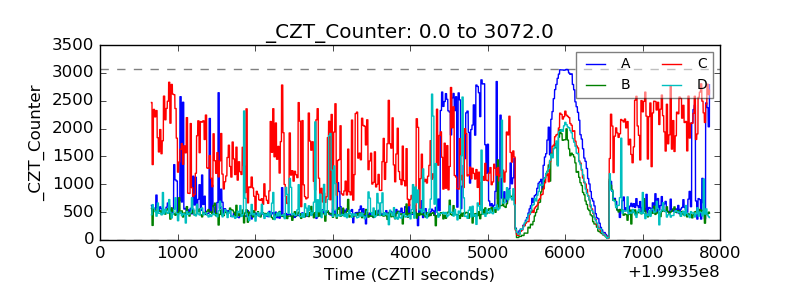 |
| +2.5 Volts monitor | 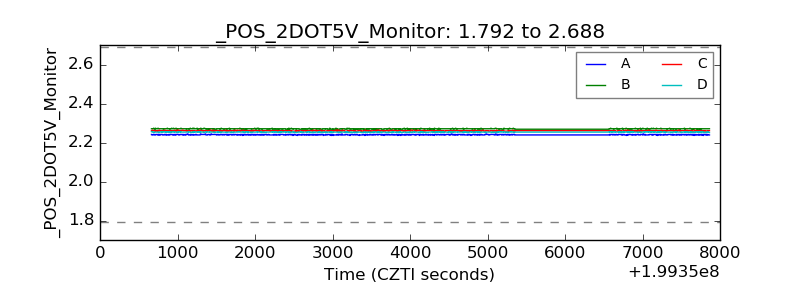 |
| +5 Volts monitor | 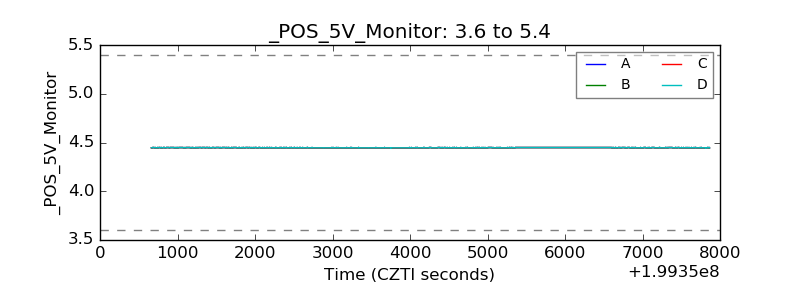 |
| _ROLL_ROT | 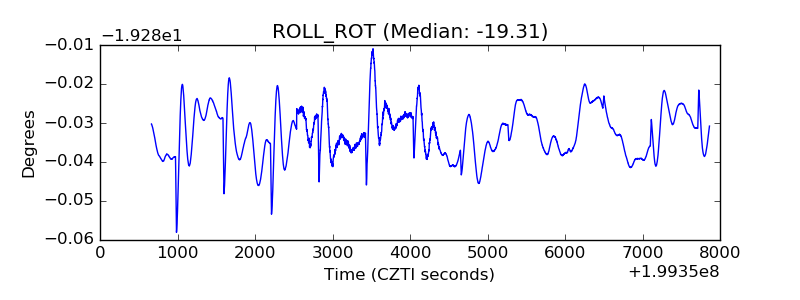 |
| _Roll_DEC | 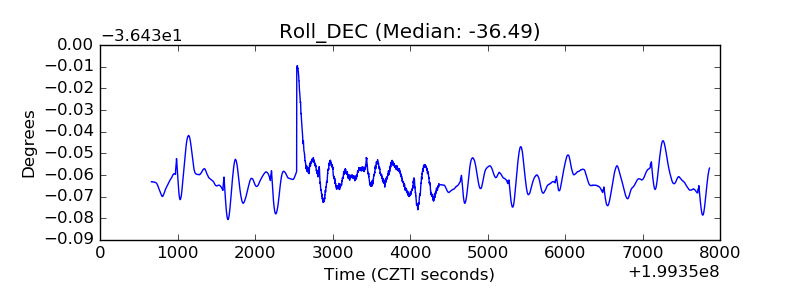 |
| _Roll_RA | 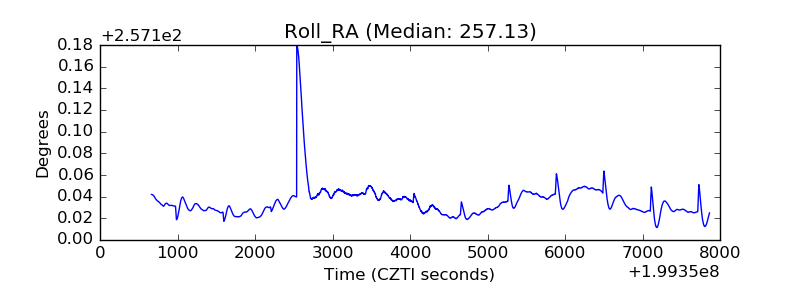 |
| Veto Counter | 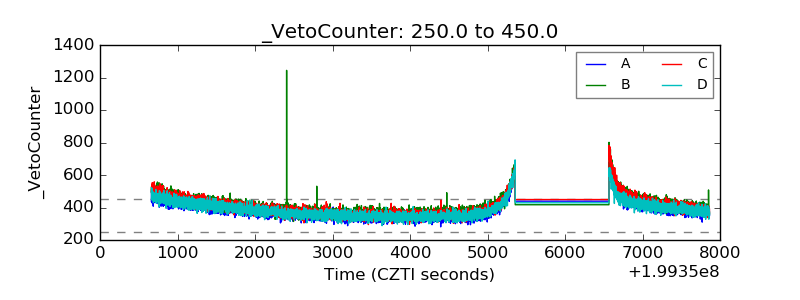 |