| Param | Original file | Final file |
|---|---|---|
| Filename | modeM0/AS1T01_118T01_9000000430_03129cztM0_level2.evt | modeM0/AS1T01_118T01_9000000430_03129cztM0_level2_quad_clean.evt |
| Size (bytes) | 928,123,200 | 61,355,520 |
| Size | 885.1 MB | 58.5 MB |
| Events in quadrant A | 4,599,987 | 394,766 |
| Events in quadrant B | 3,590,570 | 407,085 |
| Events in quadrant C | 15,084,974 | 180,877 |
| Events in quadrant D | 4,344,797 | 370,777 |
| Mode SS | |||
|---|---|---|---|
| Quadrant | BADHDUFLAG | Total packets | Discarded packets |
| A | 0 | 144 | 0 |
| B | 0 | 144 | 0 |
| C | 0 | 144 | 0 |
| D | 0 | 144 | 0 |
| Mode M0 | |||
|---|---|---|---|
| Quadrant | BADHDUFLAG | Total packets | Discarded packets |
| A | 0 | 18648 | 2 |
| B | 0 | 15434 | 1 |
| C | 0 | 49723 | 1 |
| D | 0 | 18045 | 1 |
| Mode M9 | |||
|---|---|---|---|
| Quadrant | BADHDUFLAG | Total packets | Discarded packets |
| A | 0 | 8 | 0 |
| B | 0 | 8 | 0 |
| C | 0 | 8 | 0 |
| D | 0 | 8 | 0 |
| Quadrant | Total seconds | Saturated seconds | Saturation percentage |
|---|---|---|---|
| A | 7227 | 555 | 7.679535% |
| B | 7227 | 159 | 2.200083% |
| C | 7227 | 5315 | 73.543656% |
| D | 7227 | 321 | 4.441677% |
Noise dominated data is calculated using 1-second bins in cleaned event files. If a bin has >2000 counts, and if more than 50% of those come from <1% of pixels, then it is considered to be noise-dominated and hence unusable.
| Quadrant | # 1 sec bins | Bins with >0 counts | Bins with >2000 counts | High rate bins dominated by noise | Noise dominated (total time) | Noise dominated (detector-on time) | Marked lightcurve |
|---|---|---|---|---|---|---|---|
| A | 7957 | 7228 | 318 | 318 | 4.00% | 4.40% | 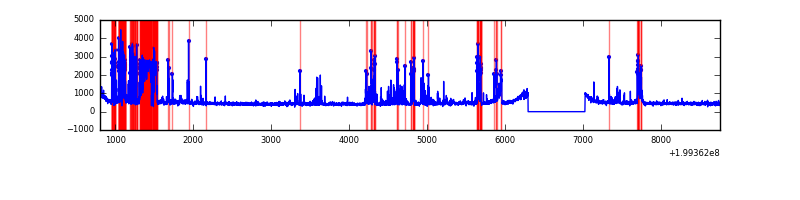 |
| B | 7957 | 7228 | 11 | 11 | 0.14% | 0.15% | 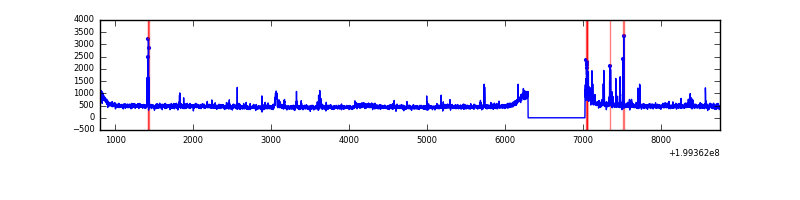 |
| C | 7957 | 7227 | 4283 | 4283 | 53.83% | 59.26% | 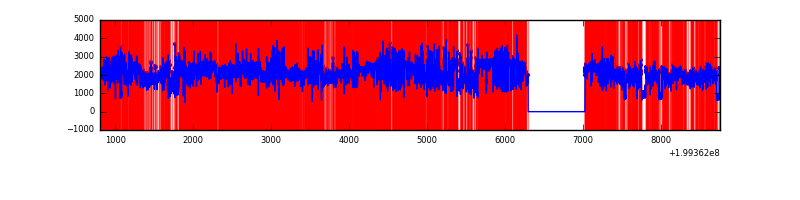 |
| D | 7957 | 7228 | 239 | 239 | 3.00% | 3.31% | 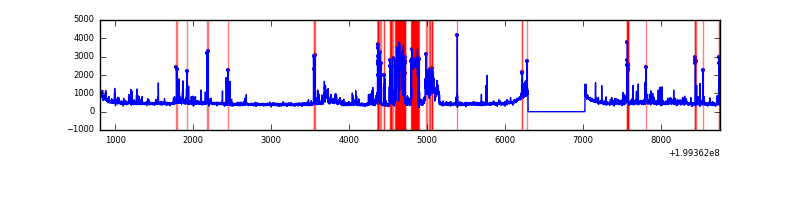 |
Top three noisy pixels from each quadrant. If the there are fewer than three noisy pixels in the level2.evt file, extra rows are filled as -1
| Pixel properties | Quadrant properties | ||||||
|---|---|---|---|---|---|---|---|
| Quadrant | DetID | PixID | Counts | Sigma | Mean | Median | Sigma |
| A | 12 | 247 | 1274342 | 7532.27 | 825 | 805 | 169.1 |
| A | 0 | 13 | 64904 | 379.11 | 825 | 805 | 169.1 |
| A | 14 | 238 | 33825 | 195.3 | 825 | 805 | 169.1 |
| B | 4 | 81 | 59139 | 348.72 | 861 | 842 | 167.2 |
| B | 5 | 70 | 38545 | 225.53 | 861 | 842 | 167.2 |
| B | 15 | 204 | 34847 | 203.41 | 861 | 842 | 167.2 |
| C | 0 | 219 | 12968483 | 116909.28 | 474 | 475 | 110.9 |
| C | 0 | 235 | 171227 | 1539.36 | 474 | 475 | 110.9 |
| C | 14 | 223 | 54669 | 488.57 | 474 | 475 | 110.9 |
| D | 12 | 233 | 650175 | 3247.96 | 815 | 790 | 199.9 |
| D | 13 | 200 | 126752 | 630.01 | 815 | 790 | 199.9 |
| D | 13 | 223 | 95463 | 473.52 | 815 | 790 | 199.9 |
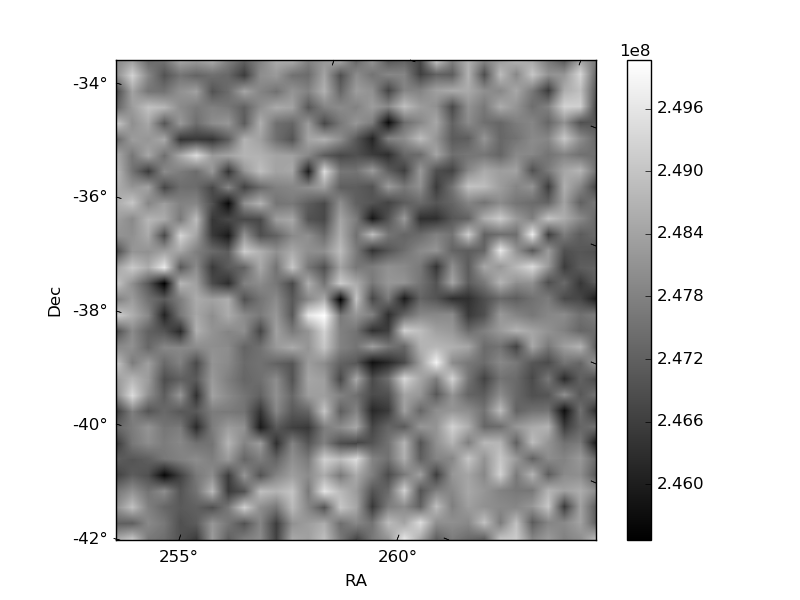
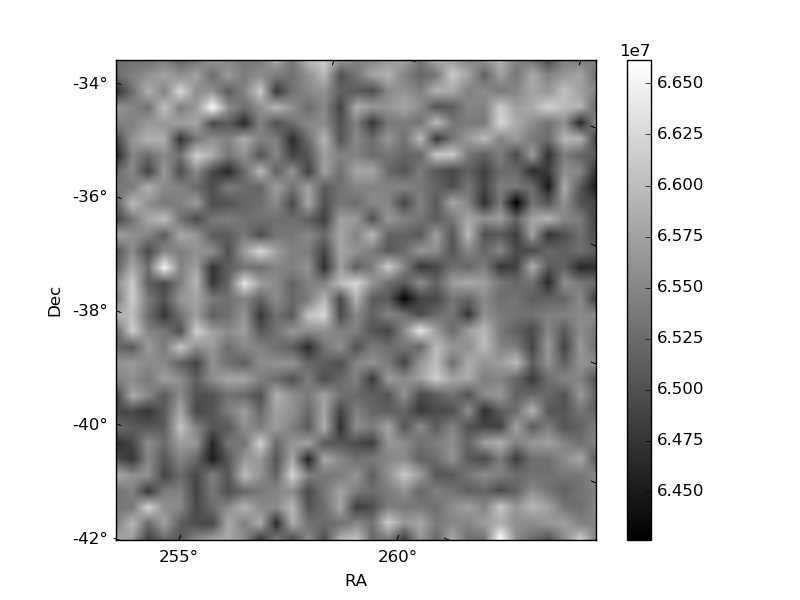
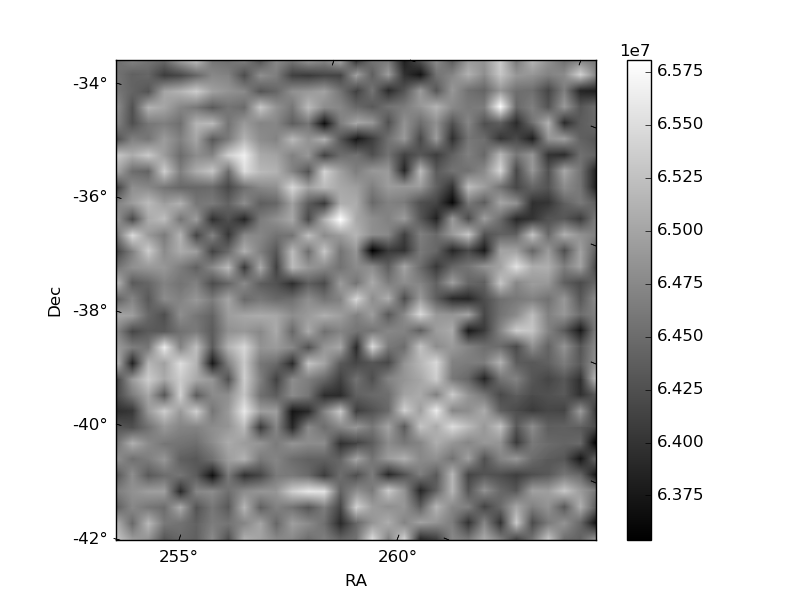
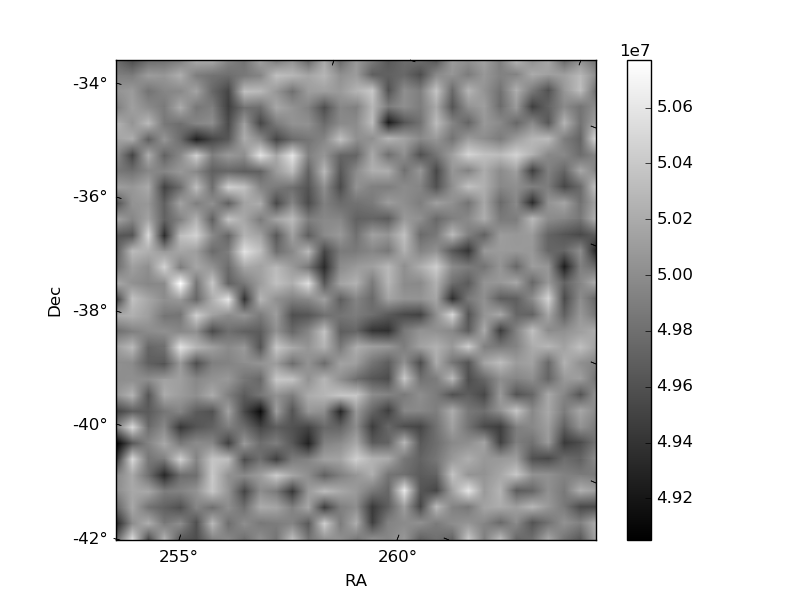
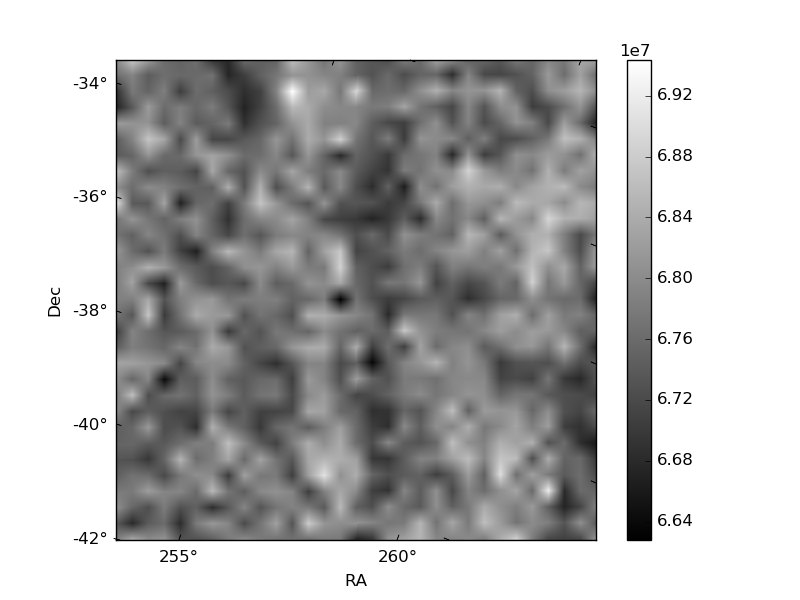
Histogram calculated using DETX and DETY for each event in the final _common_clean file
| Quadrant A | 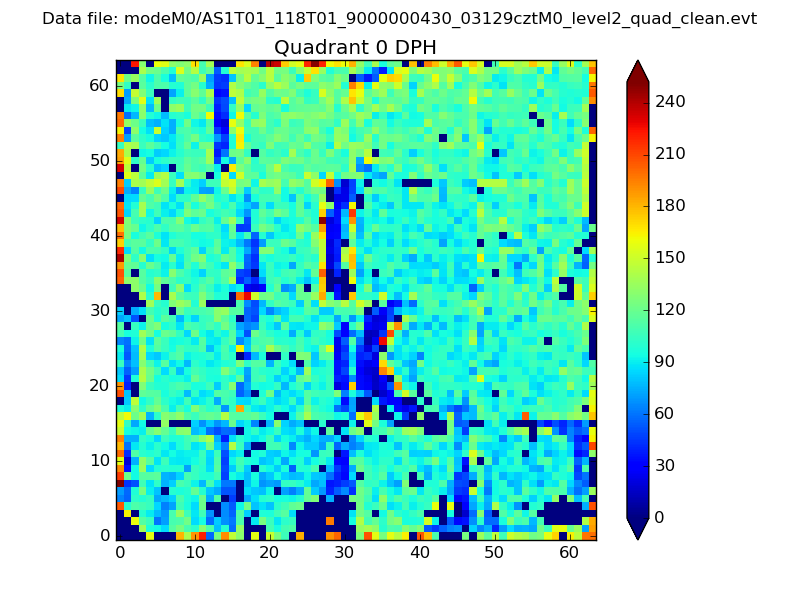 |
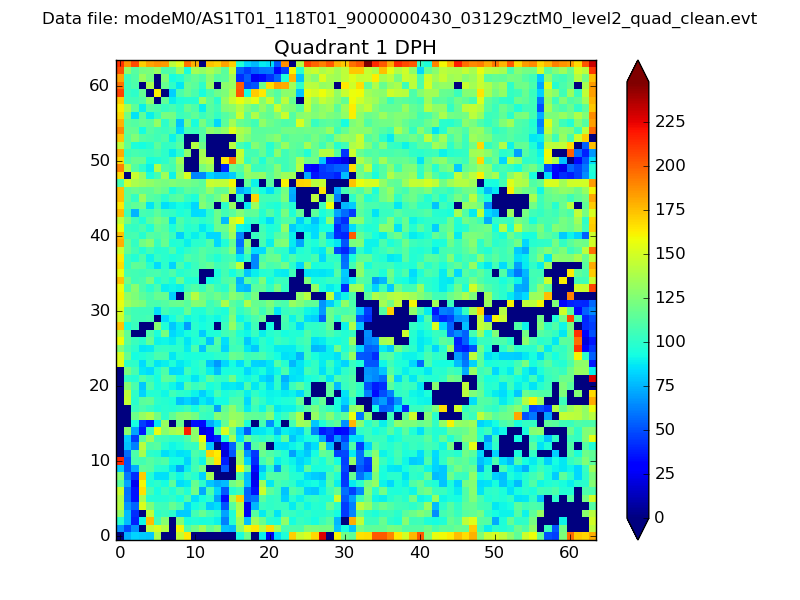 |
Quadrant B |
|---|---|---|---|
| Quadrant D | 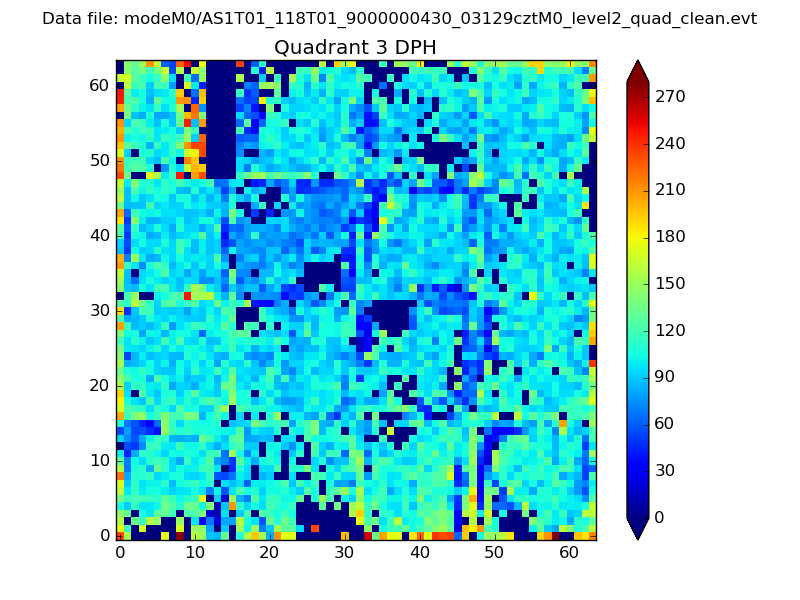 |
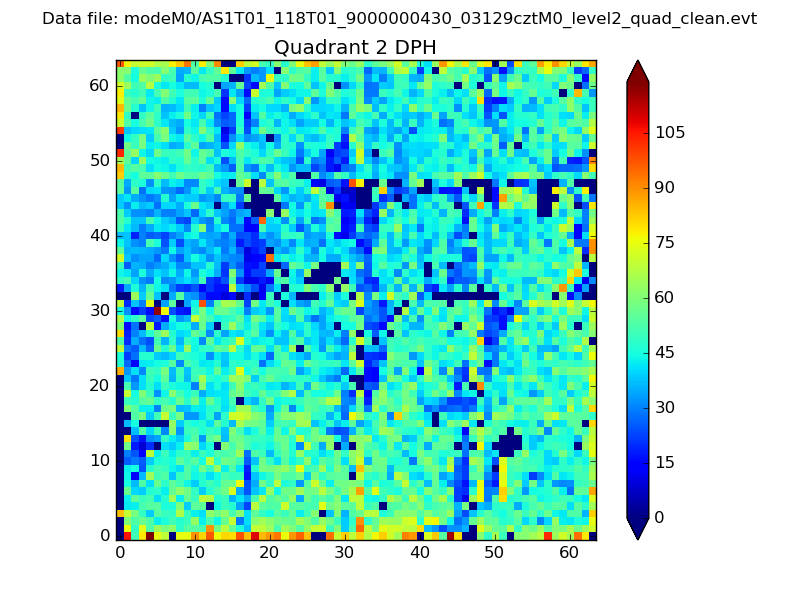 |
Quadrant C |
| Plot type | Count rate plots | Images |
|---|---|---|
| Comparison with Poisson distribution Blue bars denote a histogram of data divided into 1 sec bins. Red curve is a Poisson curve with rate = median count rate of data. |
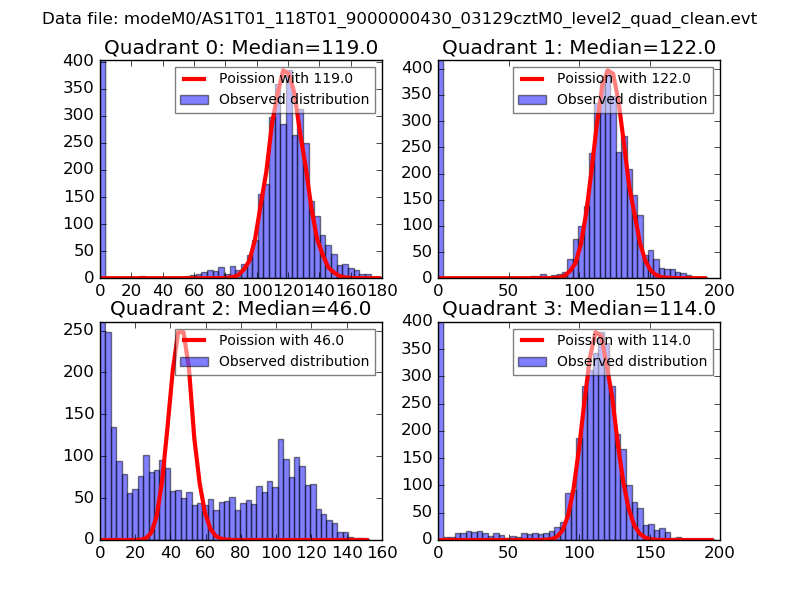 |
 |
| Quadrant-wise count rates Data is divided into 100 sec bins |
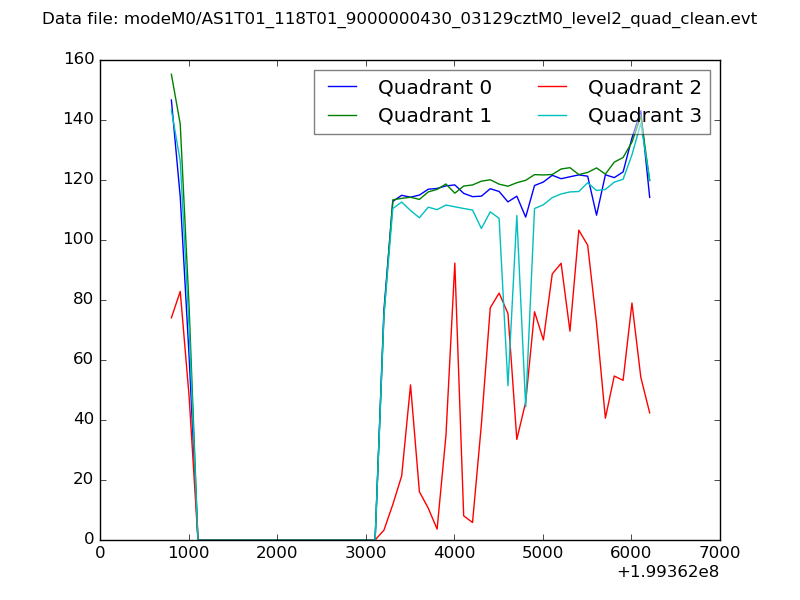 |
|
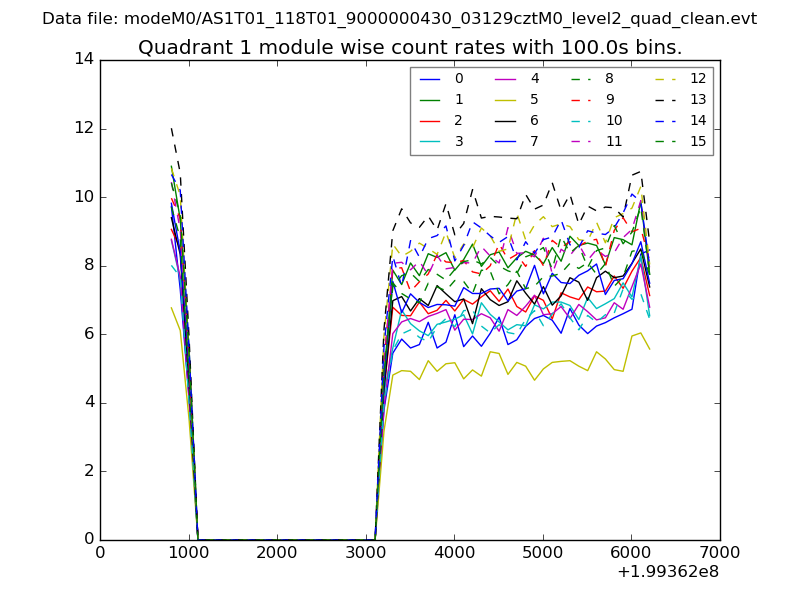
| Module-wise count rates for Quadrant A Data is divided into 100 sec bins |
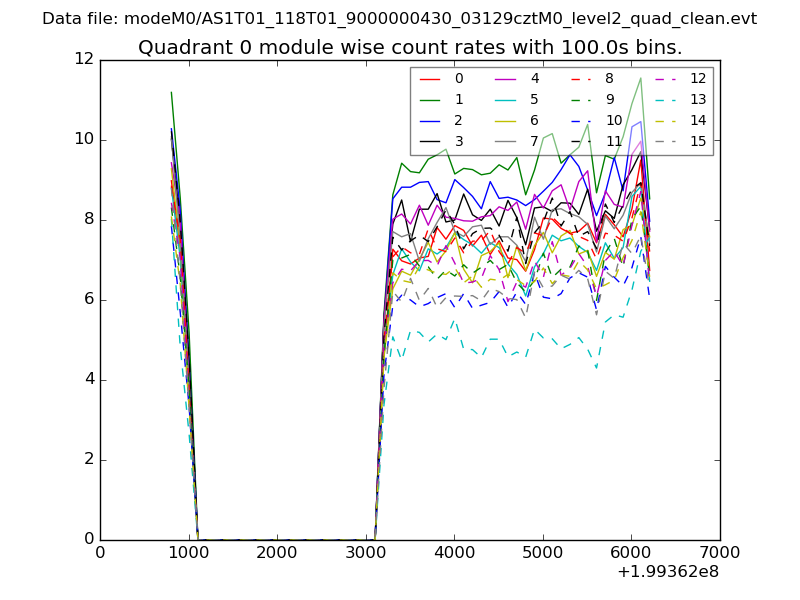 |
 |
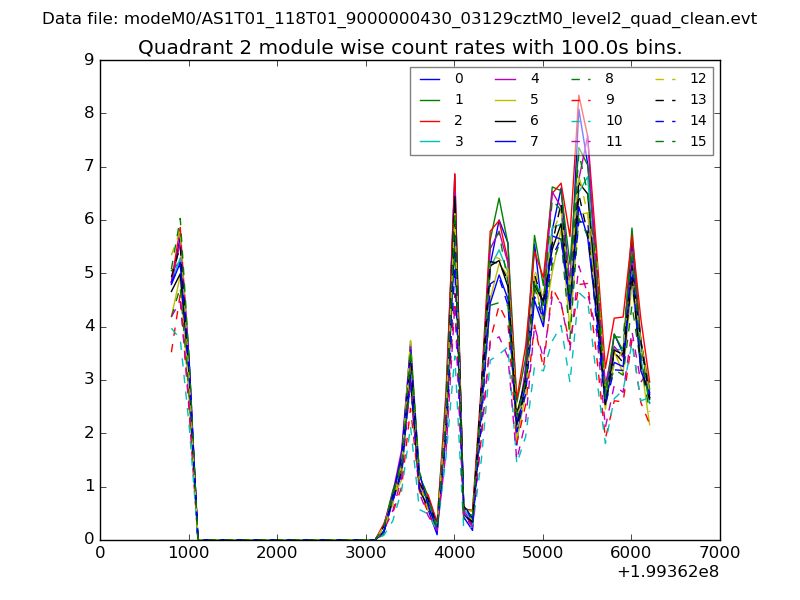
| Module-wise count rates for Quadrant B Data is divided into 100 sec bins |
 |
 |
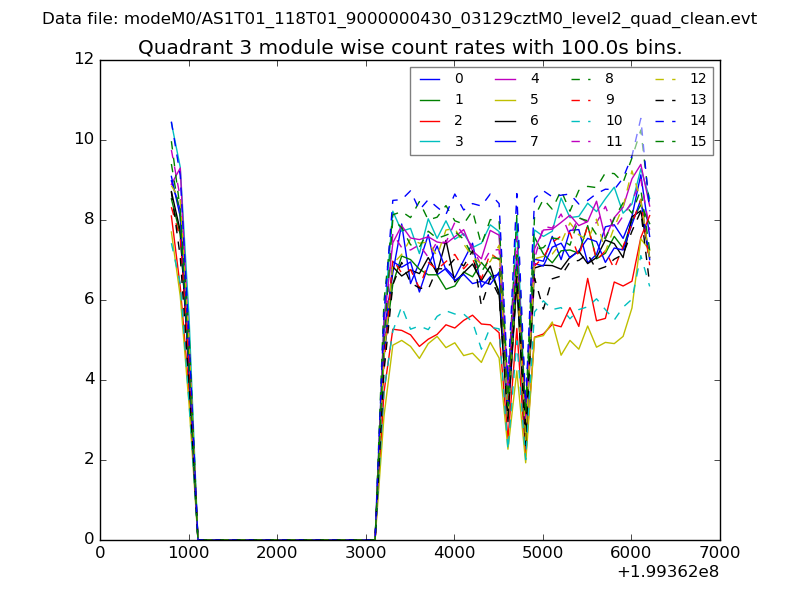
| Module-wise count rates for Quadrant C Data is divided into 100 sec bins |
 |
 |
| Module-wise count rates for Quadrant D Data is divided into 100 sec bins |
 |
 |
| Parameter | Plot |
|---|---|
| CZT HV Monitor | 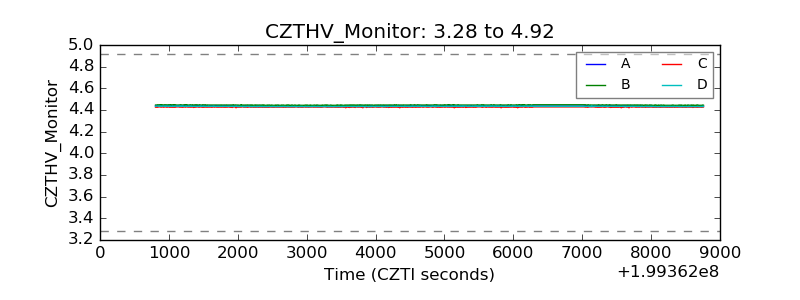 |
| D_VDD | 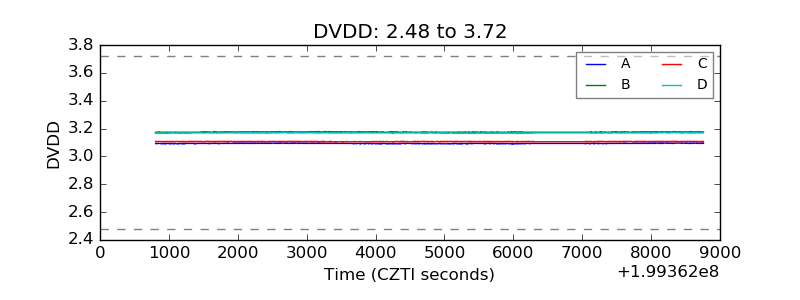 |
| Temperature 1 | 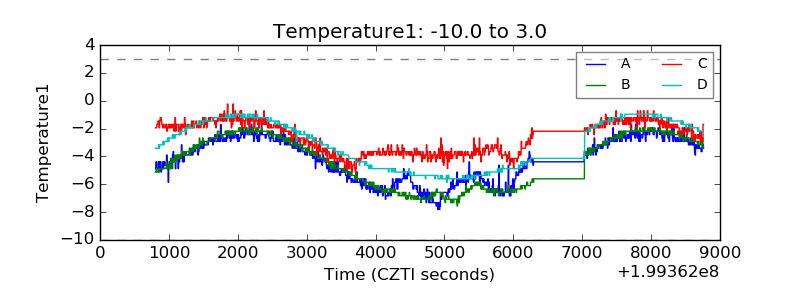 |
| Veto HV Monitor | 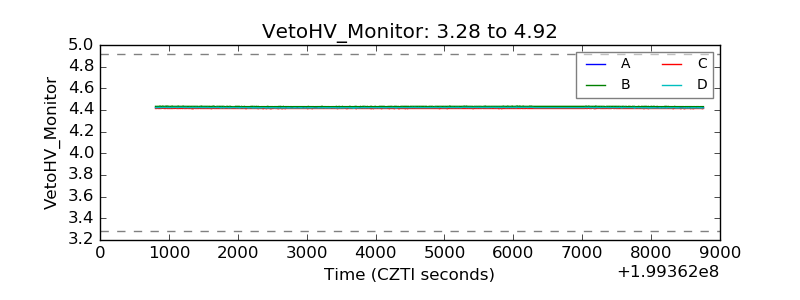 |
| Veto LLD | 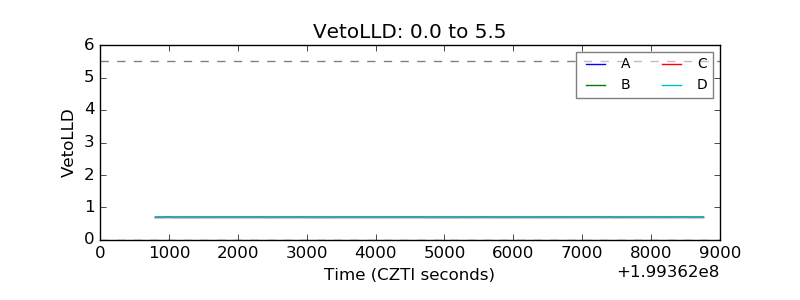 |
| Alpha Counter | 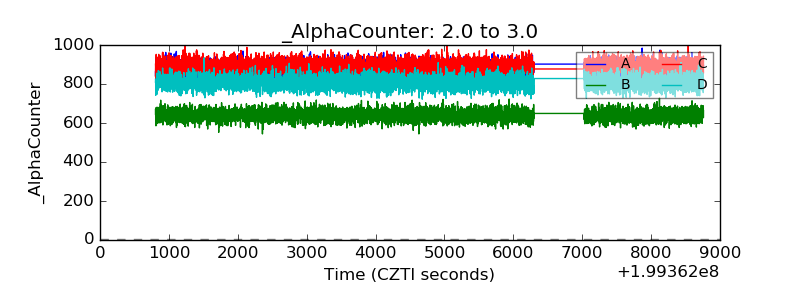 |
| _CPM_Rate | 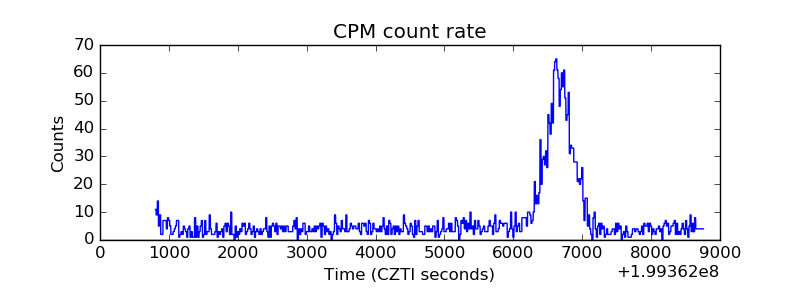 |
| CZT Counter | 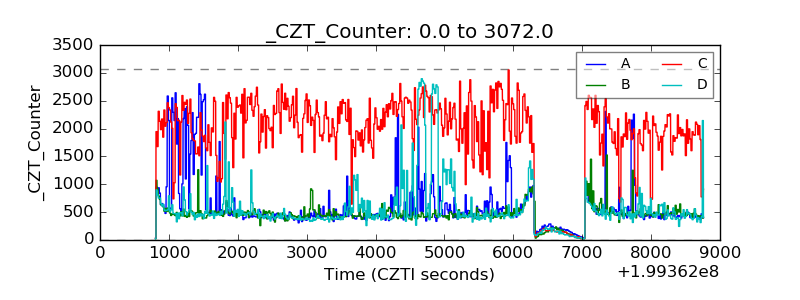 |
| +2.5 Volts monitor | 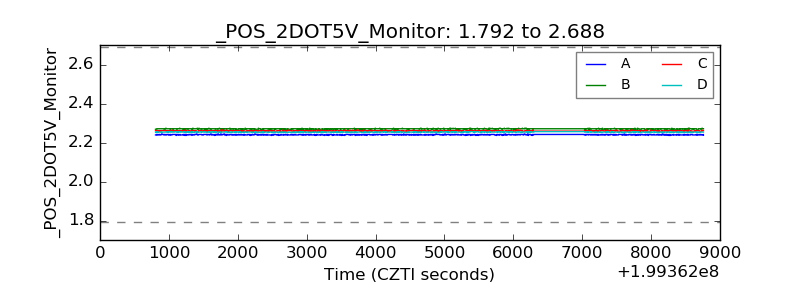 |
| +5 Volts monitor |  |
| _ROLL_ROT | 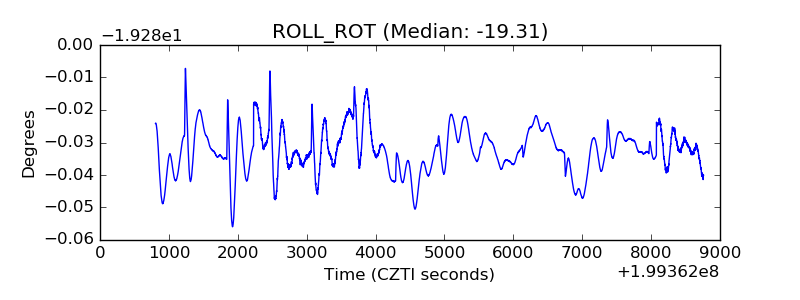 |
| _Roll_DEC | 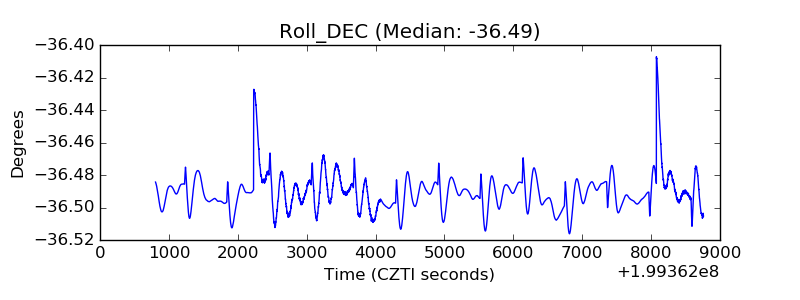 |
| _Roll_RA | 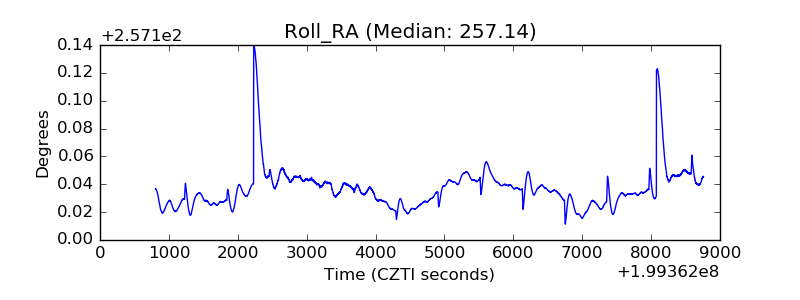 |
| Veto Counter | 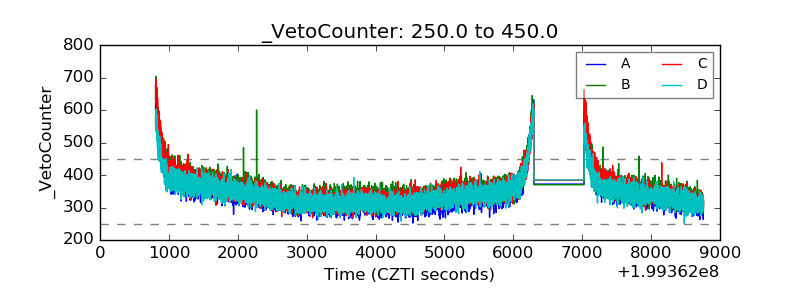 |