| Param | Original file | Final file |
|---|---|---|
| Filename | modeM0/AS1T01_118T01_9000000430_03131cztM0_level2.evt | modeM0/AS1T01_118T01_9000000430_03131cztM0_level2_quad_clean.evt |
| Size (bytes) | 930,905,280 | 76,610,880 |
| Size | 887.8 MB | 73.1 MB |
| Events in quadrant A | 4,527,001 | 457,039 |
| Events in quadrant B | 4,340,549 | 468,204 |
| Events in quadrant C | 13,966,004 | 386,187 |
| Events in quadrant D | 4,807,409 | 439,844 |
| Mode SS | |||
|---|---|---|---|
| Quadrant | BADHDUFLAG | Total packets | Discarded packets |
| A | 0 | 166 | 0 |
| B | 0 | 166 | 0 |
| C | 0 | 166 | 0 |
| D | 0 | 166 | 0 |
| Mode M0 | |||
|---|---|---|---|
| Quadrant | BADHDUFLAG | Total packets | Discarded packets |
| A | 0 | 19119 | 2 |
| B | 0 | 18274 | 1 |
| C | 0 | 47157 | 1 |
| D | 0 | 20040 | 1 |
| Mode M9 | |||
|---|---|---|---|
| Quadrant | BADHDUFLAG | Total packets | Discarded packets |
| A | 0 | 2 | 0 |
| B | 0 | 2 | 0 |
| C | 0 | 2 | 0 |
| D | 0 | 2 | 0 |
| Quadrant | Total seconds | Saturated seconds | Saturation percentage |
|---|---|---|---|
| A | 8168 | 474 | 5.803134% |
| B | 8168 | 408 | 4.995103% |
| C | 8168 | 3439 | 42.103330% |
| D | 8168 | 300 | 3.672870% |
Noise dominated data is calculated using 1-second bins in cleaned event files. If a bin has >2000 counts, and if more than 50% of those come from <1% of pixels, then it is considered to be noise-dominated and hence unusable.
| Quadrant | # 1 sec bins | Bins with >0 counts | Bins with >2000 counts | High rate bins dominated by noise | Noise dominated (total time) | Noise dominated (detector-on time) | Marked lightcurve |
|---|---|---|---|---|---|---|---|
| A | 8398 | 8169 | 119 | 119 | 1.42% | 1.46% |  |
| B | 8398 | 8168 | 26 | 26 | 0.31% | 0.32% | 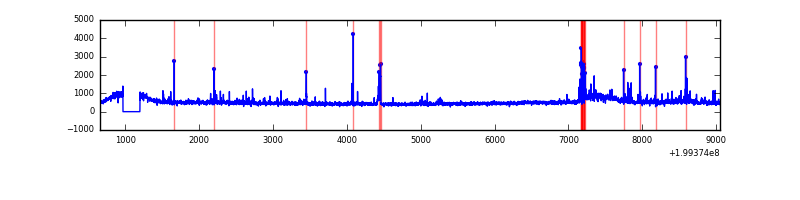 |
| C | 8398 | 8169 | 2734 | 2734 | 32.56% | 33.47% | 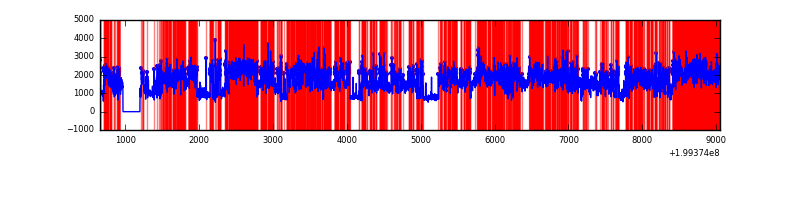 |
| D | 8398 | 8169 | 147 | 147 | 1.75% | 1.80% |  |
Top three noisy pixels from each quadrant. If the there are fewer than three noisy pixels in the level2.evt file, extra rows are filled as -1
| Pixel properties | Quadrant properties | ||||||
|---|---|---|---|---|---|---|---|
| Quadrant | DetID | PixID | Counts | Sigma | Mean | Median | Sigma |
| A | 0 | 50 | 348593 | 1698.59 | 985 | 960 | 204.7 |
| A | 12 | 247 | 208073 | 1011.99 | 985 | 960 | 204.7 |
| A | 0 | 13 | 105807 | 512.3 | 985 | 960 | 204.7 |
| B | 15 | 204 | 199423 | 1001.01 | 1001 | 974 | 198.2 |
| B | 10 | 252 | 62808 | 311.9 | 1001 | 974 | 198.2 |
| B | 2 | 249 | 46407 | 229.17 | 1001 | 974 | 198.2 |
| C | 0 | 219 | 10466835 | 54636.92 | 823 | 824 | 191.6 |
| C | 6 | 80 | 99779 | 516.59 | 823 | 824 | 191.6 |
| C | 14 | 223 | 59846 | 308.12 | 823 | 824 | 191.6 |
| D | 2 | 136 | 203164 | 864.98 | 956 | 925 | 233.8 |
| D | 13 | 223 | 194364 | 827.34 | 956 | 925 | 233.8 |
| D | 12 | 233 | 149845 | 636.93 | 956 | 925 | 233.8 |
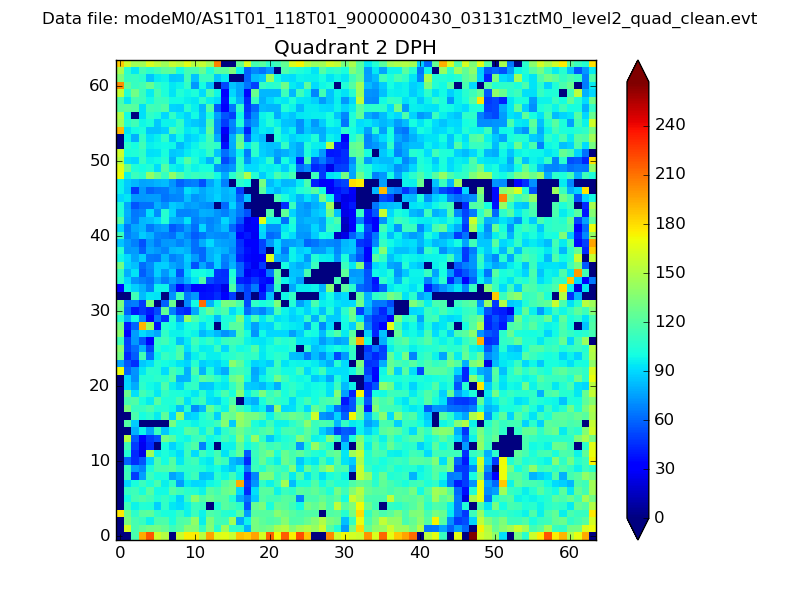
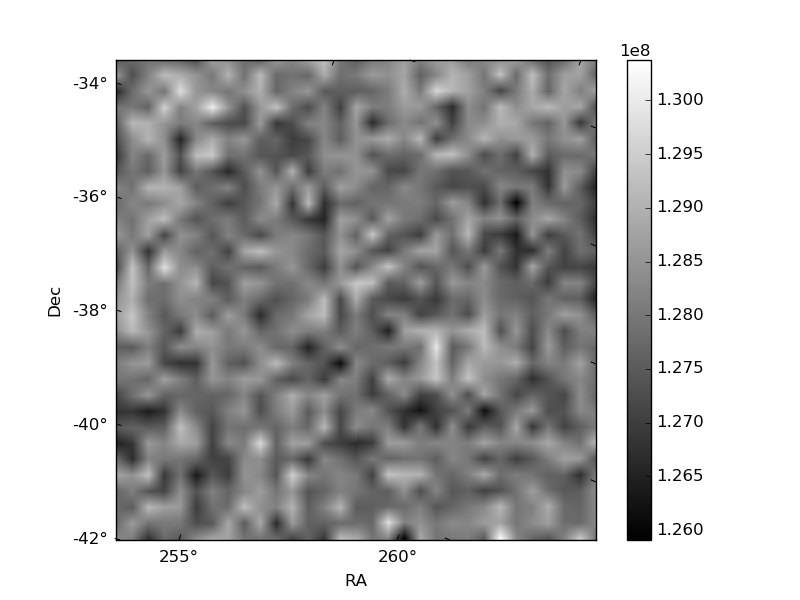
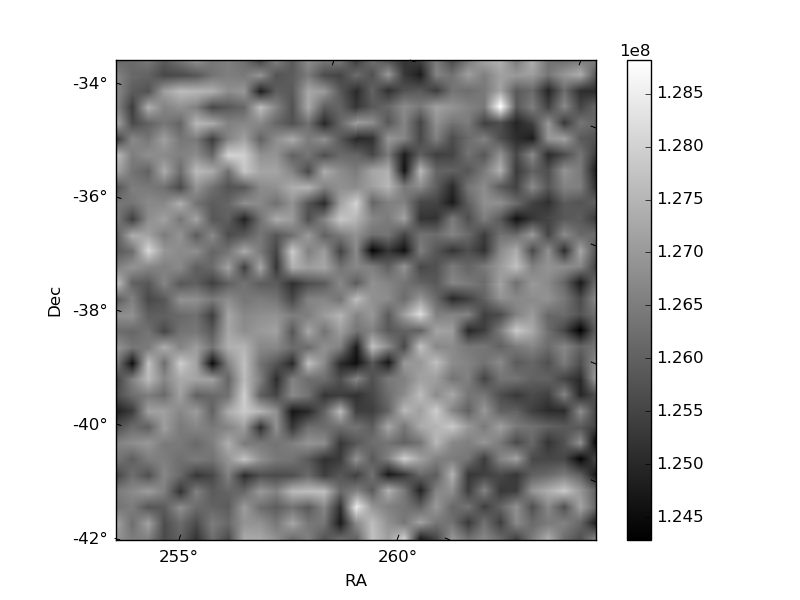
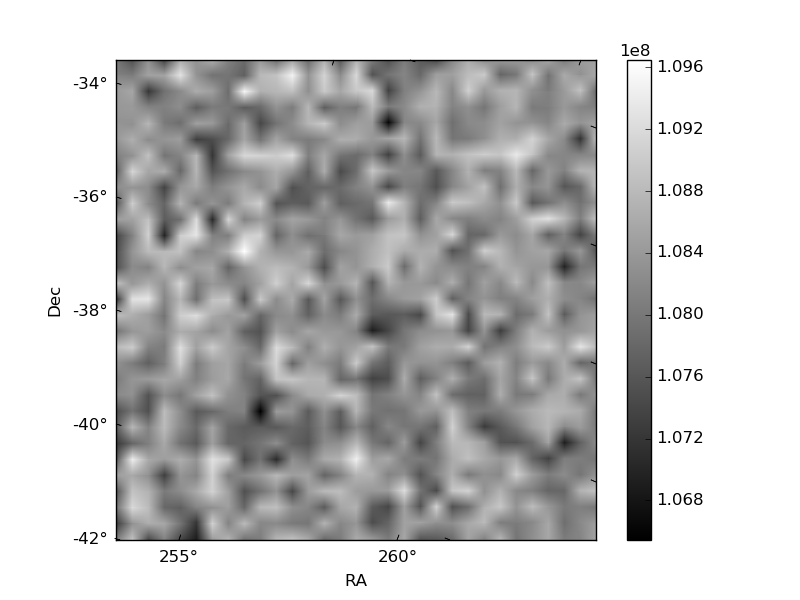
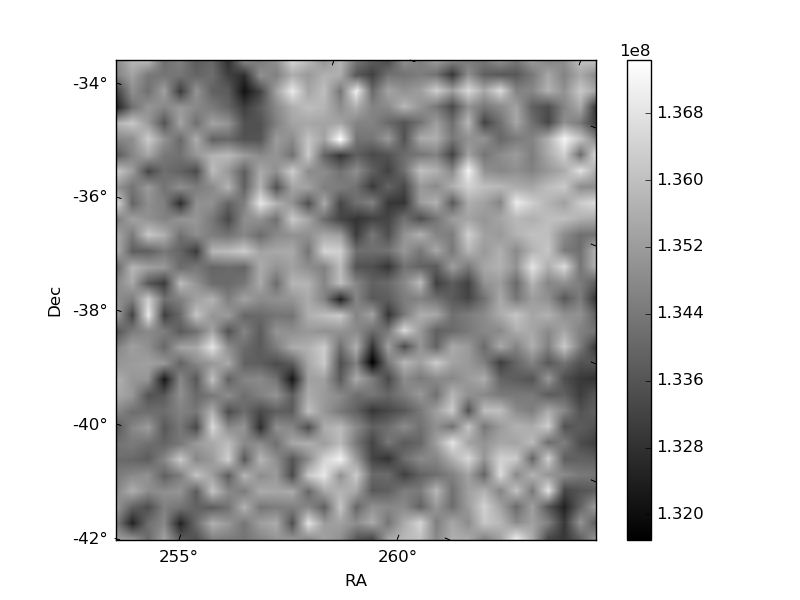
Histogram calculated using DETX and DETY for each event in the final _common_clean file
| Quadrant A | 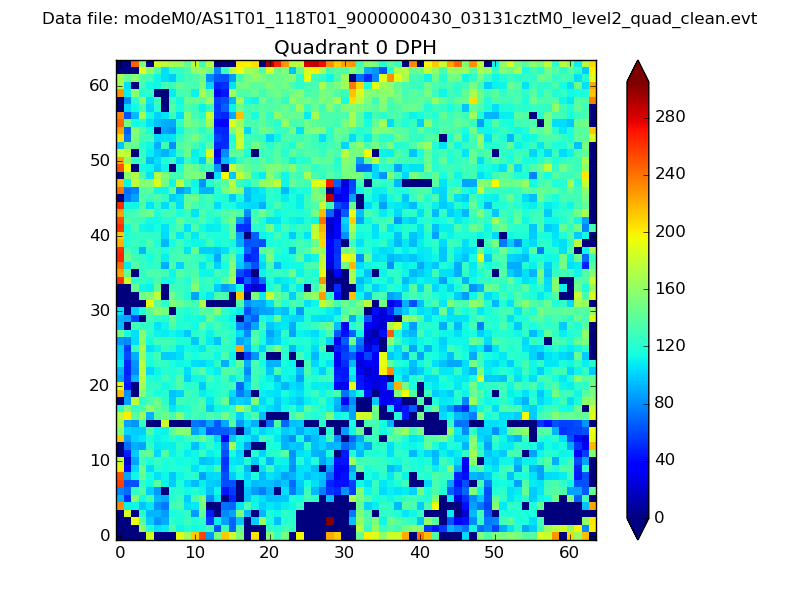 |
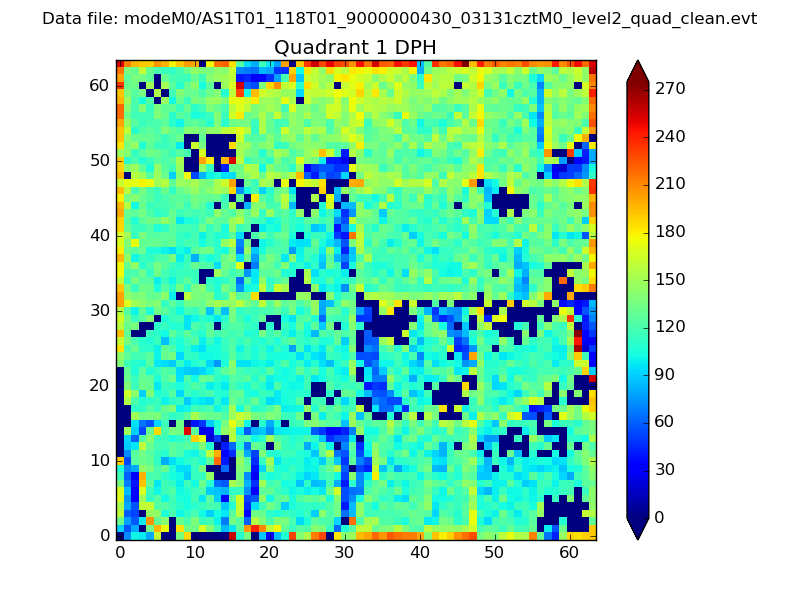 |
Quadrant B |
|---|---|---|---|
| Quadrant D |  |
 |
Quadrant C |
| Plot type | Count rate plots | Images |
|---|---|---|
| Comparison with Poisson distribution Blue bars denote a histogram of data divided into 1 sec bins. Red curve is a Poisson curve with rate = median count rate of data. |
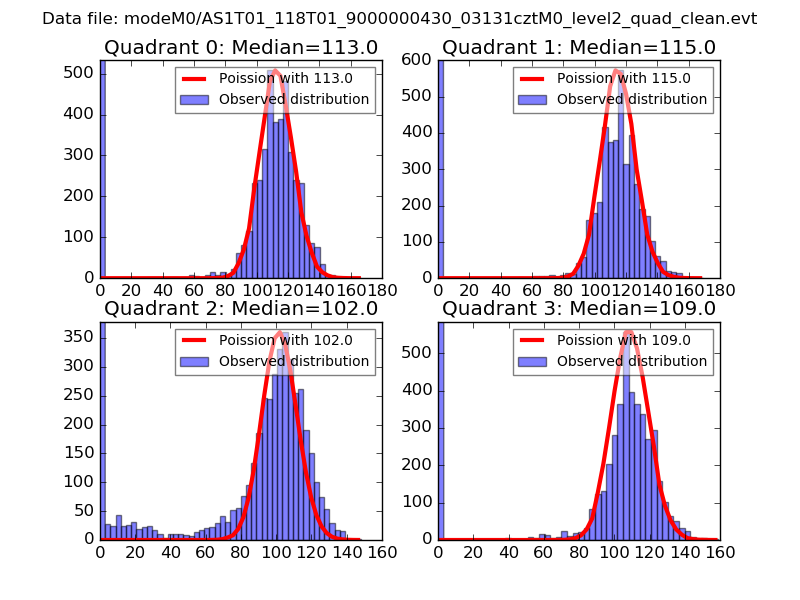 |
 |
| Quadrant-wise count rates Data is divided into 100 sec bins |
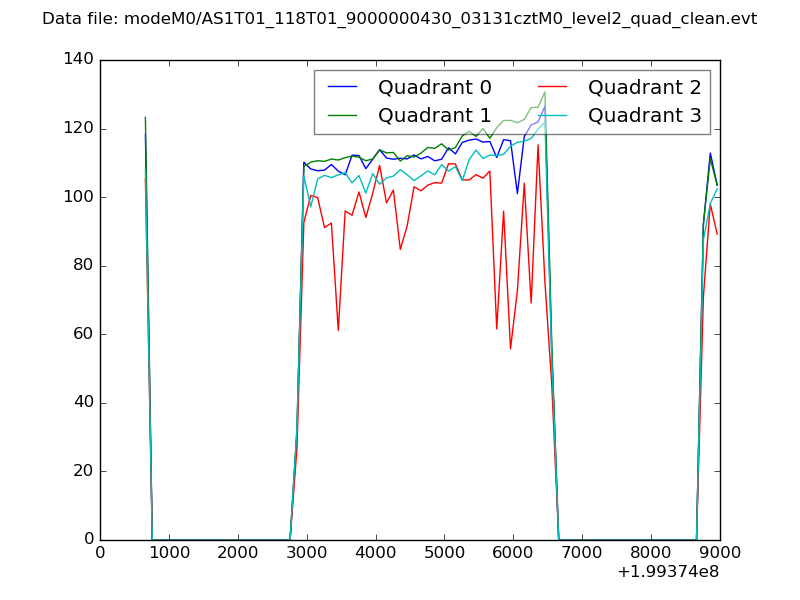 |
|
| Module-wise count rates for Quadrant A Data is divided into 100 sec bins |
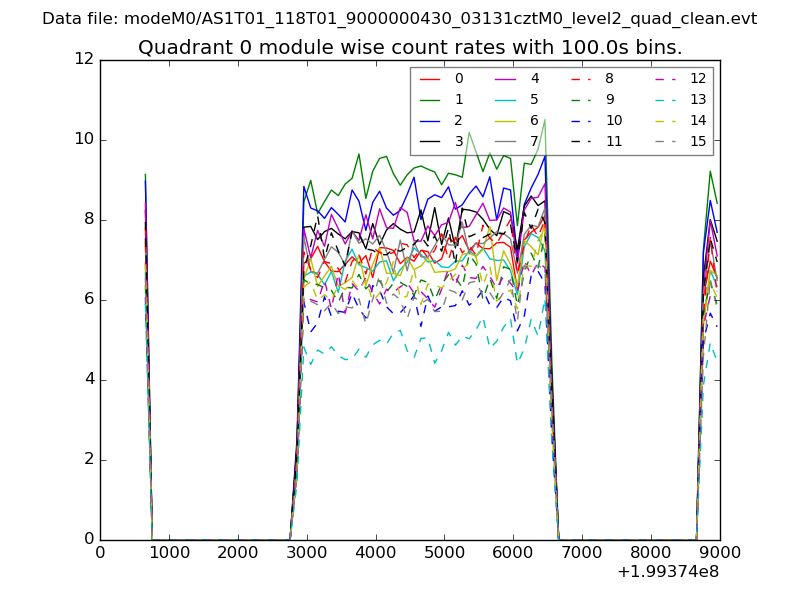 |
 |
| Module-wise count rates for Quadrant B Data is divided into 100 sec bins |
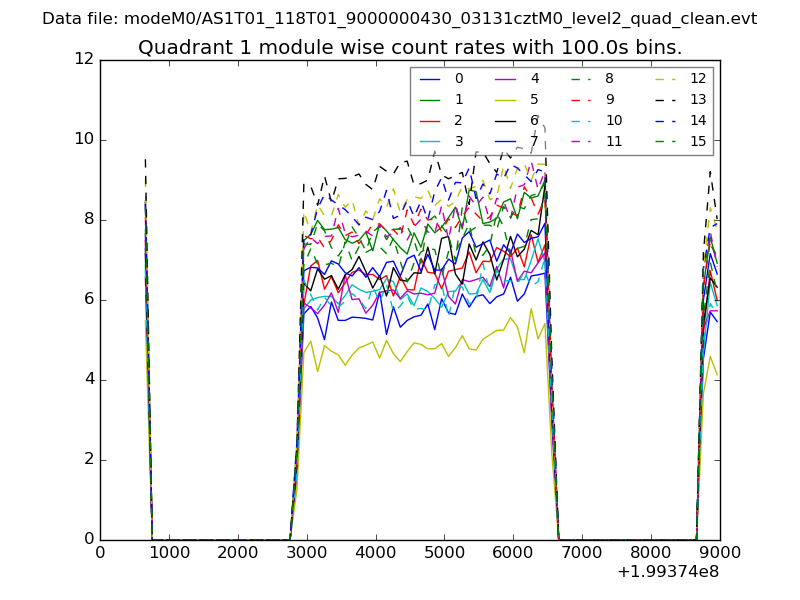 |
 |
| Module-wise count rates for Quadrant C Data is divided into 100 sec bins |
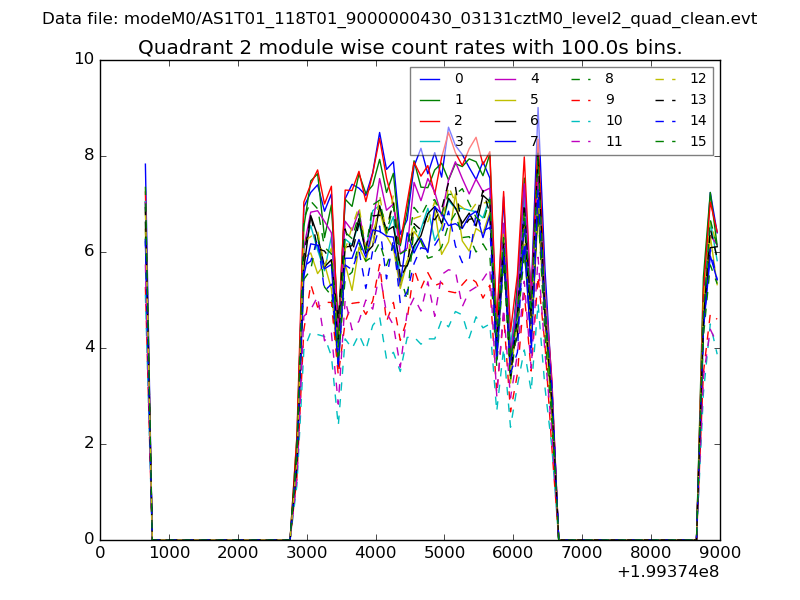 |
 |
| Module-wise count rates for Quadrant D Data is divided into 100 sec bins |
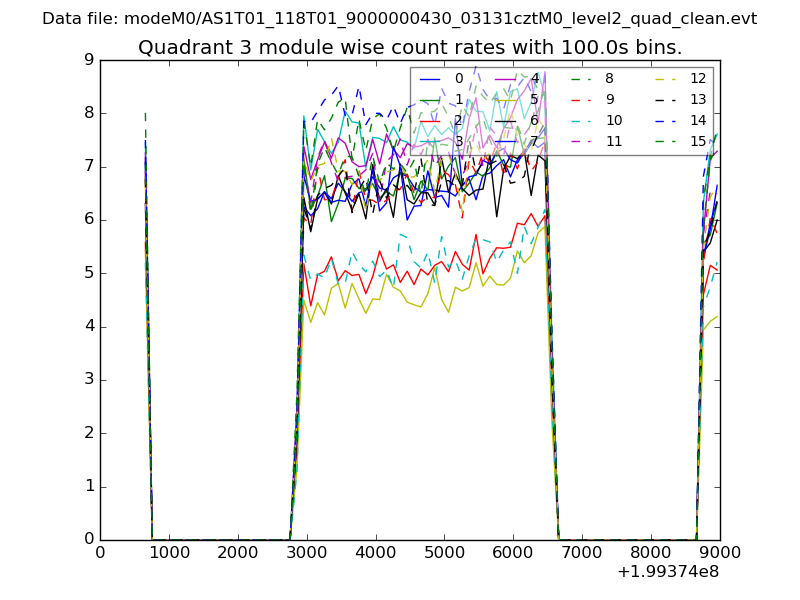 |
 |
| Parameter | Plot |
|---|---|
| CZT HV Monitor | 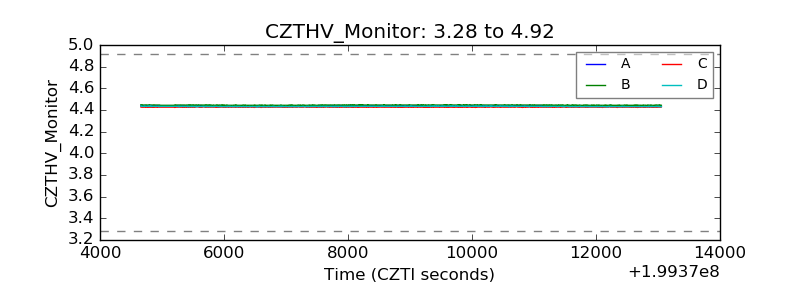 |
| D_VDD | 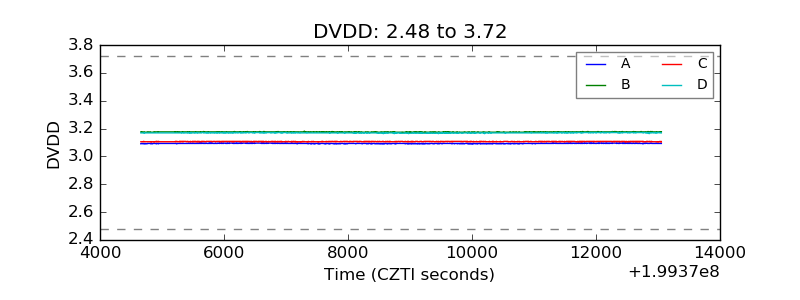 |
| Temperature 1 | 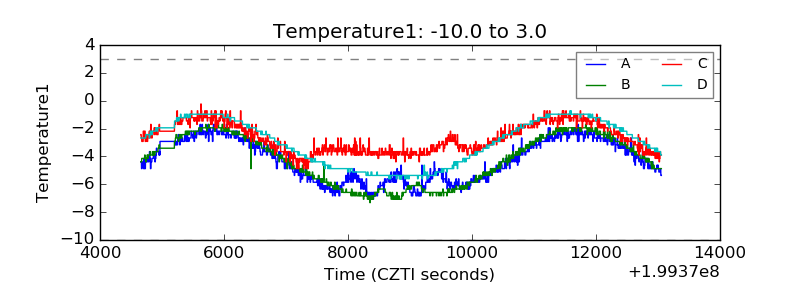 |
| Veto HV Monitor | 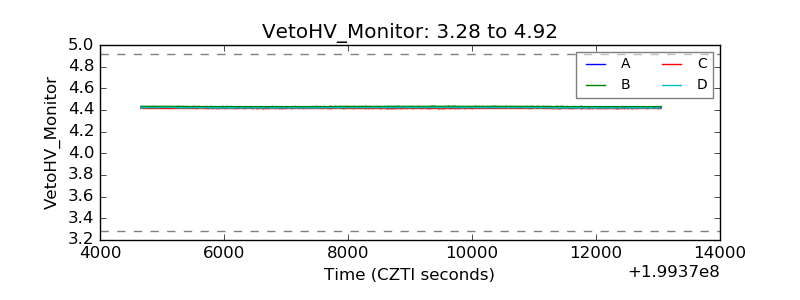 |
| Veto LLD | 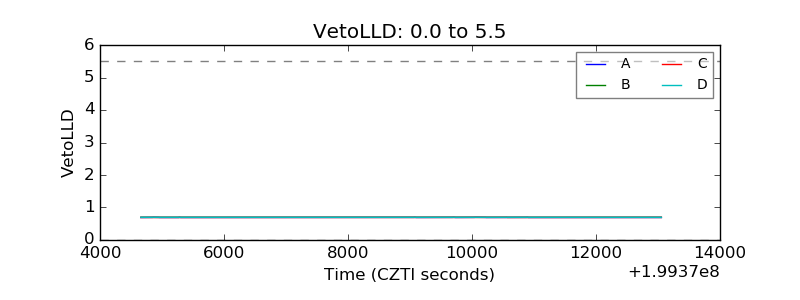 |
| Alpha Counter | 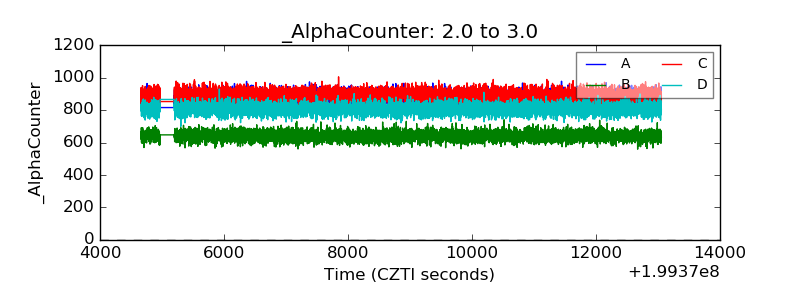 |
| _CPM_Rate | 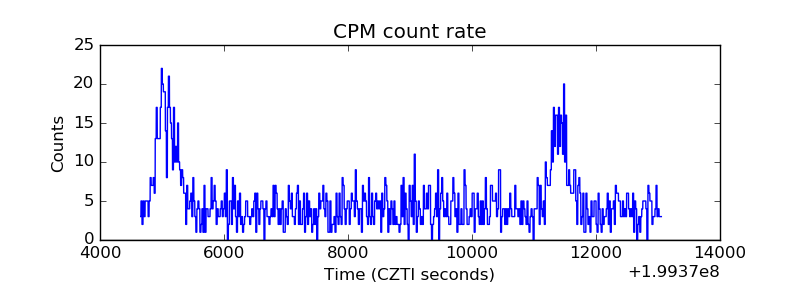 |
| CZT Counter | 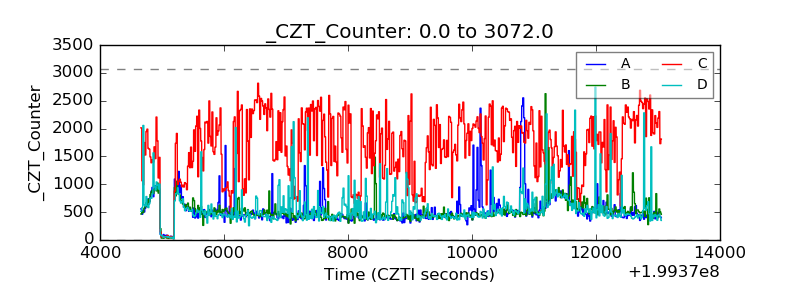 |
| +2.5 Volts monitor | 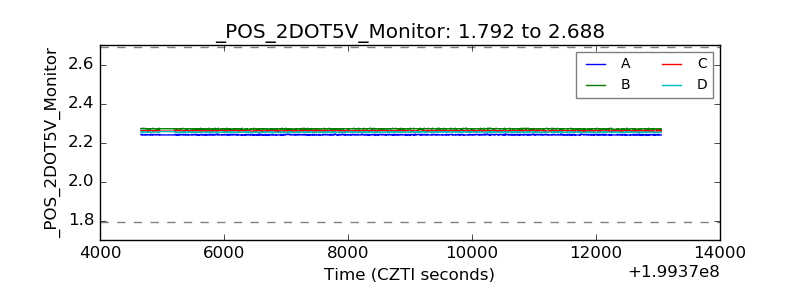 |
| +5 Volts monitor |  |
| _ROLL_ROT | 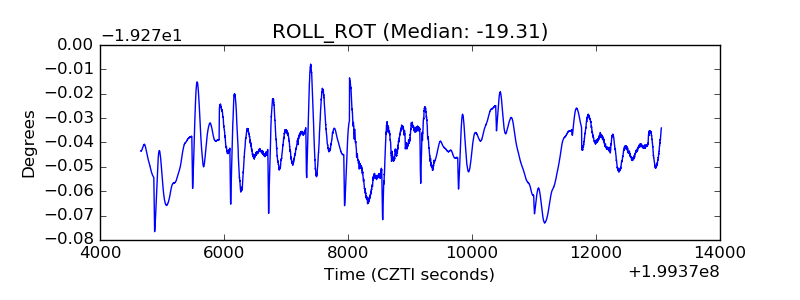 |
| _Roll_DEC | 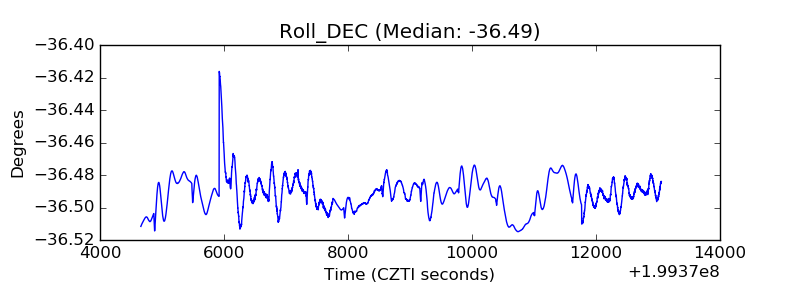 |
| _Roll_RA | 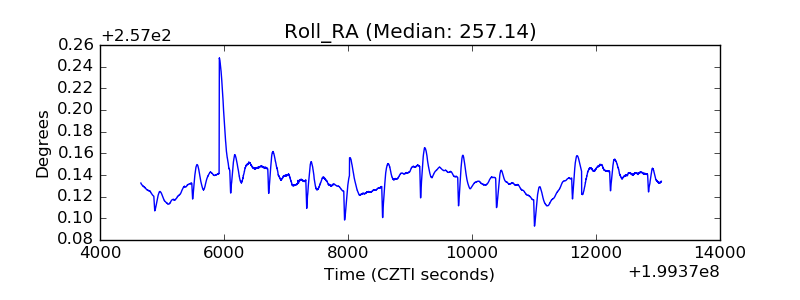 |
| Veto Counter | 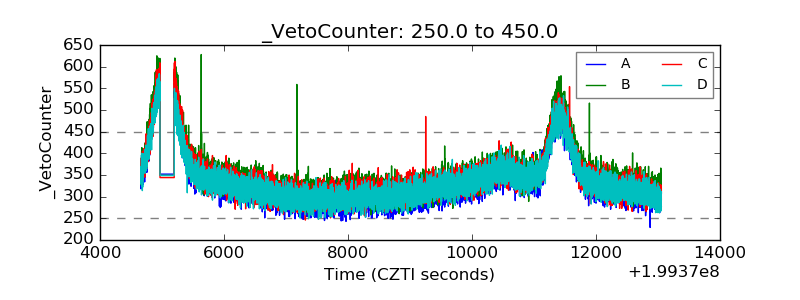 |