| Param | Original file | Final file |
|---|---|---|
| Filename | modeM0/AS1T01_118T01_9000000430_03132cztM0_level2.evt | modeM0/AS1T01_118T01_9000000430_03132cztM0_level2_quad_clean.evt |
| Size (bytes) | 880,125,120 | 81,360,000 |
| Size | 839.4 MB | 77.6 MB |
| Events in quadrant A | 3,821,323 | 515,271 |
| Events in quadrant B | 4,125,421 | 518,360 |
| Events in quadrant C | 13,674,951 | 383,654 |
| Events in quadrant D | 4,489,407 | 486,390 |
| Mode SS | |||
|---|---|---|---|
| Quadrant | BADHDUFLAG | Total packets | Discarded packets |
| A | 0 | 164 | 0 |
| B | 0 | 164 | 0 |
| C | 0 | 164 | 0 |
| D | 0 | 164 | 0 |
| Mode M0 | |||
|---|---|---|---|
| Quadrant | BADHDUFLAG | Total packets | Discarded packets |
| A | 0 | 17060 | 2 |
| B | 0 | 17587 | 1 |
| C | 0 | 46266 | 1 |
| D | 0 | 19250 | 1 |
| Mode M9 | |||
|---|---|---|---|
| Quadrant | BADHDUFLAG | Total packets | Discarded packets |
| A | 0 | 2 | 0 |
| B | 0 | 2 | 0 |
| C | 0 | 2 | 0 |
| D | 0 | 2 | 0 |
| Quadrant | Total seconds | Saturated seconds | Saturation percentage |
|---|---|---|---|
| A | 8037 | 246 | 3.060844% |
| B | 8037 | 314 | 3.906930% |
| C | 8037 | 3640 | 45.290531% |
| D | 8037 | 259 | 3.222595% |
Noise dominated data is calculated using 1-second bins in cleaned event files. If a bin has >2000 counts, and if more than 50% of those come from <1% of pixels, then it is considered to be noise-dominated and hence unusable.
| Quadrant | # 1 sec bins | Bins with >0 counts | Bins with >2000 counts | High rate bins dominated by noise | Noise dominated (total time) | Noise dominated (detector-on time) | Marked lightcurve |
|---|---|---|---|---|---|---|---|
| A | 8262 | 8038 | 6 | 6 | 0.07% | 0.07% | 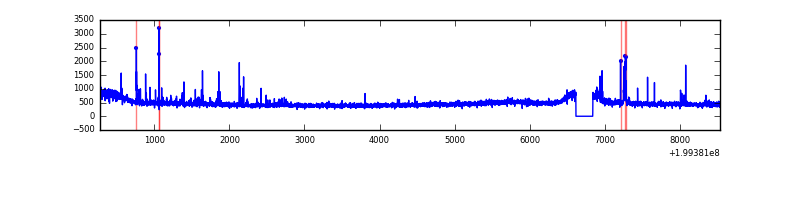 |
| B | 8262 | 8037 | 5 | 5 | 0.06% | 0.06% | 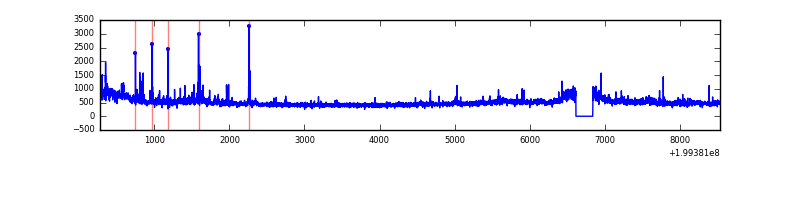 |
| C | 8262 | 8037 | 2723 | 2723 | 32.96% | 33.88% | 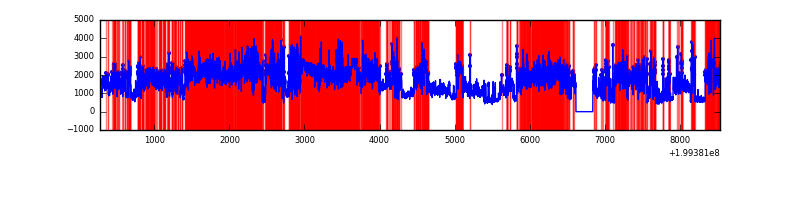 |
| D | 8262 | 8038 | 159 | 159 | 1.92% | 1.98% |  |
Top three noisy pixels from each quadrant. If the there are fewer than three noisy pixels in the level2.evt file, extra rows are filled as -1
| Pixel properties | Quadrant properties | ||||||
|---|---|---|---|---|---|---|---|
| Quadrant | DetID | PixID | Counts | Sigma | Mean | Median | Sigma |
| A | 12 | 247 | 44760 | 221.22 | 945 | 922 | 198.2 |
| A | 0 | 13 | 42826 | 211.46 | 945 | 922 | 198.2 |
| A | 8 | 15 | 39683 | 195.6 | 945 | 922 | 198.2 |
| B | 15 | 204 | 246114 | 1305.49 | 958 | 933 | 187.8 |
| B | 2 | 249 | 52166 | 272.79 | 958 | 933 | 187.8 |
| B | 4 | 81 | 29545 | 152.35 | 958 | 933 | 187.8 |
| C | 0 | 219 | 10377585 | 59463.32 | 743 | 744 | 174.5 |
| C | 14 | 223 | 157951 | 900.86 | 743 | 744 | 174.5 |
| C | 6 | 80 | 80148 | 455.02 | 743 | 744 | 174.5 |
| D | 12 | 233 | 382933 | 1707.68 | 907 | 877 | 223.7 |
| D | 5 | 233 | 139026 | 617.49 | 907 | 877 | 223.7 |
| D | 2 | 136 | 132878 | 590.01 | 907 | 877 | 223.7 |
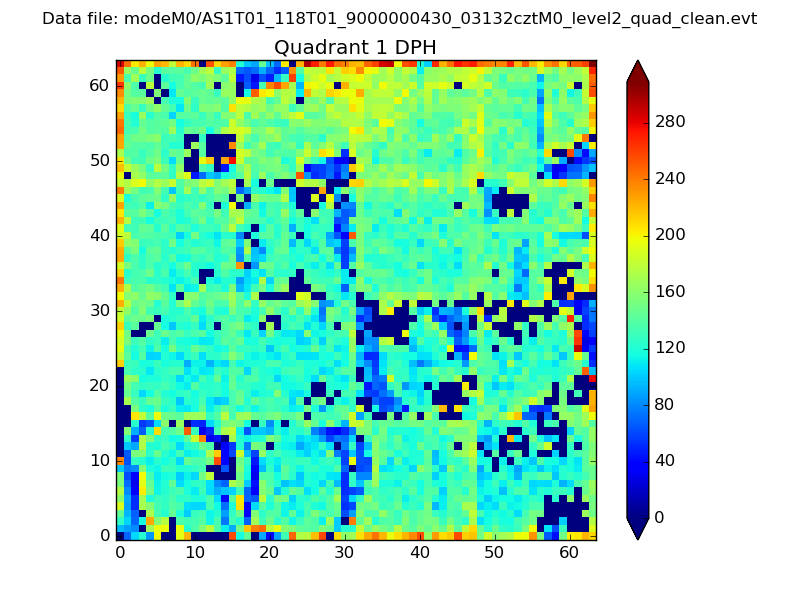
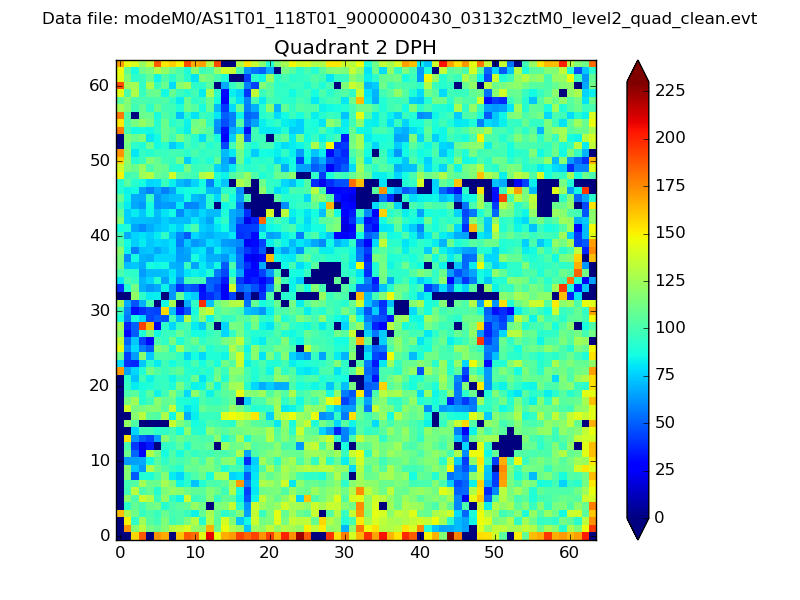
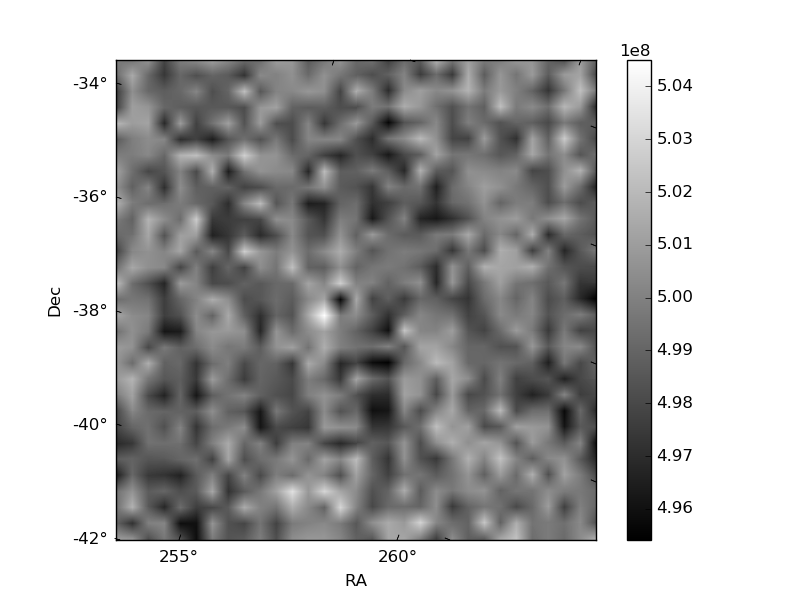
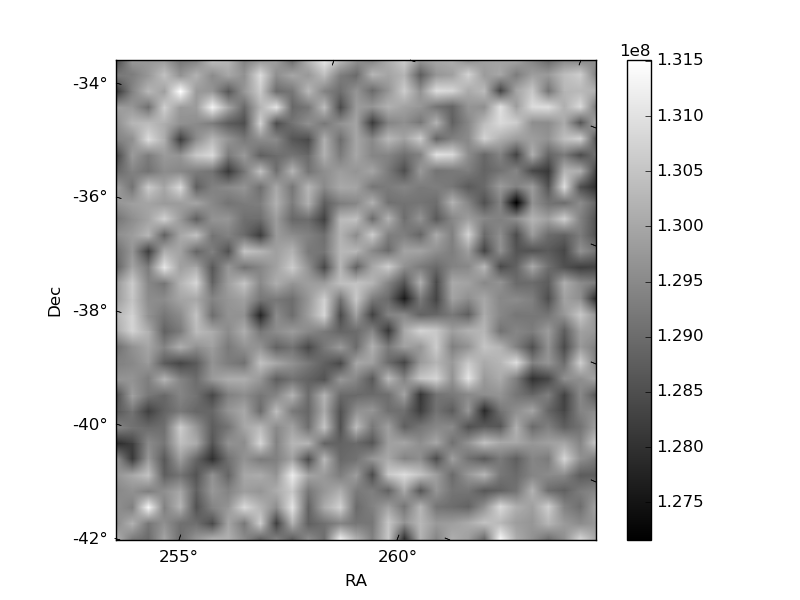
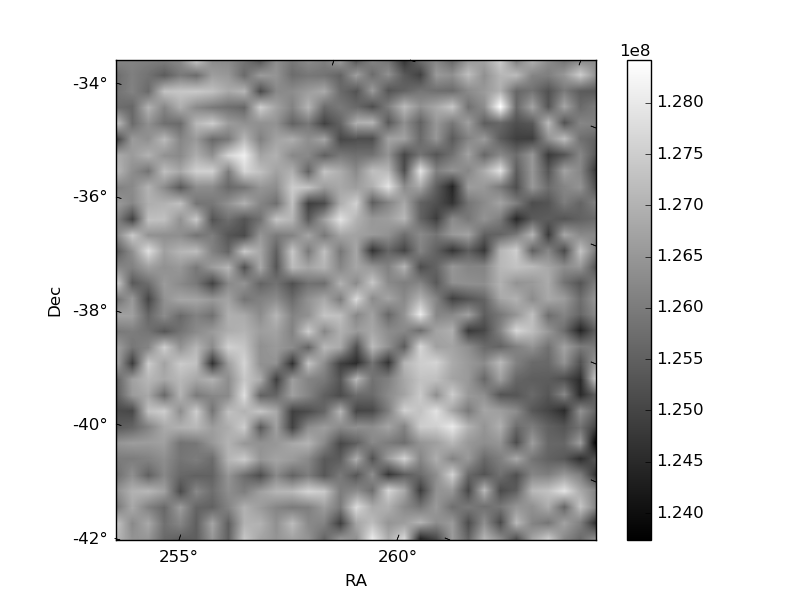
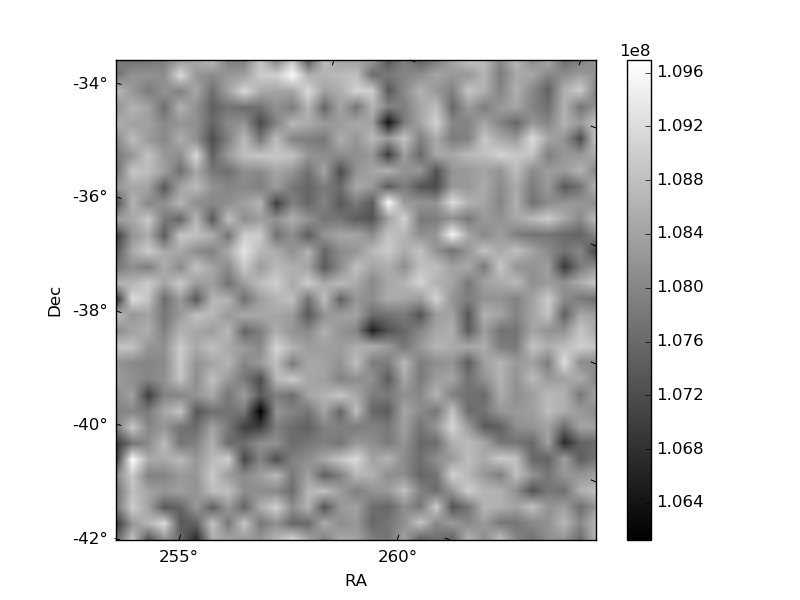
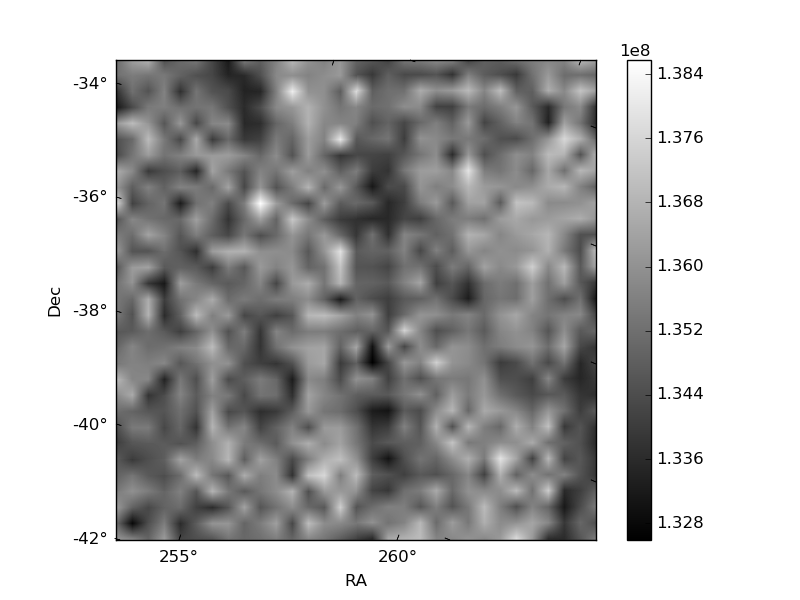
Histogram calculated using DETX and DETY for each event in the final _common_clean file
| Quadrant A | 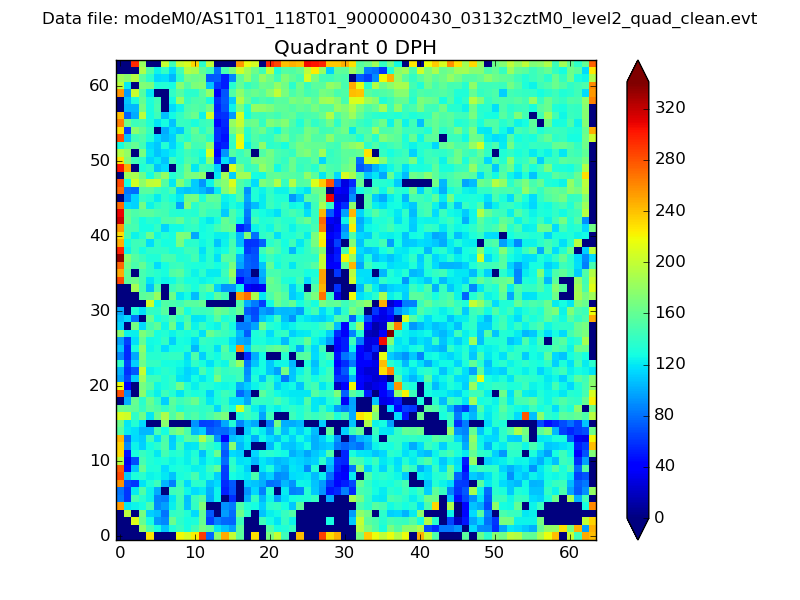 |
 |
Quadrant B |
|---|---|---|---|
| Quadrant D | 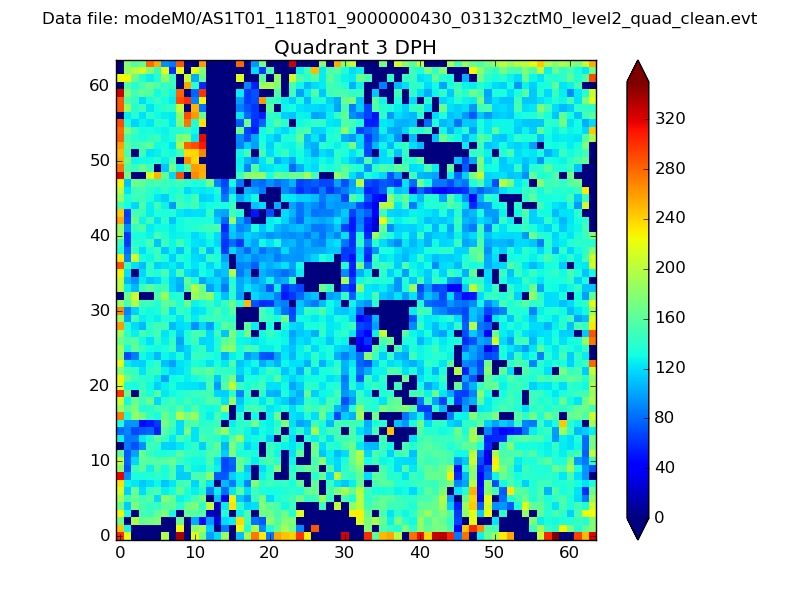 |
 |
Quadrant C |
| Plot type | Count rate plots | Images |
|---|---|---|
| Comparison with Poisson distribution Blue bars denote a histogram of data divided into 1 sec bins. Red curve is a Poisson curve with rate = median count rate of data. |
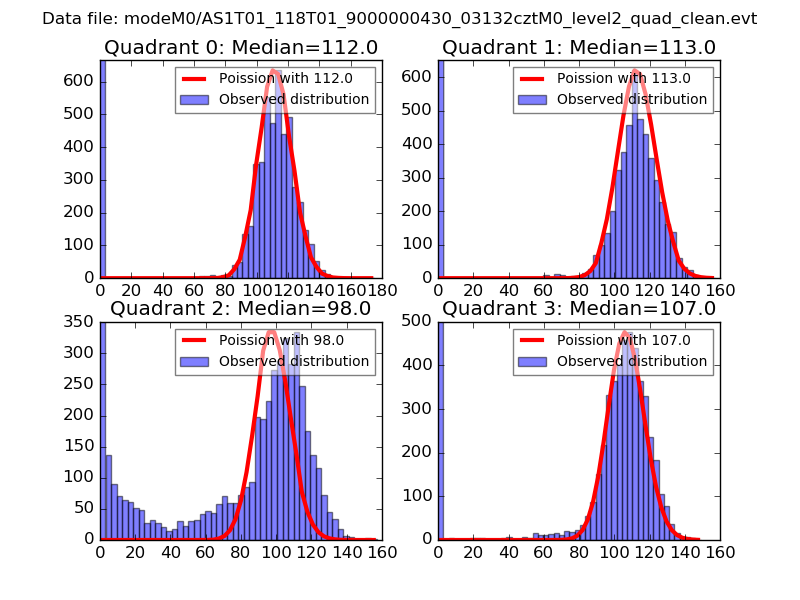 |
 |
| Quadrant-wise count rates Data is divided into 100 sec bins |
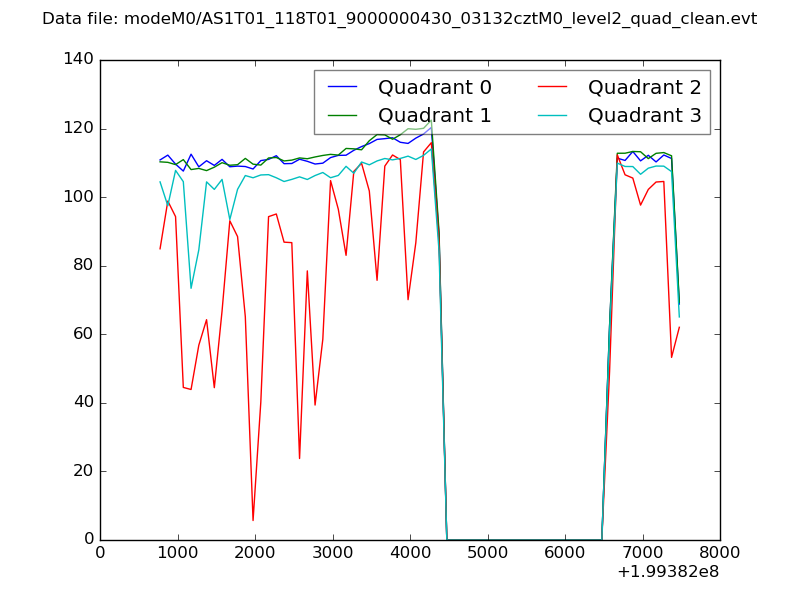 |
|
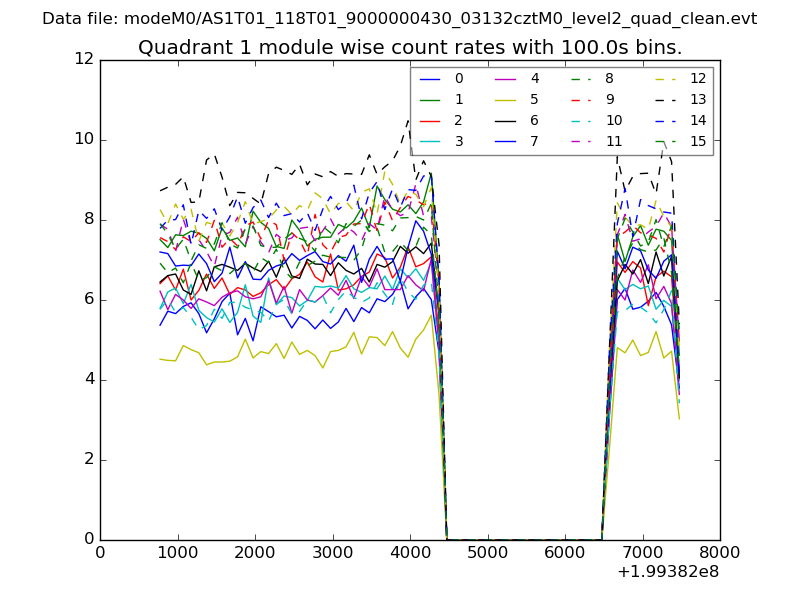
| Module-wise count rates for Quadrant A Data is divided into 100 sec bins |
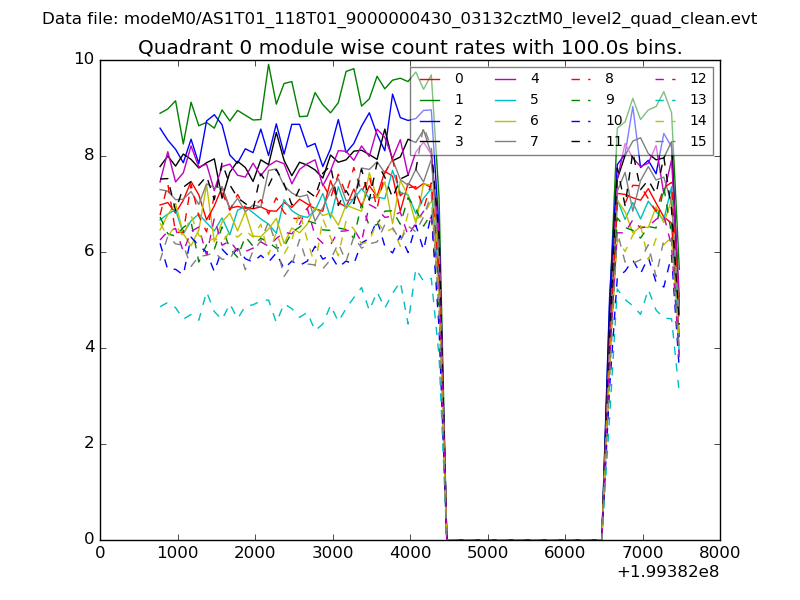 |
 |
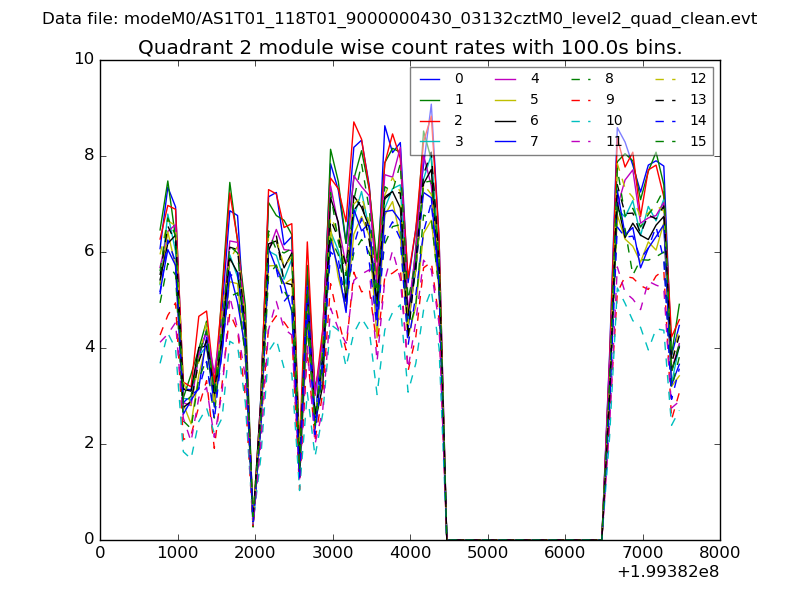
| Module-wise count rates for Quadrant B Data is divided into 100 sec bins |
 |
 |
| Module-wise count rates for Quadrant C Data is divided into 100 sec bins |
 |
 |
| Module-wise count rates for Quadrant D Data is divided into 100 sec bins |
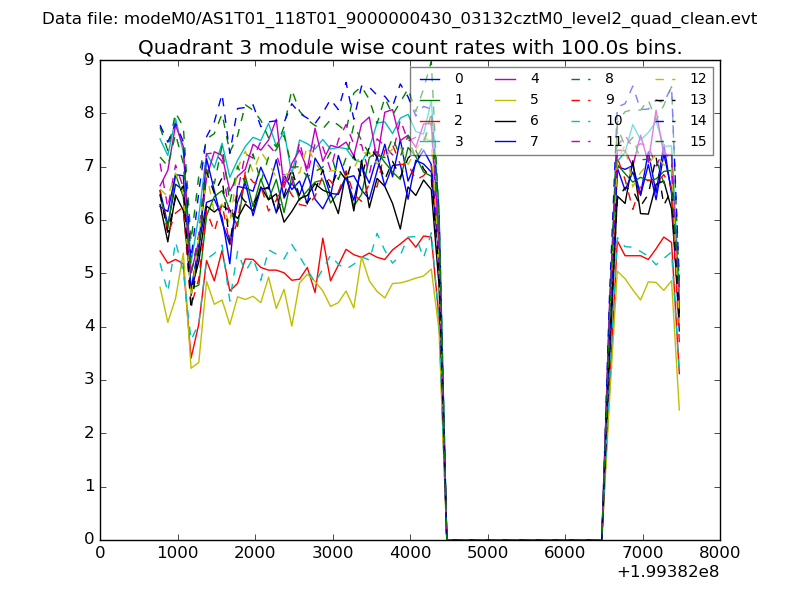 |
 |
| Parameter | Plot |
|---|---|
| CZT HV Monitor | 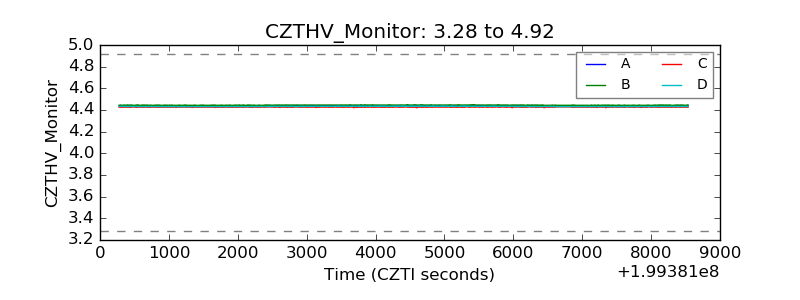 |
| D_VDD | 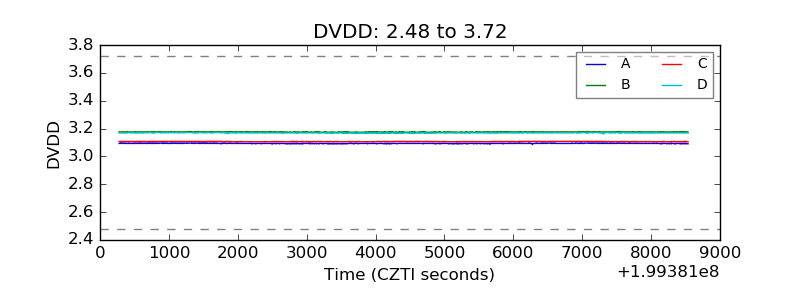 |
| Temperature 1 | 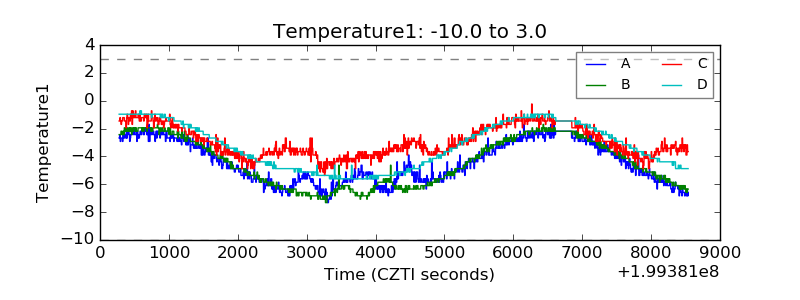 |
| Veto HV Monitor | 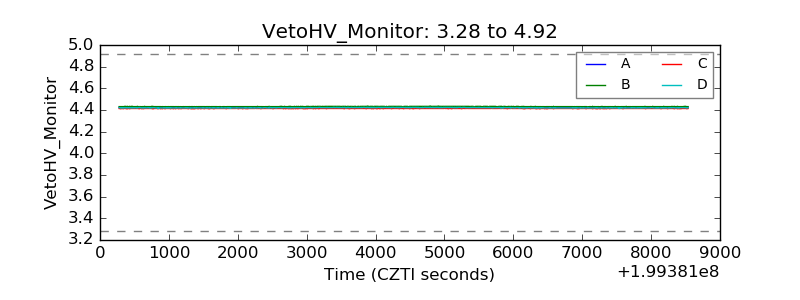 |
| Veto LLD | 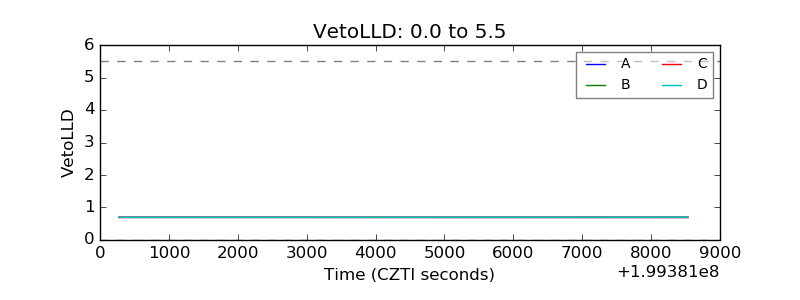 |
| Alpha Counter | 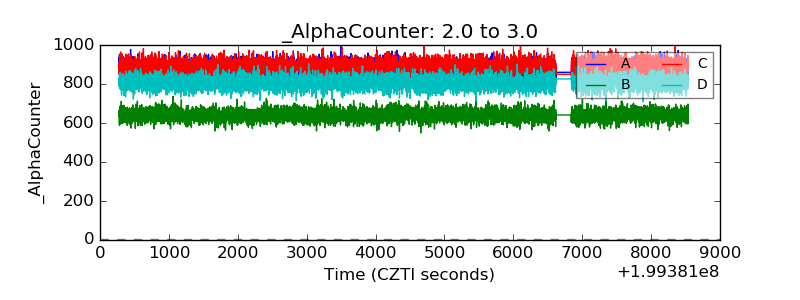 |
| _CPM_Rate | 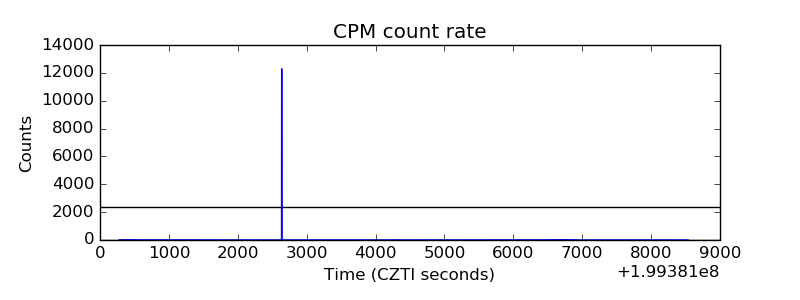 |
| CZT Counter | 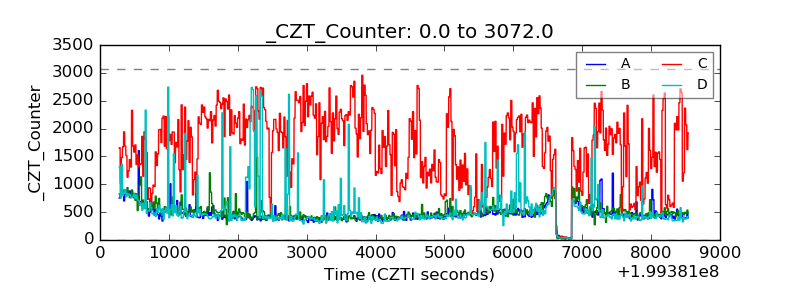 |
| +2.5 Volts monitor |  |
| +5 Volts monitor |  |
| _ROLL_ROT | 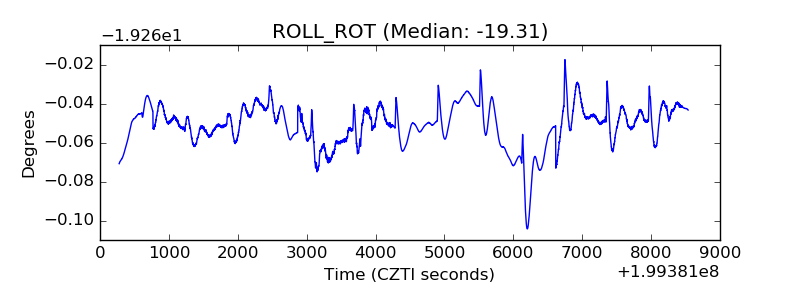 |
| _Roll_DEC | 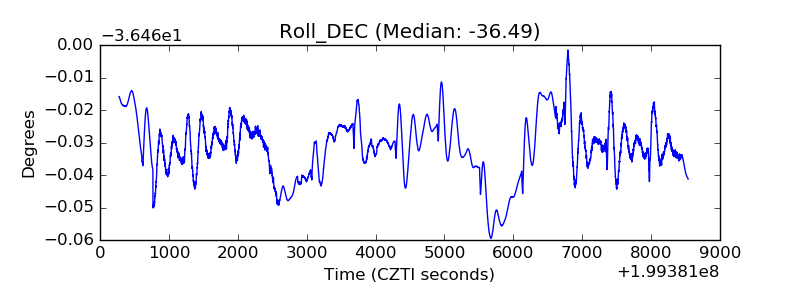 |
| _Roll_RA | 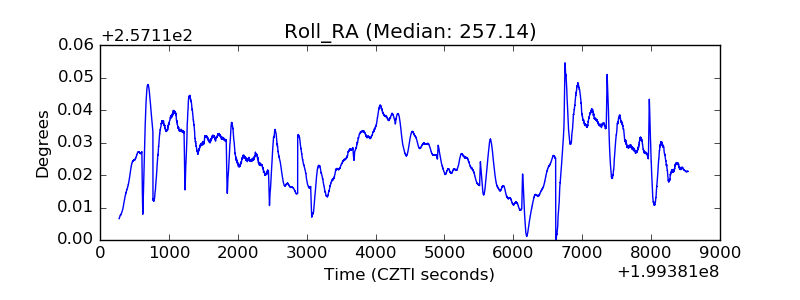 |
| Veto Counter | 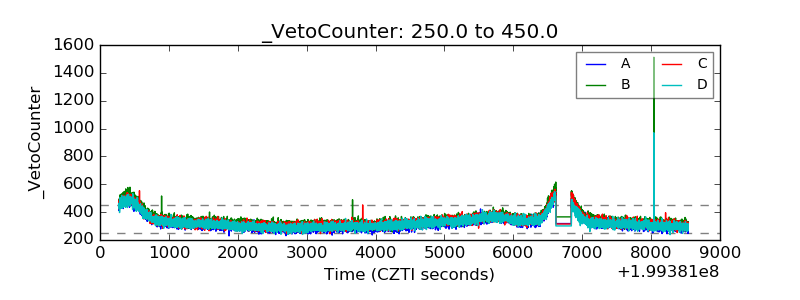 |