| Param | Original file | Final file |
|---|---|---|
| Filename | modeM0/AS1T01_118T01_9000000430_03136cztM0_level2.evt | modeM0/AS1T01_118T01_9000000430_03136cztM0_level2_quad_clean.evt |
| Size (bytes) | 1,936,226,880 | 279,040,320 |
| Size | 1.8 GB | 266.1 MB |
| Events in quadrant A | 10,809,228 | 1,765,598 |
| Events in quadrant B | 11,745,792 | 1,789,600 |
| Events in quadrant C | 22,871,925 | 1,562,213 |
| Events in quadrant D | 11,605,312 | 1,695,237 |
| Mode SS | |||
|---|---|---|---|
| Quadrant | BADHDUFLAG | Total packets | Discarded packets |
| A | 0 | 482 | 0 |
| B | 0 | 482 | 0 |
| C | 0 | 482 | 0 |
| D | 0 | 482 | 0 |
| Mode M0 | |||
|---|---|---|---|
| Quadrant | BADHDUFLAG | Total packets | Discarded packets |
| A | 0 | 49177 | 6 |
| B | 0 | 51017 | 5 |
| C | 0 | 84419 | 5 |
| D | 0 | 52230 | 5 |
| Mode M9 | |||
|---|---|---|---|
| Quadrant | BADHDUFLAG | Total packets | Discarded packets |
| A | 0 | 32 | 0 |
| B | 0 | 32 | 0 |
| C | 0 | 32 | 0 |
| D | 0 | 32 | 0 |
| Quadrant | Total seconds | Saturated seconds | Saturation percentage |
|---|---|---|---|
| A | 23808 | 129 | 0.541835% |
| B | 23808 | 122 | 0.512433% |
| C | 23808 | 4435 | 18.628192% |
| D | 23808 | 248 | 1.041667% |
Noise dominated data is calculated using 1-second bins in cleaned event files. If a bin has >2000 counts, and if more than 50% of those come from <1% of pixels, then it is considered to be noise-dominated and hence unusable.
| Quadrant | # 1 sec bins | Bins with >0 counts | Bins with >2000 counts | High rate bins dominated by noise | Noise dominated (total time) | Noise dominated (detector-on time) | Marked lightcurve |
|---|---|---|---|---|---|---|---|
| A | 26893 | 23812 | 54 | 54 | 0.20% | 0.23% | 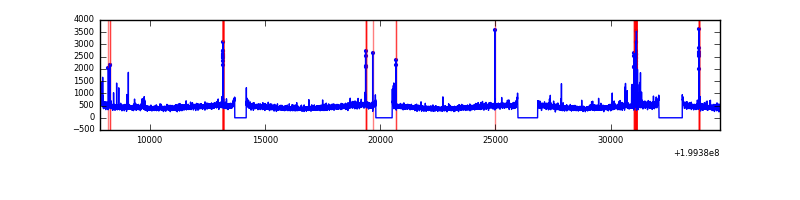 |
| B | 26893 | 23812 | 18 | 18 | 0.07% | 0.08% | 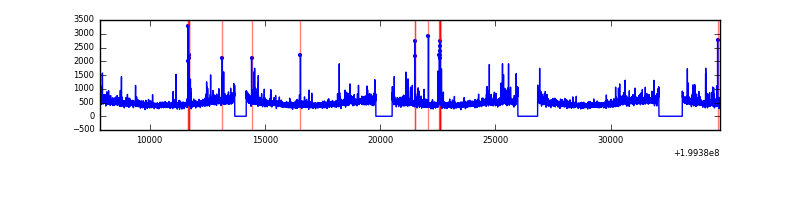 |
| C | 26893 | 23812 | 3673 | 3673 | 13.66% | 15.42% | 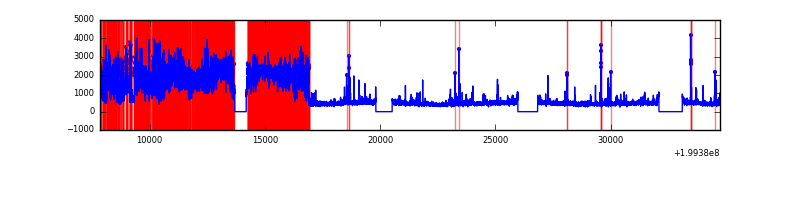 |
| D | 26893 | 23812 | 187 | 187 | 0.70% | 0.79% |  |
Top three noisy pixels from each quadrant. If the there are fewer than three noisy pixels in the level2.evt file, extra rows are filled as -1
| Pixel properties | Quadrant properties | ||||||
|---|---|---|---|---|---|---|---|
| Quadrant | DetID | PixID | Counts | Sigma | Mean | Median | Sigma |
| A | 12 | 247 | 190859 | 344.38 | 2675 | 2616 | 546.6 |
| A | 8 | 15 | 175123 | 315.59 | 2675 | 2616 | 546.6 |
| A | 0 | 50 | 52897 | 91.99 | 2675 | 2616 | 546.6 |
| B | 15 | 204 | 507479 | 956.38 | 2728 | 2665 | 527.8 |
| B | 4 | 81 | 317995 | 597.4 | 2728 | 2665 | 527.8 |
| B | 0 | 187 | 130234 | 241.68 | 2728 | 2665 | 527.8 |
| C | 0 | 219 | 12445254 | 22507.01 | 2376 | 2384 | 552.8 |
| C | 14 | 223 | 530528 | 955.32 | 2376 | 2384 | 552.8 |
| C | 6 | 80 | 213563 | 381.99 | 2376 | 2384 | 552.8 |
| D | 13 | 223 | 505735 | 808.74 | 2588 | 2515 | 622.2 |
| D | 5 | 233 | 313816 | 500.3 | 2588 | 2515 | 622.2 |
| D | 13 | 239 | 289981 | 462.0 | 2588 | 2515 | 622.2 |
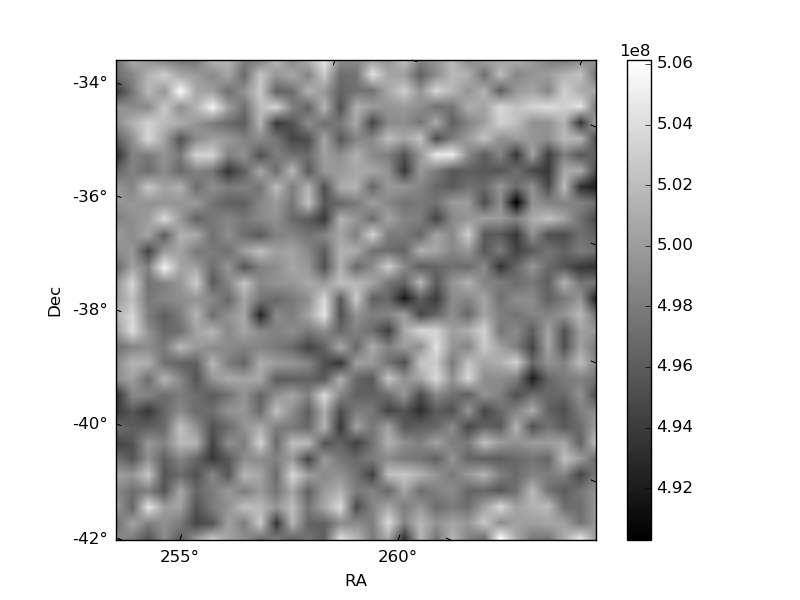
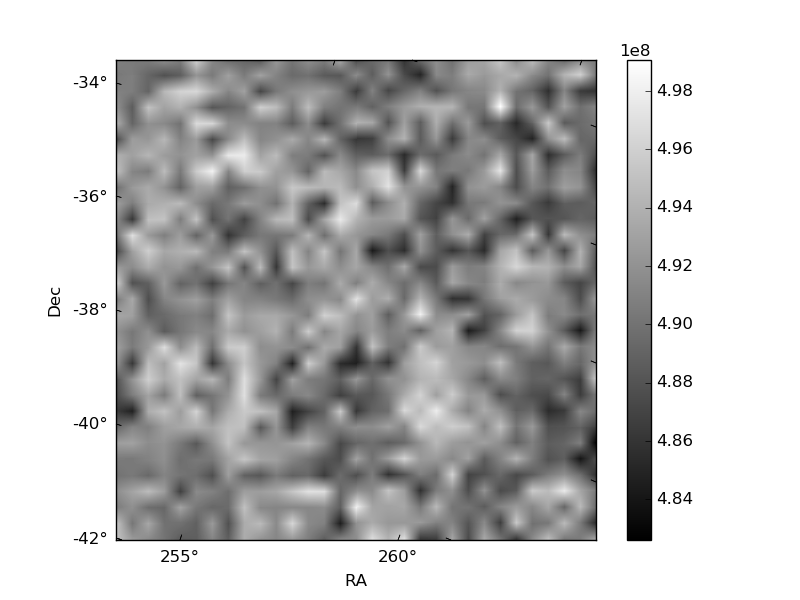
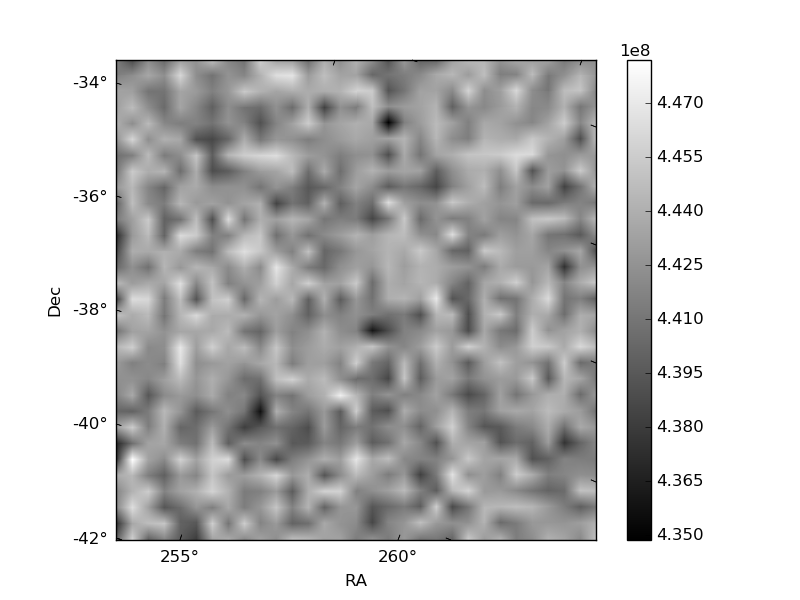
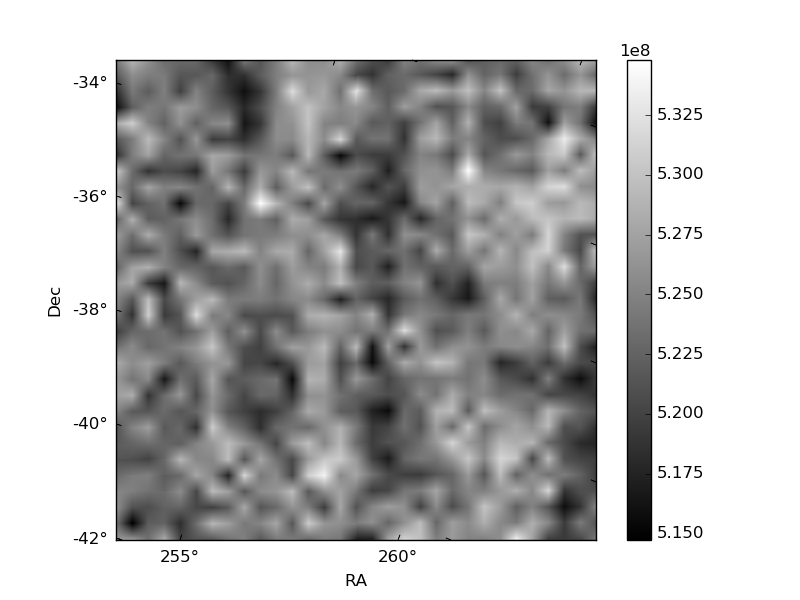
Histogram calculated using DETX and DETY for each event in the final _common_clean file
| Quadrant A | 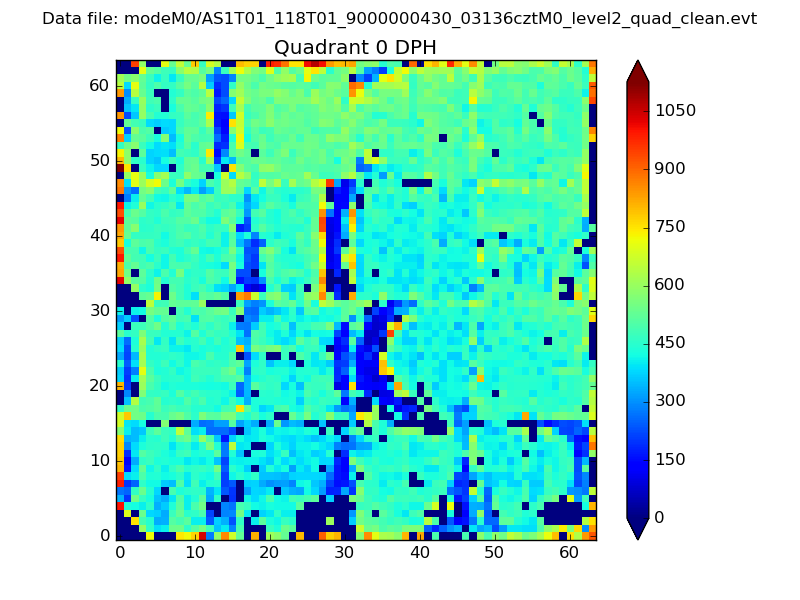 |
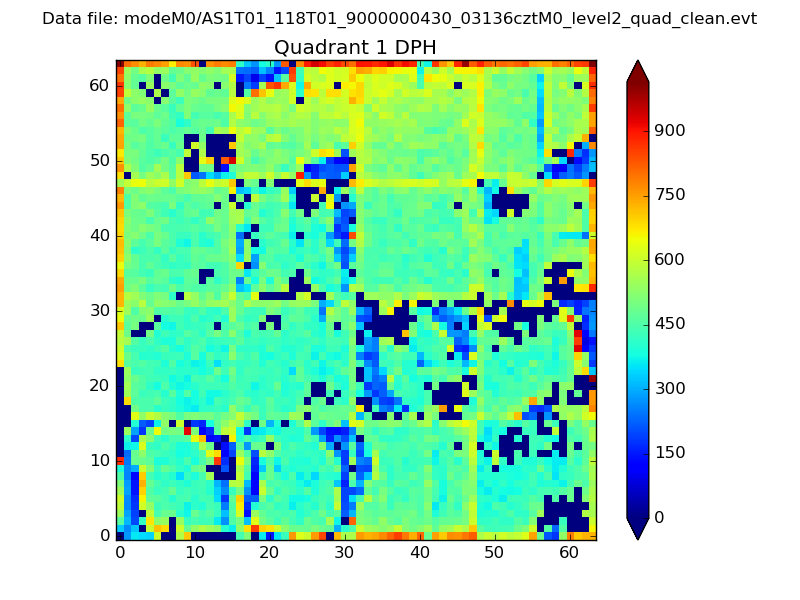 |
Quadrant B |
|---|---|---|---|
| Quadrant D |  |
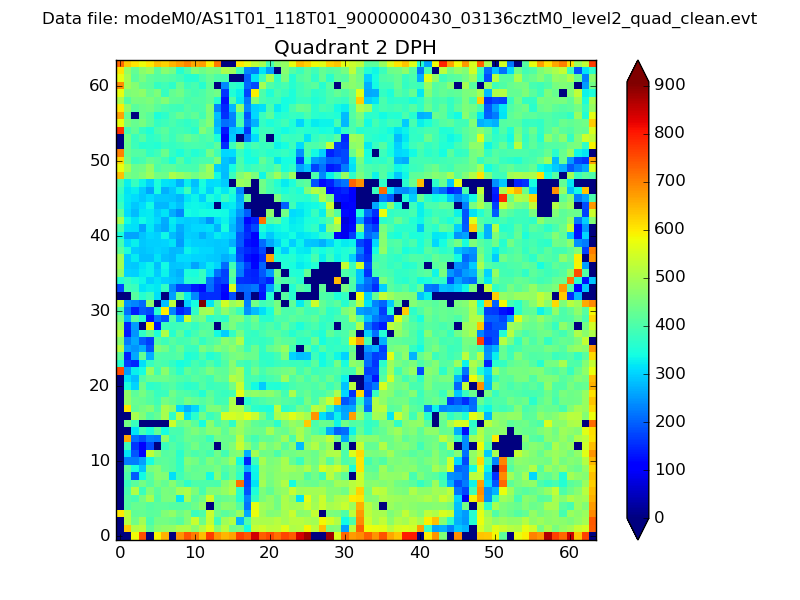 |
Quadrant C |
| Plot type | Count rate plots | Images |
|---|---|---|
| Comparison with Poisson distribution Blue bars denote a histogram of data divided into 1 sec bins. Red curve is a Poisson curve with rate = median count rate of data. |
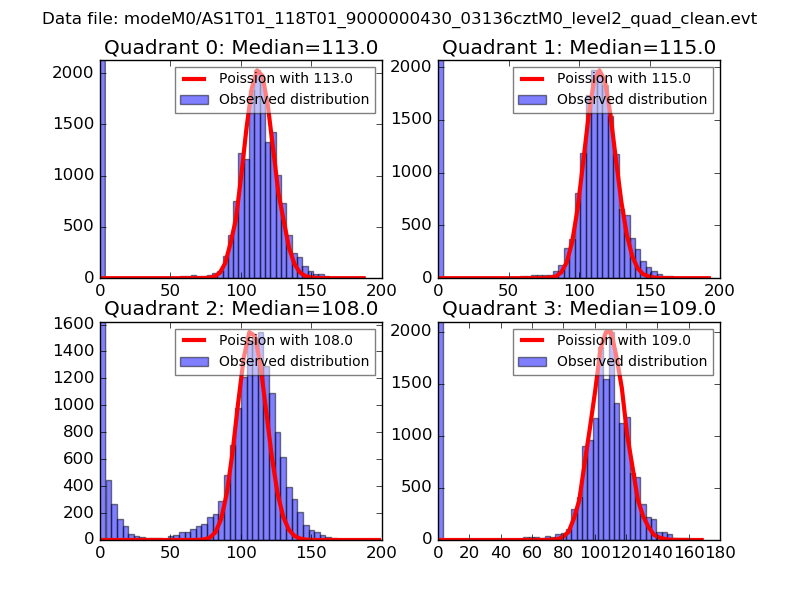 |
 |
| Quadrant-wise count rates Data is divided into 100 sec bins |
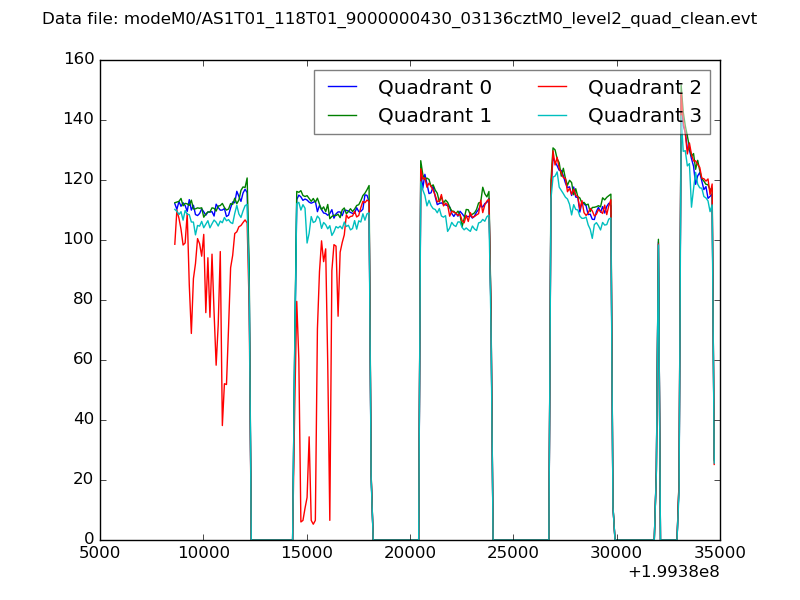 |
|
| Module-wise count rates for Quadrant A Data is divided into 100 sec bins |
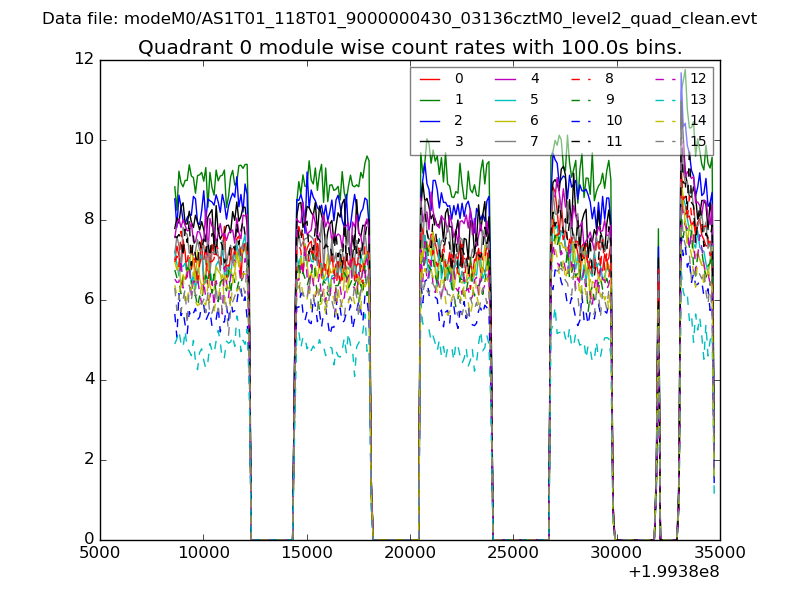 |
 |
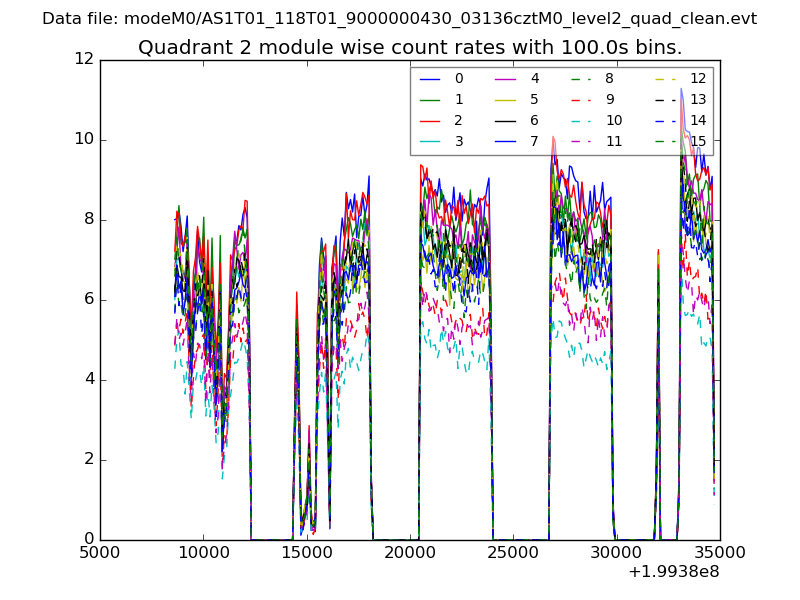
| Module-wise count rates for Quadrant B Data is divided into 100 sec bins |
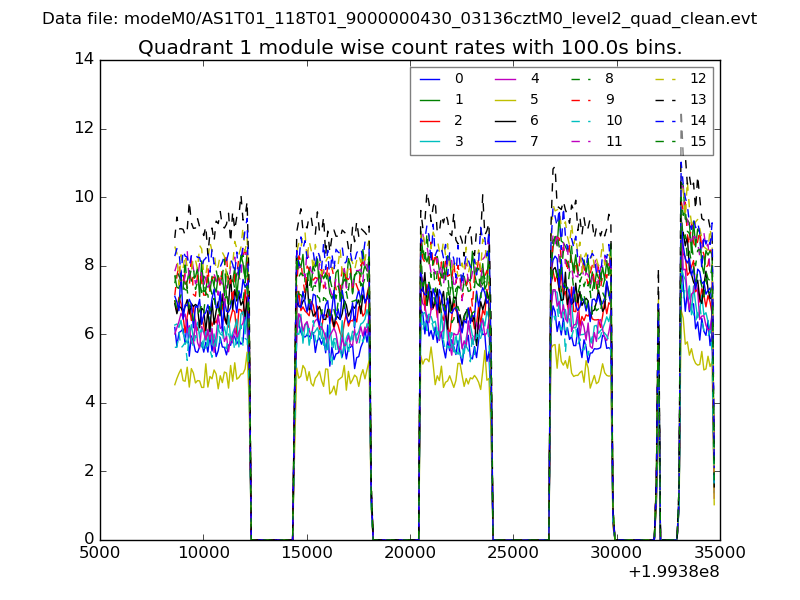 |
 |
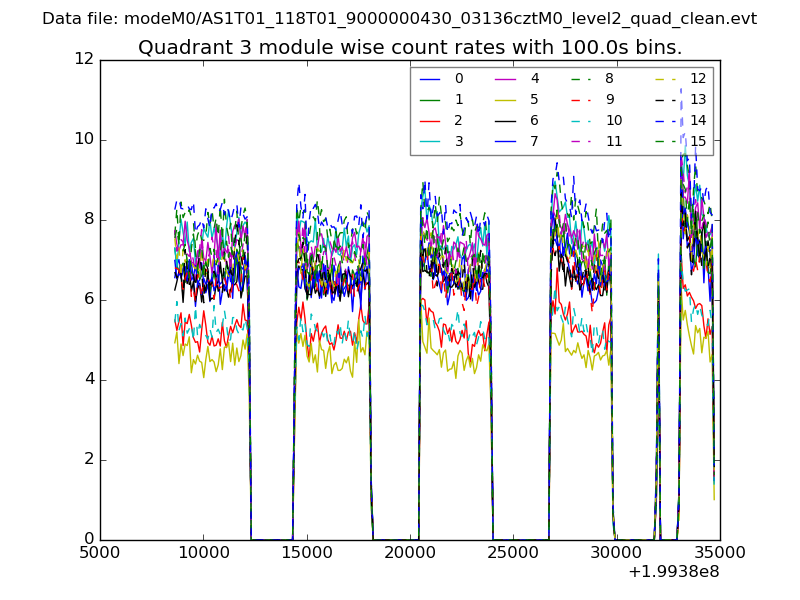
| Module-wise count rates for Quadrant C Data is divided into 100 sec bins |
 |
 |
| Module-wise count rates for Quadrant D Data is divided into 100 sec bins |
 |
 |
| Parameter | Plot |
|---|---|
| CZT HV Monitor | 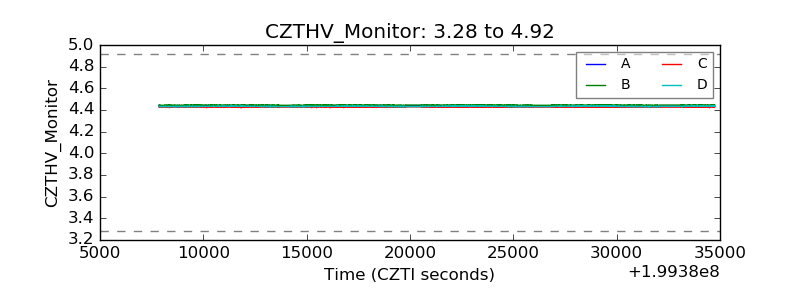 |
| D_VDD | 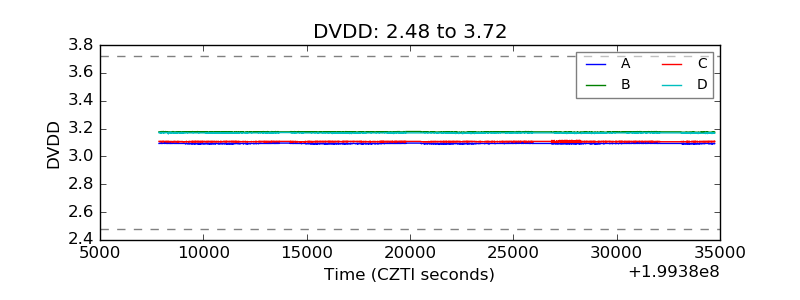 |
| Temperature 1 | 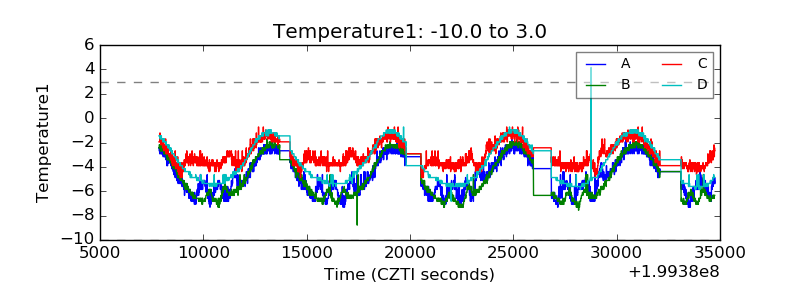 |
| Veto HV Monitor | 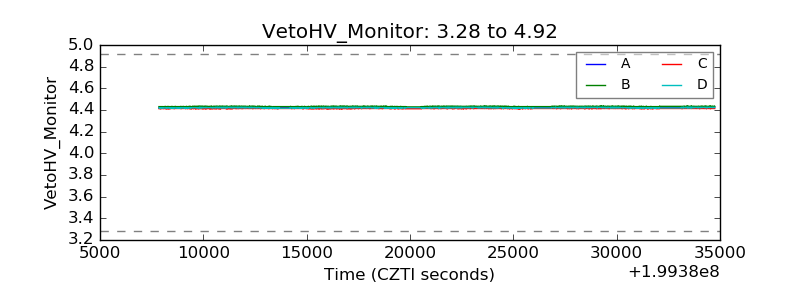 |
| Veto LLD |  |
| Alpha Counter | 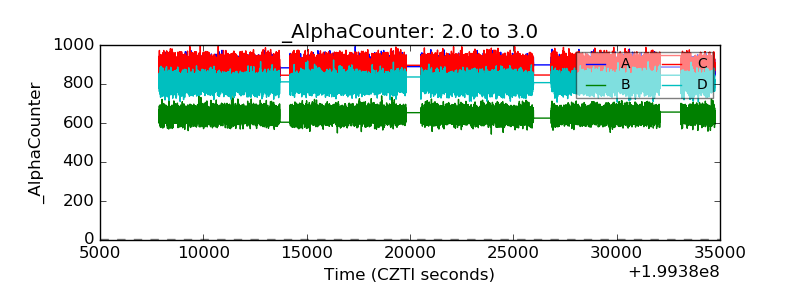 |
| _CPM_Rate | 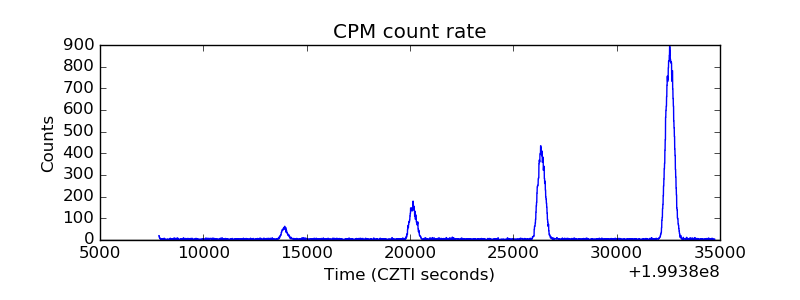 |
| CZT Counter | 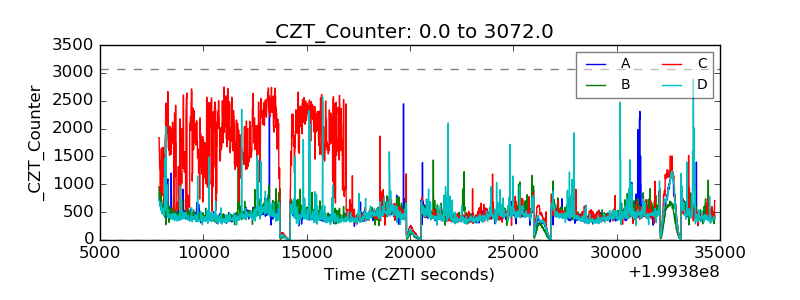 |
| +2.5 Volts monitor |  |
| +5 Volts monitor |  |
| _ROLL_ROT | 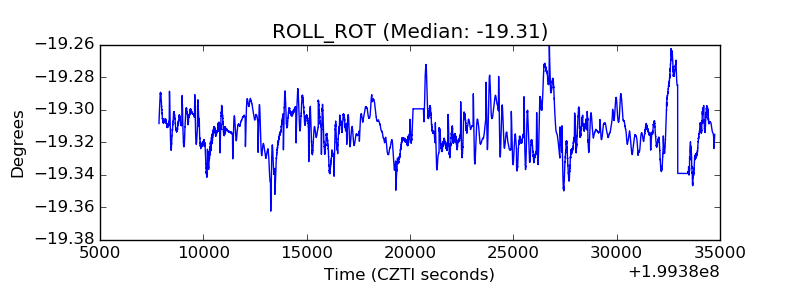 |
| _Roll_DEC | 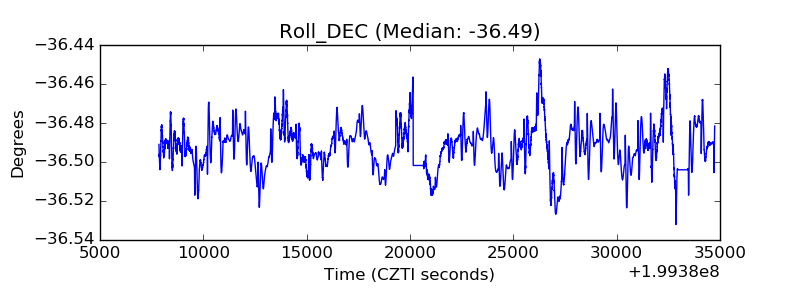 |
| _Roll_RA | 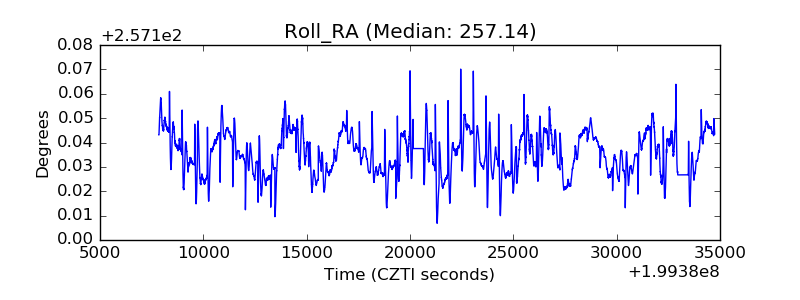 |
| Veto Counter | 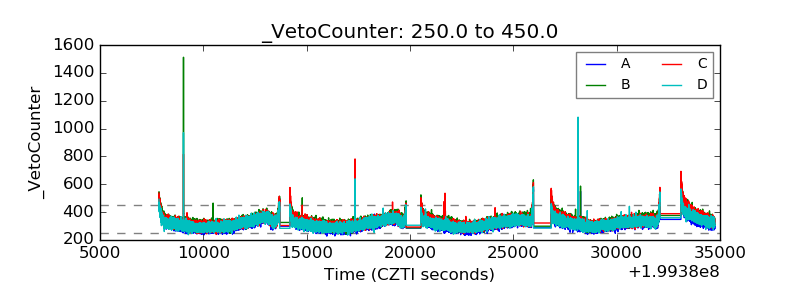 |