| Param | Original file | Final file |
|---|---|---|
| Filename | modeM0/AS1T01_118T01_9000000430_03139cztM0_level2.evt | modeM0/AS1T01_118T01_9000000430_03139cztM0_level2_quad_clean.evt |
| Size (bytes) | 454,682,880 | 80,167,680 |
| Size | 433.6 MB | 76.5 MB |
| Events in quadrant A | 3,117,317 | 499,990 |
| Events in quadrant B | 3,190,671 | 508,746 |
| Events in quadrant C | 3,951,663 | 491,975 |
| Events in quadrant D | 3,077,425 | 482,070 |
| Mode SS | |||
|---|---|---|---|
| Quadrant | BADHDUFLAG | Total packets | Discarded packets |
| A | 0 | 130 | 0 |
| B | 0 | 130 | 0 |
| C | 0 | 130 | 0 |
| D | 0 | 130 | 0 |
| Mode M0 | |||
|---|---|---|---|
| Quadrant | BADHDUFLAG | Total packets | Discarded packets |
| A | 0 | 13268 | 3 |
| B | 0 | 13462 | 2 |
| C | 0 | 15765 | 2 |
| D | 0 | 13523 | 2 |
| Mode M9 | |||
|---|---|---|---|
| Quadrant | BADHDUFLAG | Total packets | Discarded packets |
| A | 0 | 16 | 0 |
| B | 0 | 16 | 0 |
| C | 0 | 16 | 0 |
| D | 0 | 17 | 0 |
| Quadrant | Total seconds | Saturated seconds | Saturation percentage |
|---|---|---|---|
| A | 6370 | 40 | 0.627943% |
| B | 6370 | 45 | 0.706436% |
| C | 6370 | 208 | 3.265306% |
| D | 6370 | 45 | 0.706436% |
Noise dominated data is calculated using 1-second bins in cleaned event files. If a bin has >2000 counts, and if more than 50% of those come from <1% of pixels, then it is considered to be noise-dominated and hence unusable.
| Quadrant | # 1 sec bins | Bins with >0 counts | Bins with >2000 counts | High rate bins dominated by noise | Noise dominated (total time) | Noise dominated (detector-on time) | Marked lightcurve |
|---|---|---|---|---|---|---|---|
| A | 7580 | 6371 | 0 | 0 | 0.00% | 0.00% | 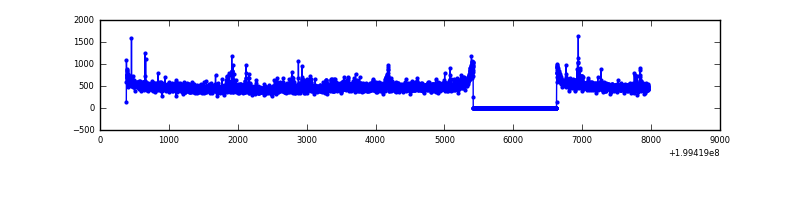 |
| B | 7580 | 6371 | 13 | 13 | 0.17% | 0.20% | 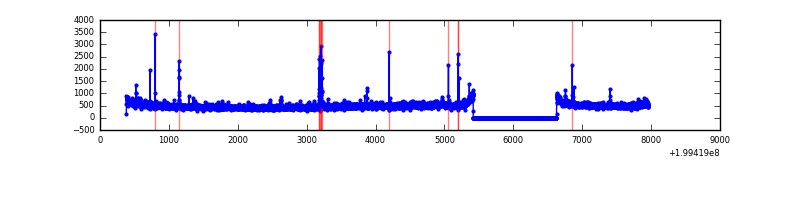 |
| C | 7580 | 6371 | 148 | 148 | 1.95% | 2.32% | 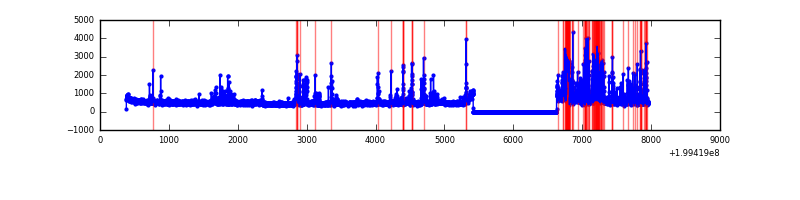 |
| D | 7580 | 6371 | 16 | 16 | 0.21% | 0.25% | 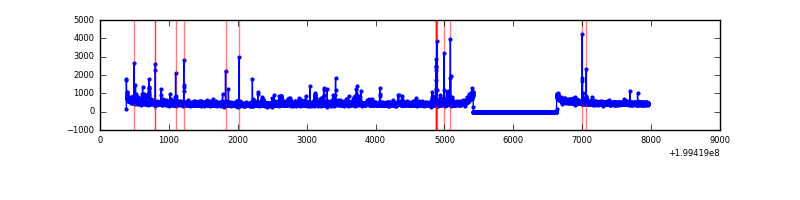 |
Top three noisy pixels from each quadrant. If the there are fewer than three noisy pixels in the level2.evt file, extra rows are filled as -1
| Pixel properties | Quadrant properties | ||||||
|---|---|---|---|---|---|---|---|
| Quadrant | DetID | PixID | Counts | Sigma | Mean | Median | Sigma |
| A | 8 | 15 | 120527 | 762.69 | 768 | 753 | 157.0 |
| A | 0 | 31 | 24670 | 152.3 | 768 | 753 | 157.0 |
| A | 0 | 226 | 8385 | 48.6 | 768 | 753 | 157.0 |
| B | 15 | 204 | 58284 | 391.43 | 778 | 761 | 147.0 |
| B | 2 | 249 | 49218 | 329.74 | 778 | 761 | 147.0 |
| B | 4 | 81 | 27011 | 178.63 | 778 | 761 | 147.0 |
| C | 14 | 234 | 412186 | 2361.06 | 750 | 756 | 174.3 |
| C | 6 | 80 | 256815 | 1469.44 | 750 | 756 | 174.3 |
| C | 14 | 223 | 135207 | 771.57 | 750 | 756 | 174.3 |
| D | 2 | 136 | 61571 | 335.19 | 754 | 734 | 181.5 |
| D | 5 | 233 | 44837 | 242.99 | 754 | 734 | 181.5 |
| D | 13 | 223 | 40218 | 217.54 | 754 | 734 | 181.5 |
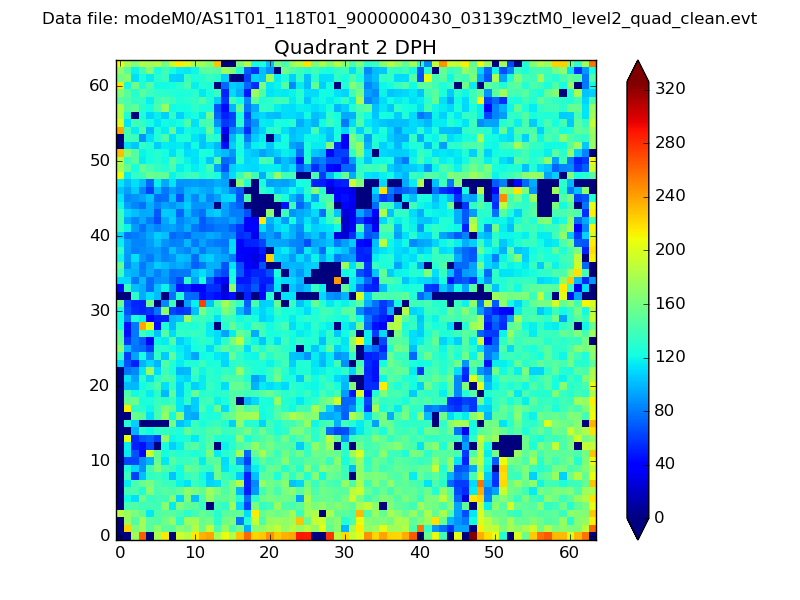
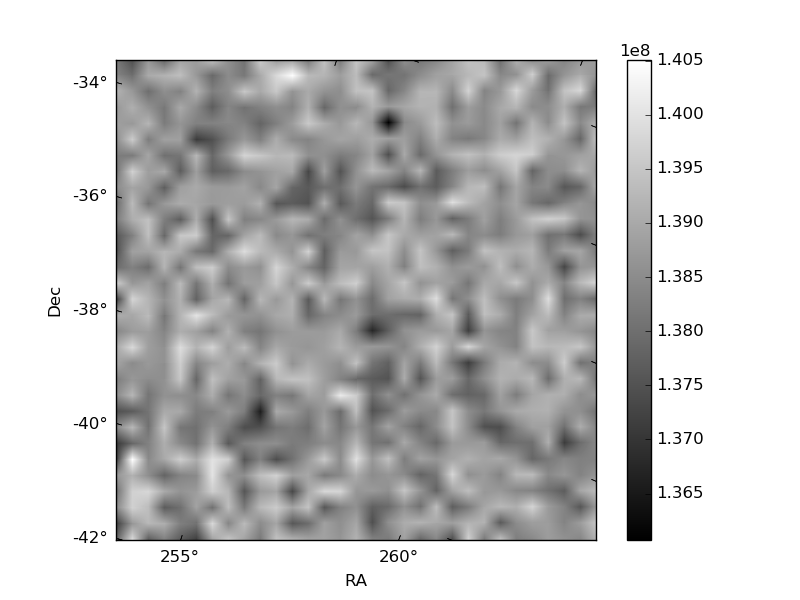
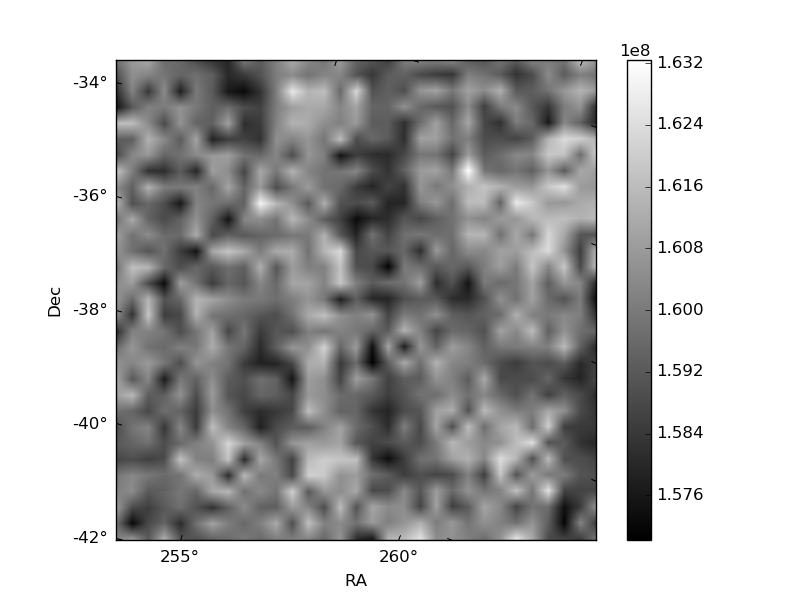
Histogram calculated using DETX and DETY for each event in the final _common_clean file
| Quadrant A | 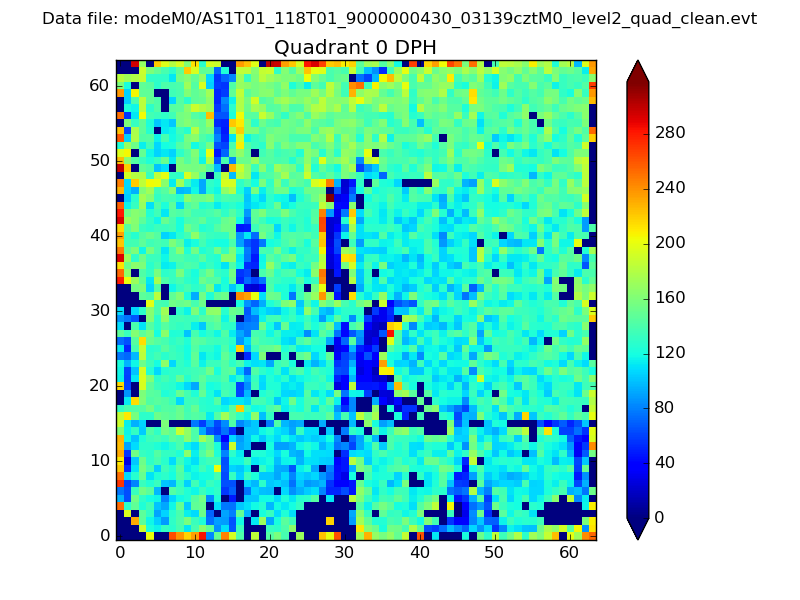 |
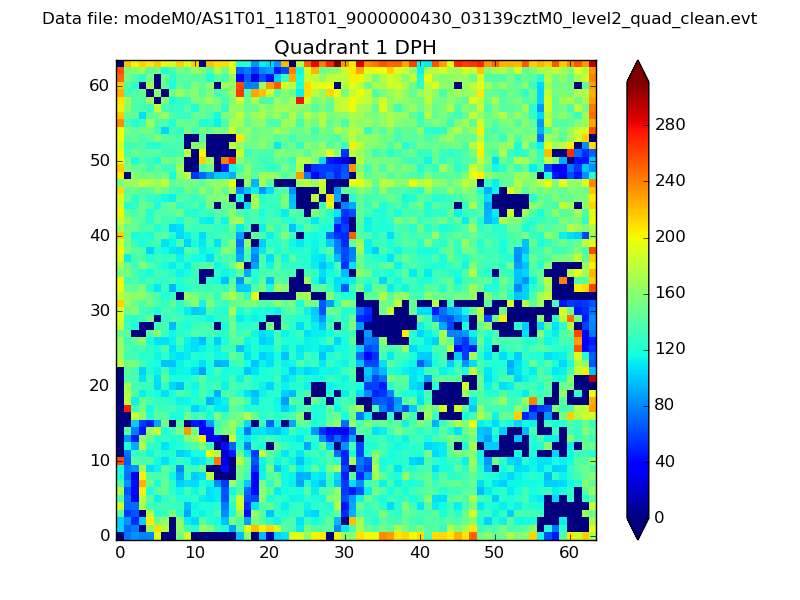 |
Quadrant B |
|---|---|---|---|
| Quadrant D | 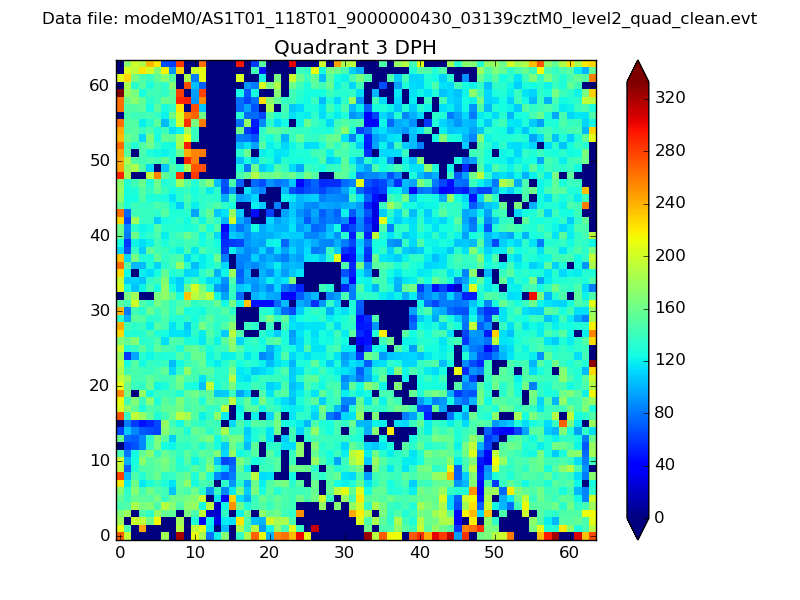 |
 |
Quadrant C |
| Plot type | Count rate plots | Images |
|---|---|---|
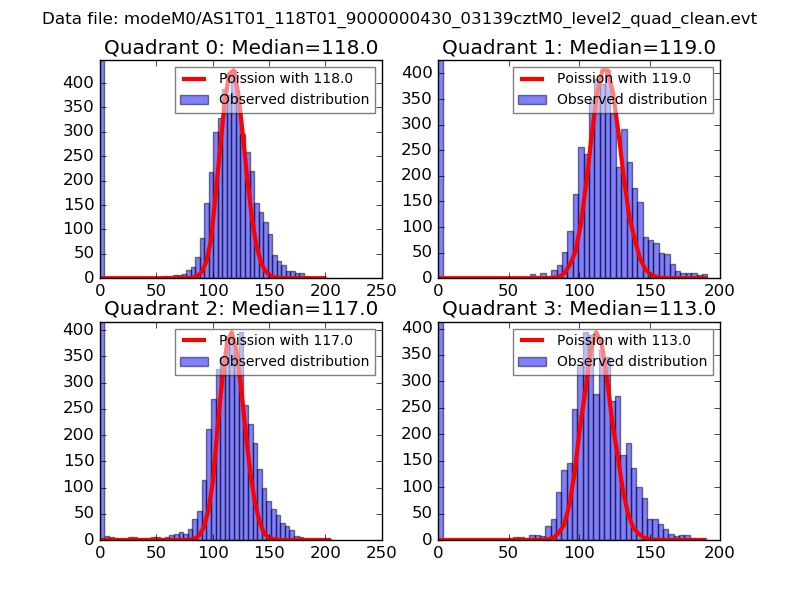
| Comparison with Poisson distribution Blue bars denote a histogram of data divided into 1 sec bins. Red curve is a Poisson curve with rate = median count rate of data. |
 |
 |
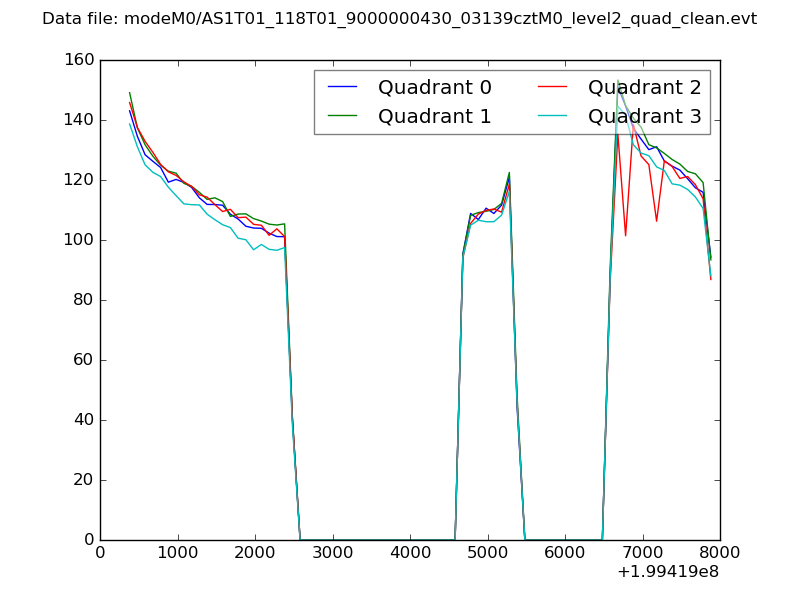
| Quadrant-wise count rates Data is divided into 100 sec bins |
 |
|
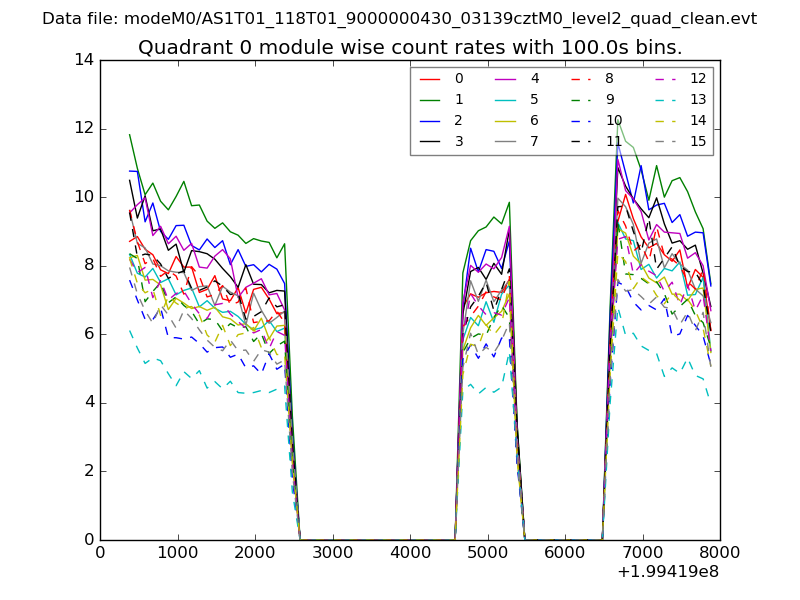
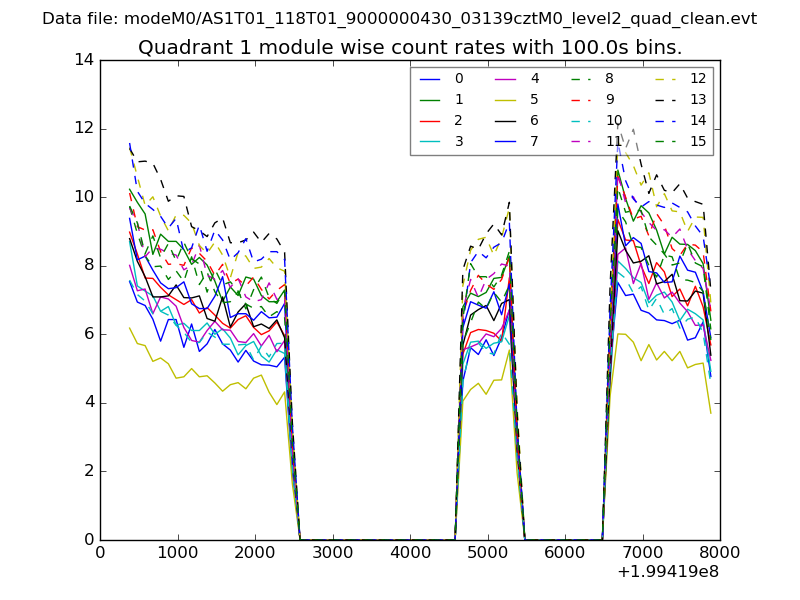
| Module-wise count rates for Quadrant A Data is divided into 100 sec bins |
 |
 |
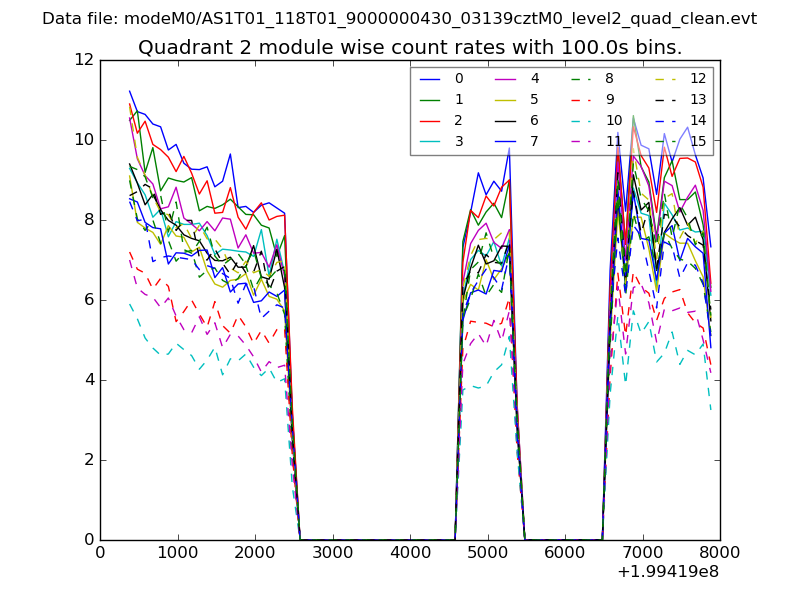
| Module-wise count rates for Quadrant B Data is divided into 100 sec bins |
 |
 |
| Module-wise count rates for Quadrant C Data is divided into 100 sec bins |
 |
 |
| Module-wise count rates for Quadrant D Data is divided into 100 sec bins |
 |
 |
| Parameter | Plot |
|---|---|
| CZT HV Monitor | 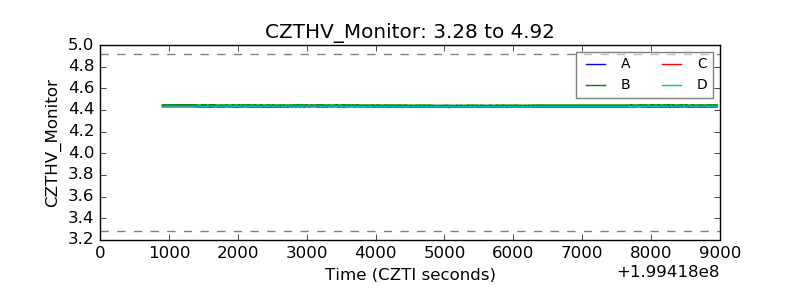 |
| D_VDD | 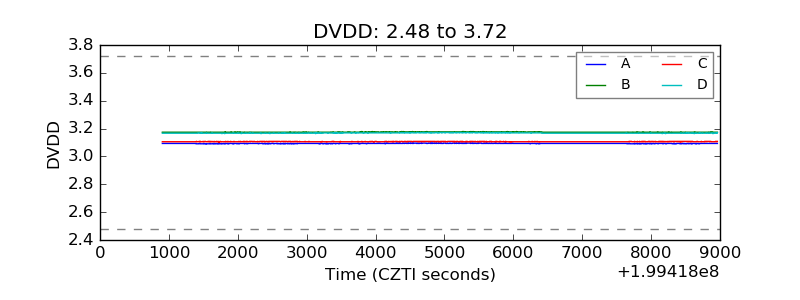 |
| Temperature 1 |  |
| Veto HV Monitor | 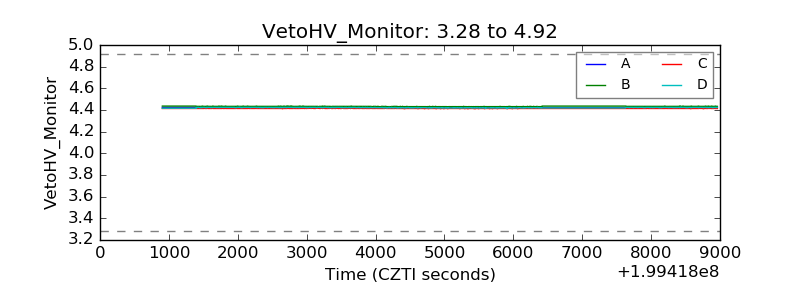 |
| Veto LLD | 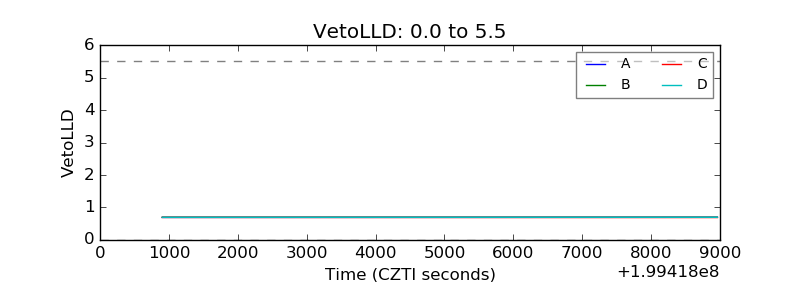 |
| Alpha Counter | 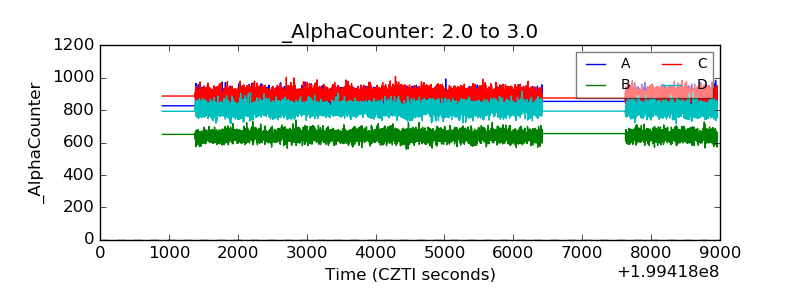 |
| _CPM_Rate | 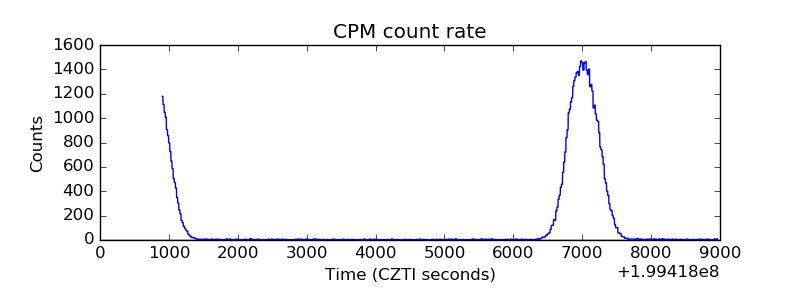 |
| CZT Counter | 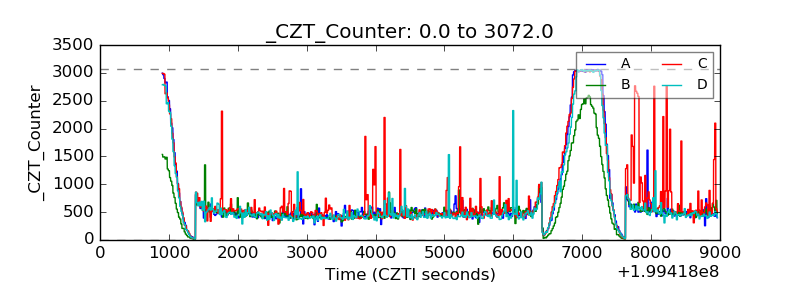 |
| +2.5 Volts monitor |  |
| +5 Volts monitor | 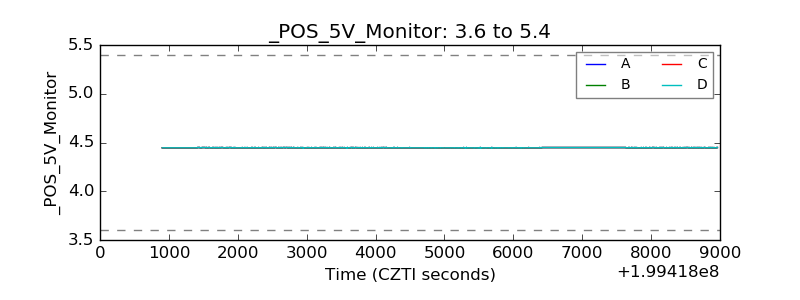 |
| _ROLL_ROT | 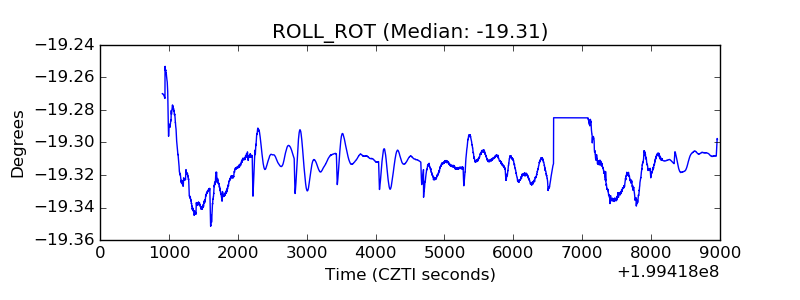 |
| _Roll_DEC |  |
| _Roll_RA | 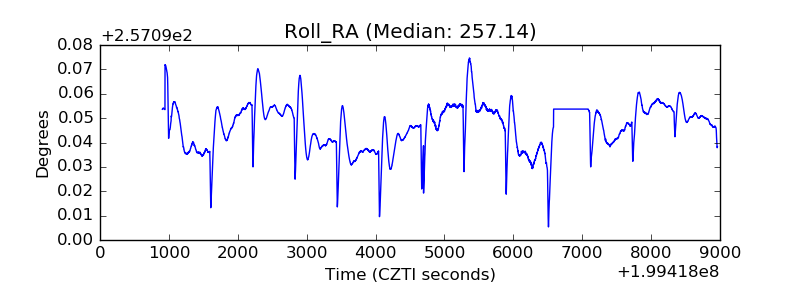 |
| Veto Counter | 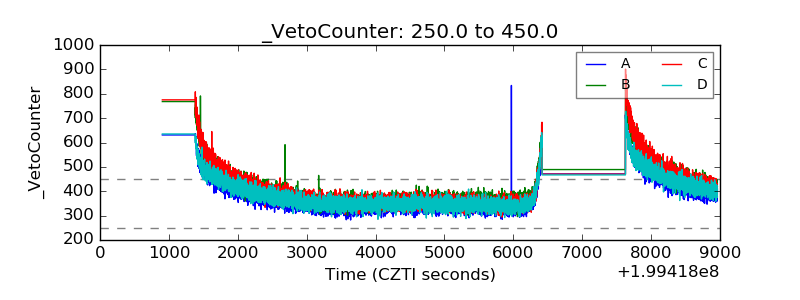 |