| Param | Original file | Final file |
|---|---|---|
| Filename | modeM0/AS1T01_118T01_9000000430_03140cztM0_level2.evt | modeM0/AS1T01_118T01_9000000430_03140cztM0_level2_quad_clean.evt |
| Size (bytes) | 482,561,280 | 81,429,120 |
| Size | 460.2 MB | 77.7 MB |
| Events in quadrant A | 3,113,772 | 514,515 |
| Events in quadrant B | 3,311,761 | 522,322 |
| Events in quadrant C | 4,490,452 | 498,374 |
| Events in quadrant D | 3,270,533 | 490,606 |
| Mode SS | |||
|---|---|---|---|
| Quadrant | BADHDUFLAG | Total packets | Discarded packets |
| A | 0 | 128 | 0 |
| B | 0 | 128 | 0 |
| C | 0 | 128 | 0 |
| D | 0 | 128 | 0 |
| Mode M0 | |||
|---|---|---|---|
| Quadrant | BADHDUFLAG | Total packets | Discarded packets |
| A | 0 | 13146 | 3 |
| B | 0 | 13557 | 2 |
| C | 0 | 17403 | 2 |
| D | 0 | 13866 | 2 |
| Mode M9 | |||
|---|---|---|---|
| Quadrant | BADHDUFLAG | Total packets | Discarded packets |
| A | 0 | 18 | 0 |
| B | 0 | 18 | 0 |
| C | 0 | 18 | 0 |
| D | 0 | 19 | 0 |
| Quadrant | Total seconds | Saturated seconds | Saturation percentage |
|---|---|---|---|
| A | 6304 | 39 | 0.618655% |
| B | 6304 | 49 | 0.777284% |
| C | 6304 | 280 | 4.441624% |
| D | 6304 | 84 | 1.332487% |
Noise dominated data is calculated using 1-second bins in cleaned event files. If a bin has >2000 counts, and if more than 50% of those come from <1% of pixels, then it is considered to be noise-dominated and hence unusable.
| Quadrant | # 1 sec bins | Bins with >0 counts | Bins with >2000 counts | High rate bins dominated by noise | Noise dominated (total time) | Noise dominated (detector-on time) | Marked lightcurve |
|---|---|---|---|---|---|---|---|
| A | 7594 | 6305 | 1 | 1 | 0.01% | 0.02% | 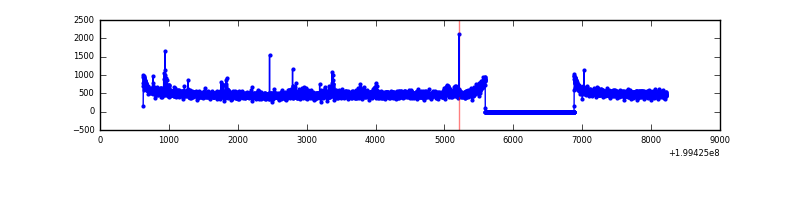 |
| B | 7594 | 6305 | 5 | 5 | 0.07% | 0.08% | 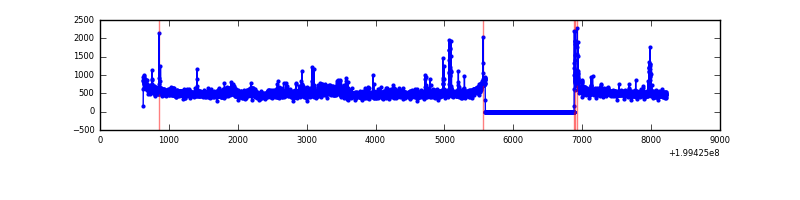 |
| C | 7594 | 6305 | 200 | 200 | 2.63% | 3.17% | 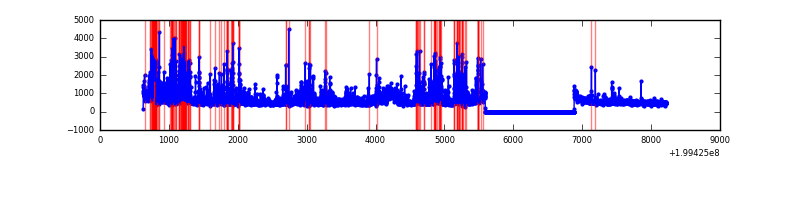 |
| D | 7594 | 6305 | 23 | 23 | 0.30% | 0.36% | 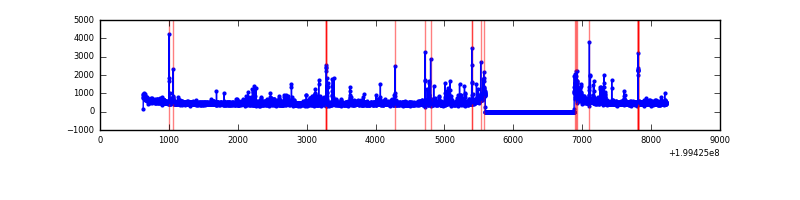 |
Top three noisy pixels from each quadrant. If the there are fewer than three noisy pixels in the level2.evt file, extra rows are filled as -1
| Pixel properties | Quadrant properties | ||||||
|---|---|---|---|---|---|---|---|
| Quadrant | DetID | PixID | Counts | Sigma | Mean | Median | Sigma |
| A | 8 | 15 | 51658 | 319.4 | 785 | 768 | 159.3 |
| A | 0 | 149 | 13750 | 81.48 | 785 | 768 | 159.3 |
| A | 0 | 31 | 12652 | 74.59 | 785 | 768 | 159.3 |
| B | 15 | 204 | 102667 | 680.6 | 791 | 772 | 149.7 |
| B | 5 | 70 | 62327 | 411.15 | 791 | 772 | 149.7 |
| B | 3 | 0 | 27100 | 175.86 | 791 | 772 | 149.7 |
| C | 14 | 234 | 525644 | 2981.81 | 758 | 763 | 176.0 |
| C | 14 | 223 | 418150 | 2371.15 | 758 | 763 | 176.0 |
| C | 0 | 219 | 275126 | 1558.64 | 758 | 763 | 176.0 |
| D | 2 | 136 | 129411 | 697.06 | 766 | 746 | 184.6 |
| D | 12 | 233 | 70747 | 379.24 | 766 | 746 | 184.6 |
| D | 13 | 223 | 46401 | 247.34 | 766 | 746 | 184.6 |
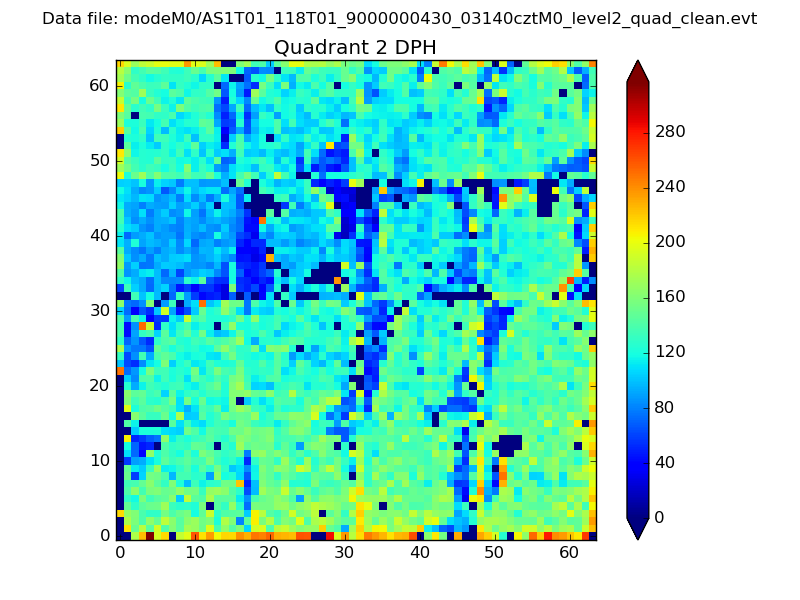
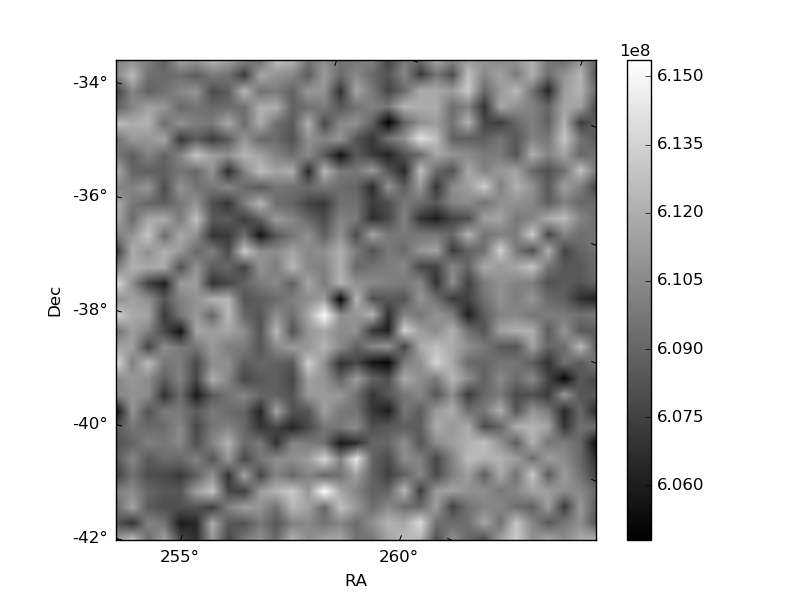
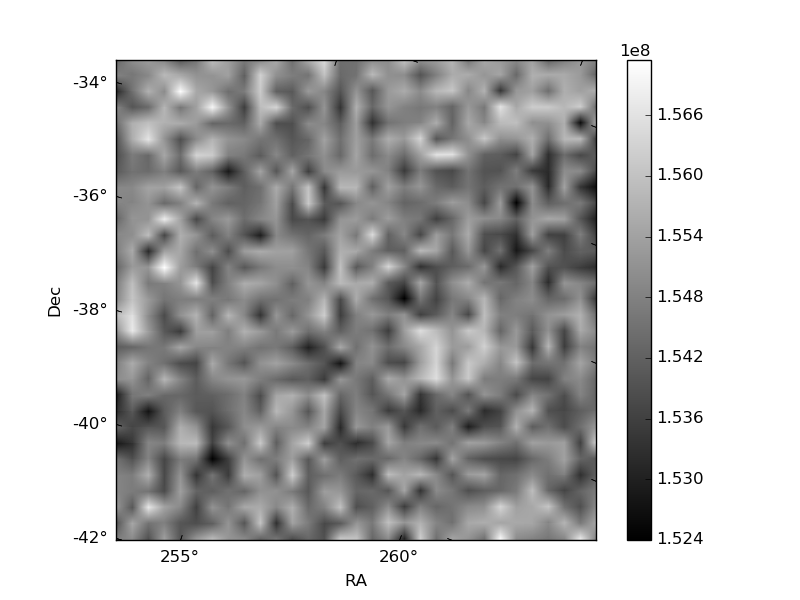
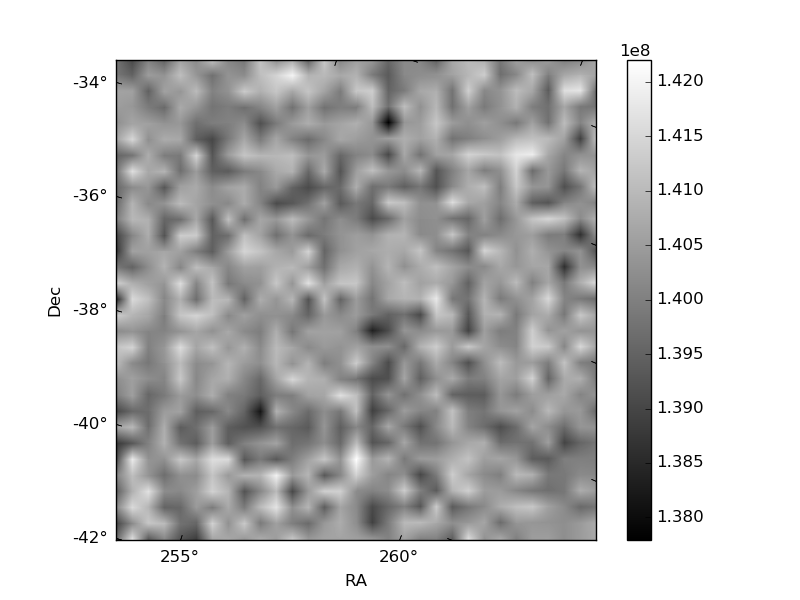
Histogram calculated using DETX and DETY for each event in the final _common_clean file
| Quadrant A | 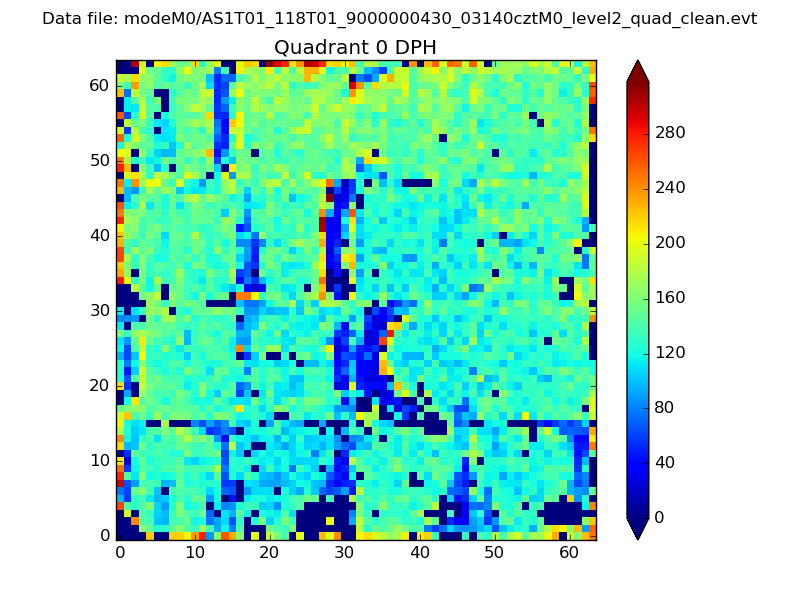 |
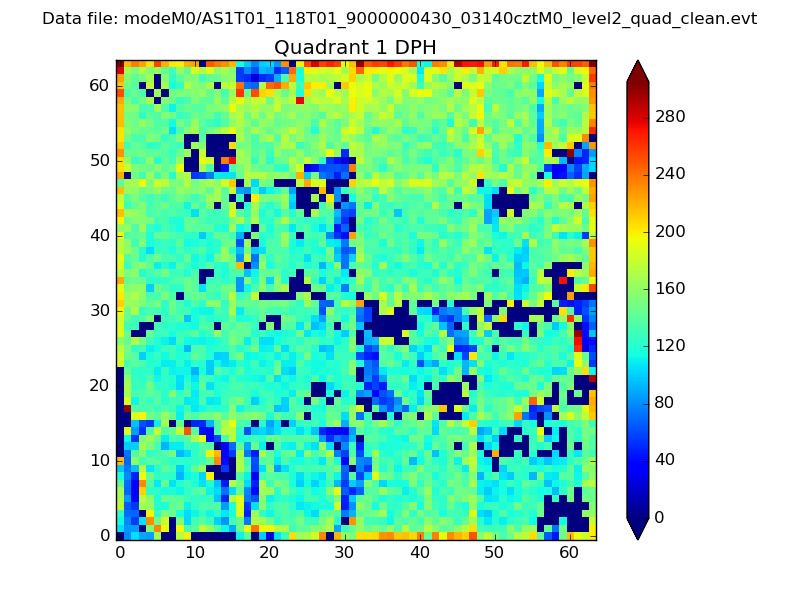 |
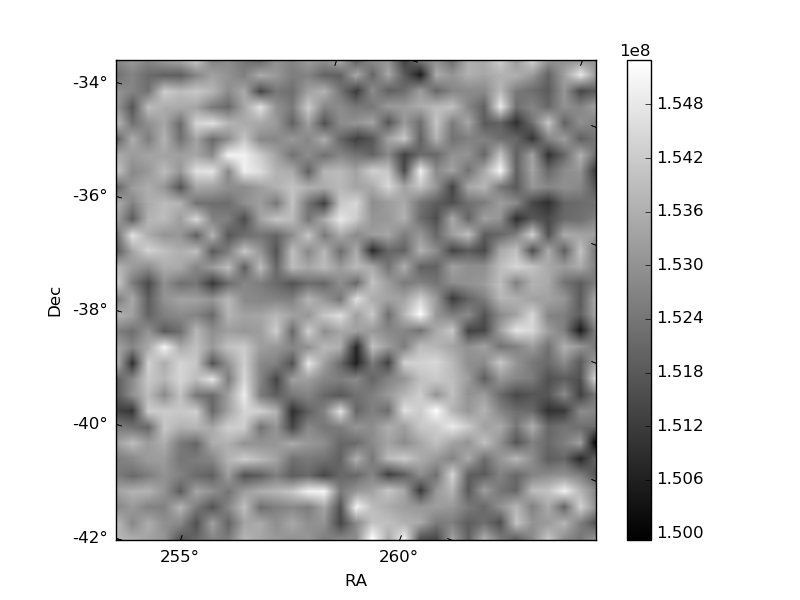
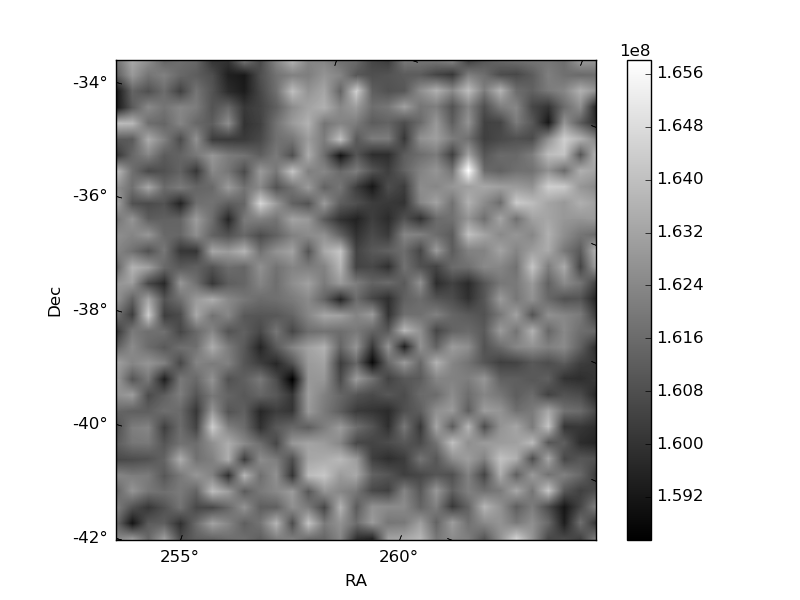
Quadrant B |
|---|---|---|---|
| Quadrant D | 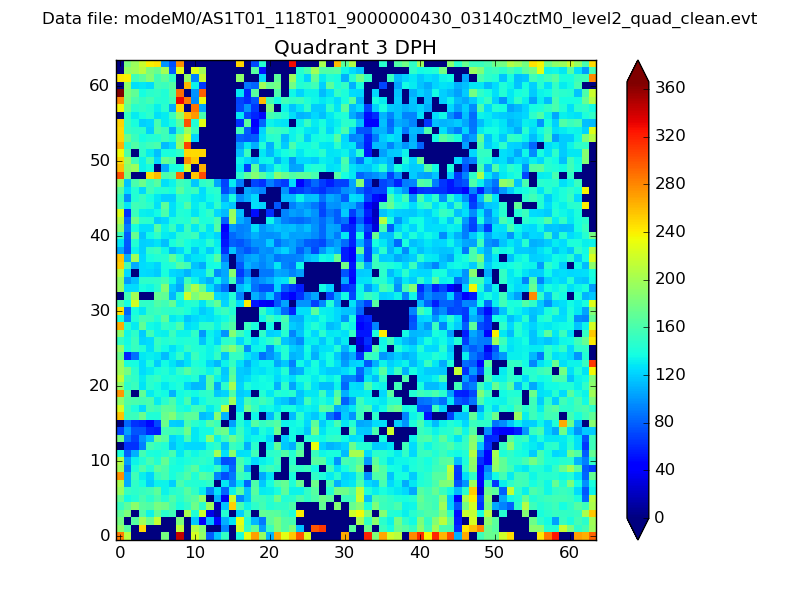 |
 |
Quadrant C |
| Plot type | Count rate plots | Images |
|---|---|---|
| Comparison with Poisson distribution Blue bars denote a histogram of data divided into 1 sec bins. Red curve is a Poisson curve with rate = median count rate of data. |
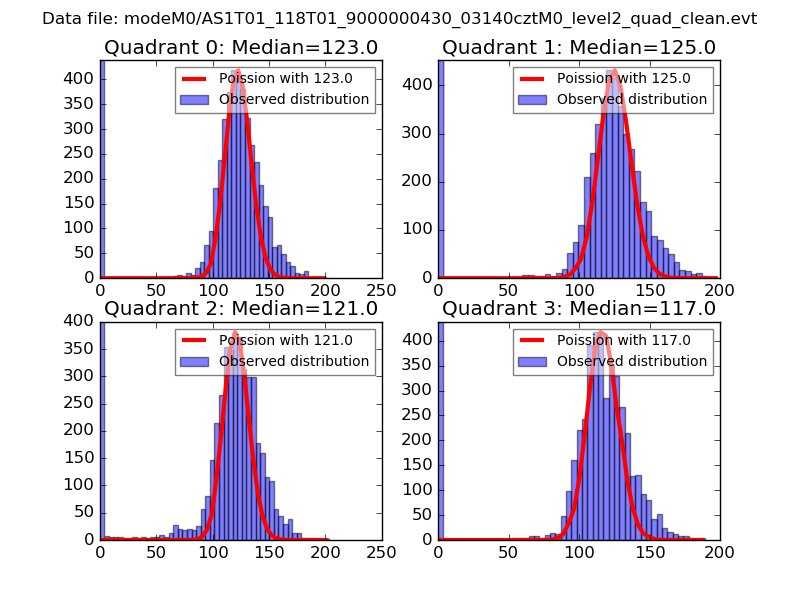 |
 |
| Quadrant-wise count rates Data is divided into 100 sec bins |
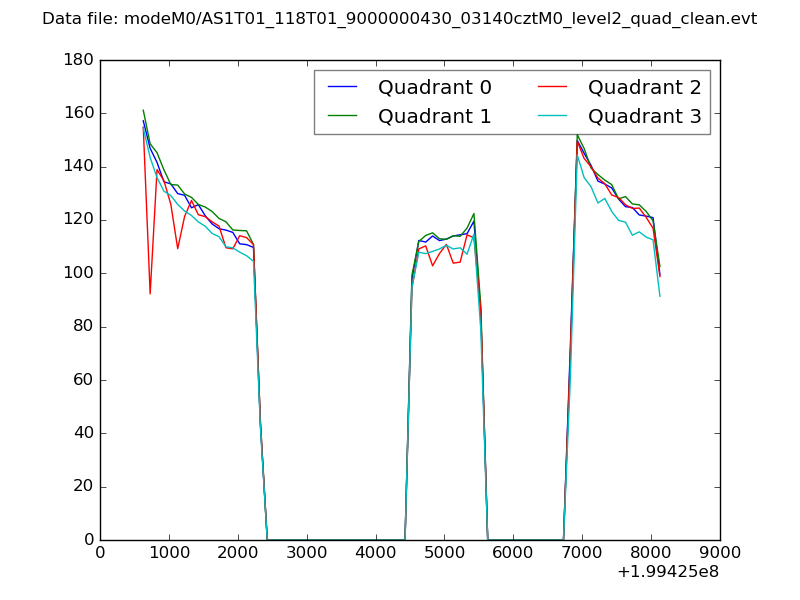 |
|
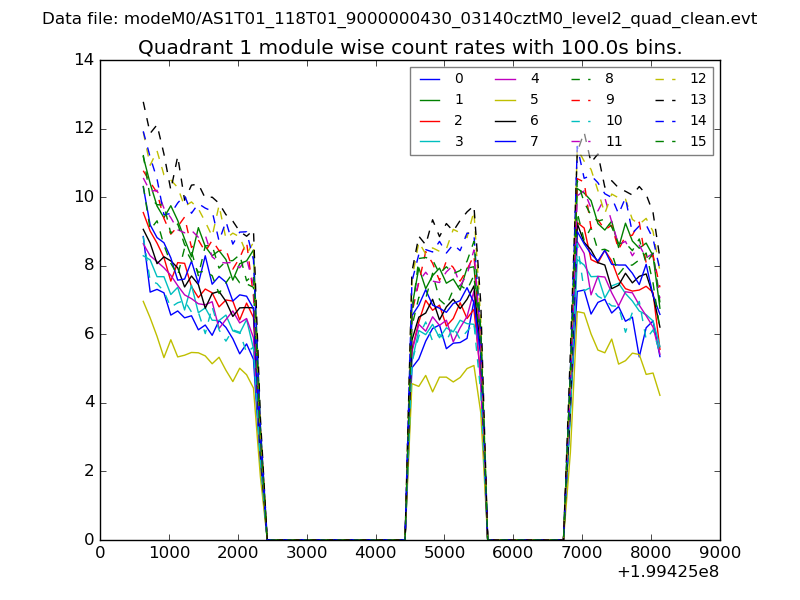
| Module-wise count rates for Quadrant A Data is divided into 100 sec bins |
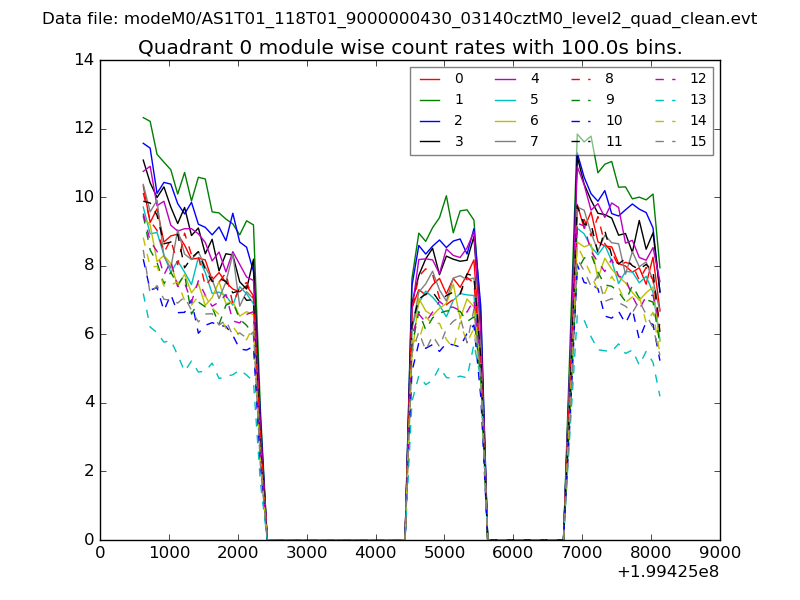 |
 |
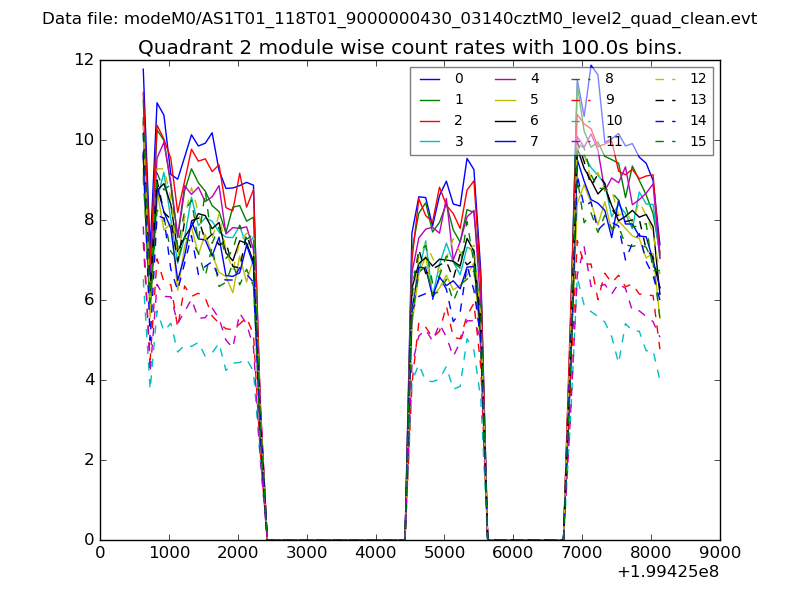
| Module-wise count rates for Quadrant B Data is divided into 100 sec bins |
 |
 |
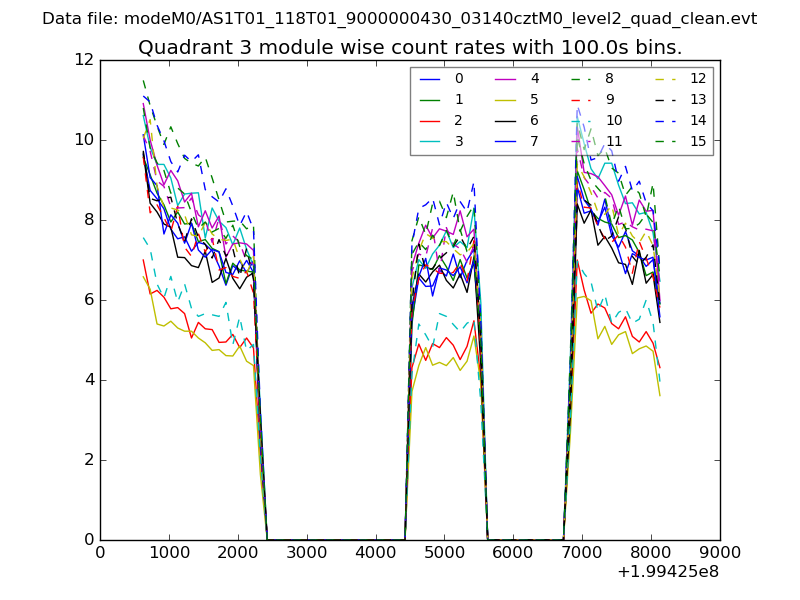
| Module-wise count rates for Quadrant C Data is divided into 100 sec bins |
 |
 |
| Module-wise count rates for Quadrant D Data is divided into 100 sec bins |
 |
 |
| Parameter | Plot |
|---|---|
| CZT HV Monitor | 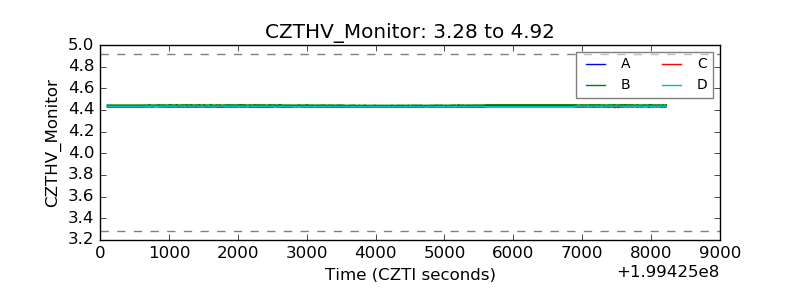 |
| D_VDD | 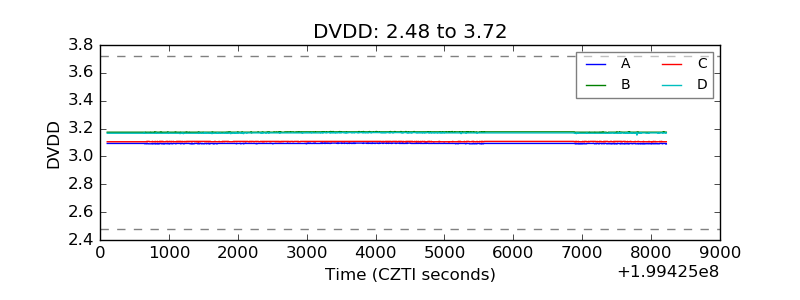 |
| Temperature 1 | 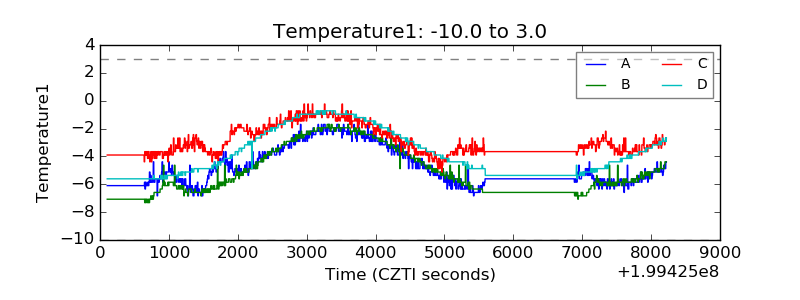 |
| Veto HV Monitor | 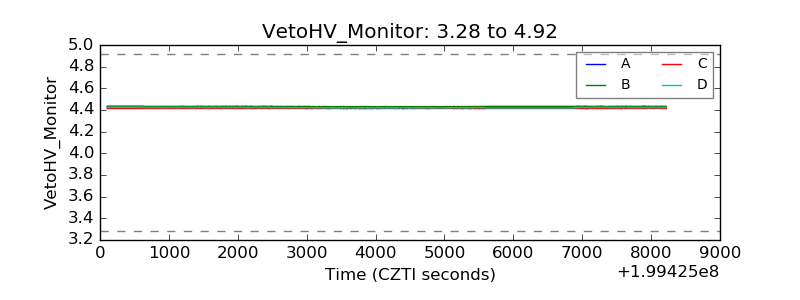 |
| Veto LLD | 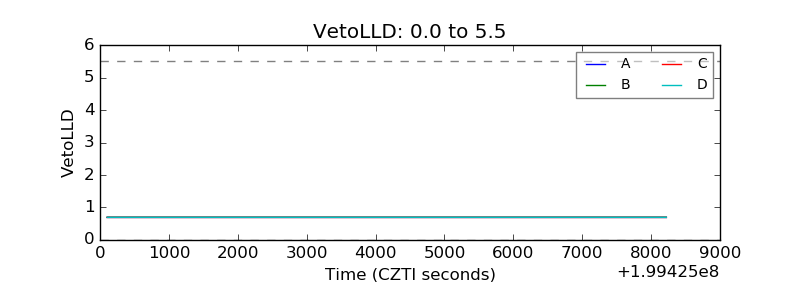 |
| Alpha Counter | 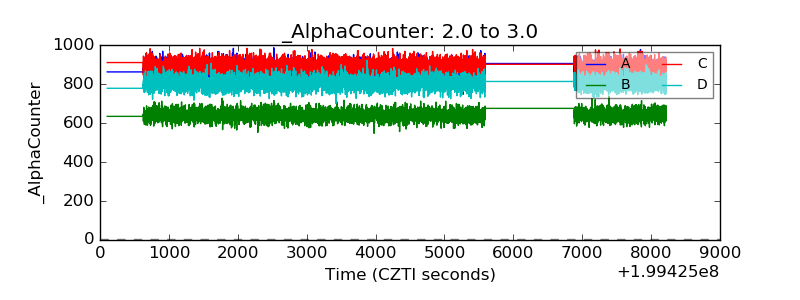 |
| _CPM_Rate | 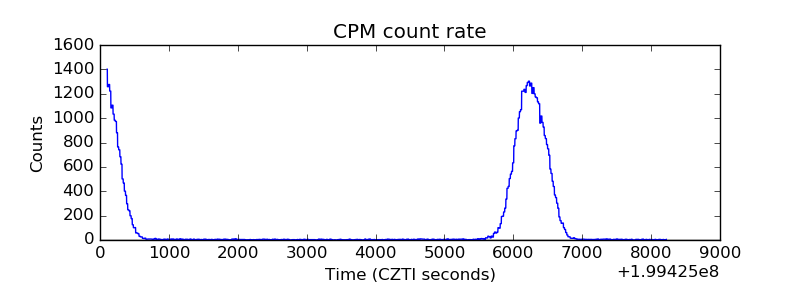 |
| CZT Counter | 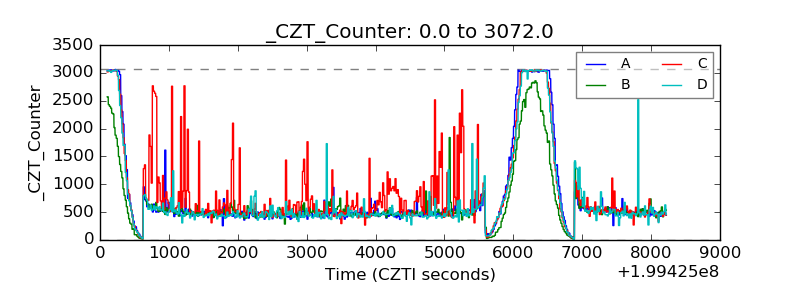 |
| +2.5 Volts monitor |  |
| +5 Volts monitor |  |
| _ROLL_ROT | 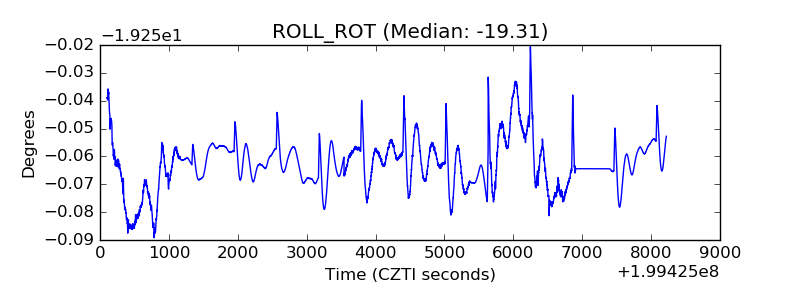 |
| _Roll_DEC | 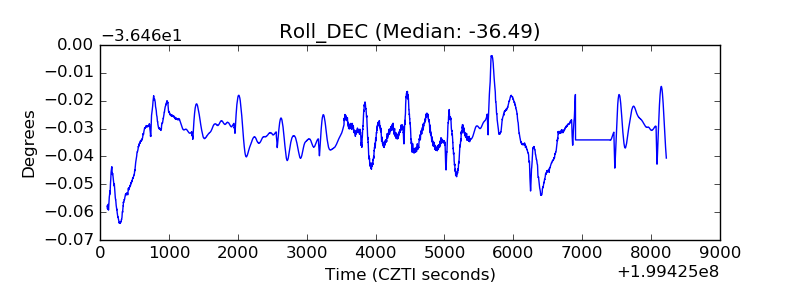 |
| _Roll_RA | 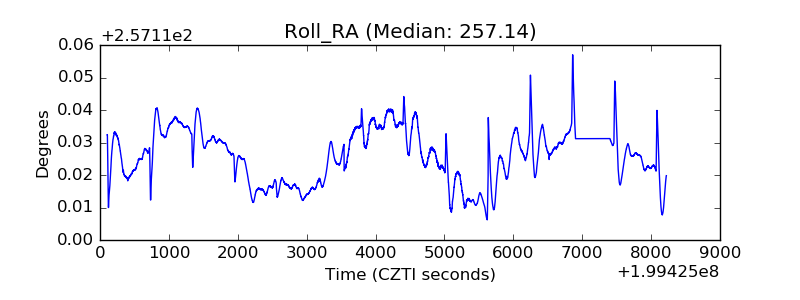 |
| Veto Counter | 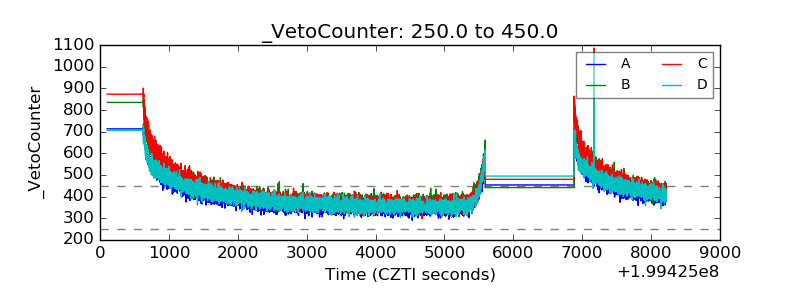 |