| Param | Original file | Final file |
|---|---|---|
| Filename | modeM0/AS1T01_118T01_9000000430_03142cztM0_level2.evt | modeM0/AS1T01_118T01_9000000430_03142cztM0_level2_quad_clean.evt |
| Size (bytes) | 418,181,760 | 61,375,680 |
| Size | 398.8 MB | 58.5 MB |
| Events in quadrant A | 2,955,686 | 362,713 |
| Events in quadrant B | 3,007,077 | 365,131 |
| Events in quadrant C | 3,024,252 | 362,440 |
| Events in quadrant D | 3,264,658 | 343,957 |
| Mode SS | |||
|---|---|---|---|
| Quadrant | BADHDUFLAG | Total packets | Discarded packets |
| A | 0 | 124 | 0 |
| B | 0 | 124 | 0 |
| C | 0 | 124 | 0 |
| D | 0 | 124 | 0 |
| Mode M0 | |||
|---|---|---|---|
| Quadrant | BADHDUFLAG | Total packets | Discarded packets |
| A | 0 | 12798 | 2 |
| B | 0 | 12833 | 1 |
| C | 0 | 12970 | 1 |
| D | 0 | 13818 | 1 |
| Mode M9 | |||
|---|---|---|---|
| Quadrant | BADHDUFLAG | Total packets | Discarded packets |
| A | 0 | 11 | 0 |
| B | 0 | 11 | 0 |
| C | 0 | 11 | 0 |
| D | 0 | 11 | 0 |
| Quadrant | Total seconds | Saturated seconds | Saturation percentage |
|---|---|---|---|
| A | 6072 | 155 | 2.552701% |
| B | 6072 | 133 | 2.190382% |
| C | 6049 | 111 | 1.835014% |
| D | 6072 | 194 | 3.194993% |
Noise dominated data is calculated using 1-second bins in cleaned event files. If a bin has >2000 counts, and if more than 50% of those come from <1% of pixels, then it is considered to be noise-dominated and hence unusable.
| Quadrant | # 1 sec bins | Bins with >0 counts | Bins with >2000 counts | High rate bins dominated by noise | Noise dominated (total time) | Noise dominated (detector-on time) | Marked lightcurve |
|---|---|---|---|---|---|---|---|
| A | 7202 | 6072 | 7 | 7 | 0.10% | 0.12% | 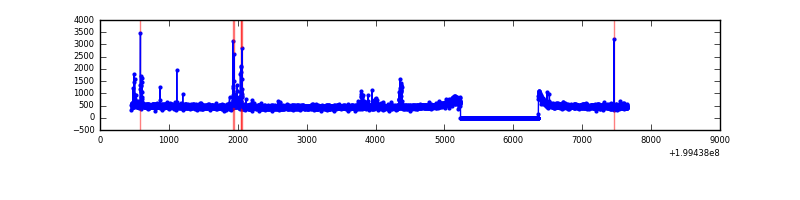 |
| B | 7202 | 6072 | 2 | 2 | 0.03% | 0.03% | 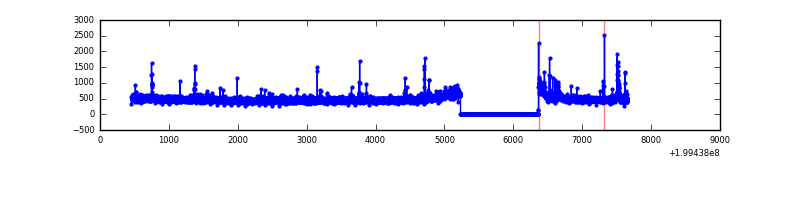 |
| C | 7202 | 6050 | 5 | 5 | 0.07% | 0.08% | 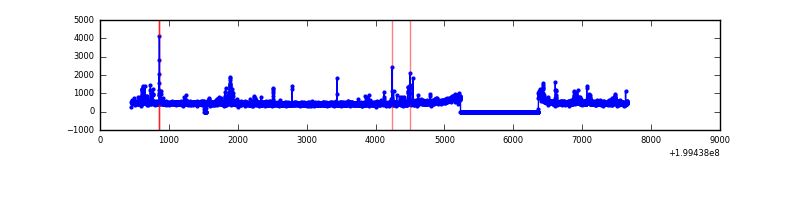 |
| D | 7202 | 6072 | 54 | 54 | 0.75% | 0.89% | 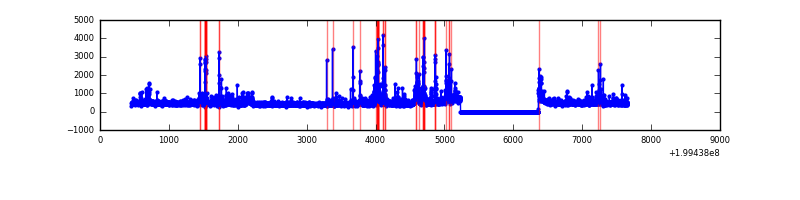 |
Top three noisy pixels from each quadrant. If the there are fewer than three noisy pixels in the level2.evt file, extra rows are filled as -1
| Pixel properties | Quadrant properties | ||||||
|---|---|---|---|---|---|---|---|
| Quadrant | DetID | PixID | Counts | Sigma | Mean | Median | Sigma |
| A | 0 | 31 | 88273 | 590.1 | 737 | 722 | 148.4 |
| A | 12 | 48 | 17160 | 110.79 | 737 | 722 | 148.4 |
| A | 12 | 194 | 8166 | 50.17 | 737 | 722 | 148.4 |
| B | 2 | 249 | 48577 | 338.14 | 742 | 724 | 141.5 |
| B | 5 | 70 | 26308 | 180.78 | 742 | 724 | 141.5 |
| B | 4 | 81 | 15272 | 102.8 | 742 | 724 | 141.5 |
| C | 14 | 223 | 76772 | 458.36 | 716 | 721 | 165.9 |
| C | 1 | 16 | 51751 | 307.56 | 716 | 721 | 165.9 |
| C | 1 | 192 | 48852 | 290.09 | 716 | 721 | 165.9 |
| D | 13 | 223 | 140245 | 816.52 | 714 | 694 | 170.9 |
| D | 12 | 233 | 118883 | 691.53 | 714 | 694 | 170.9 |
| D | 2 | 136 | 92261 | 535.77 | 714 | 694 | 170.9 |
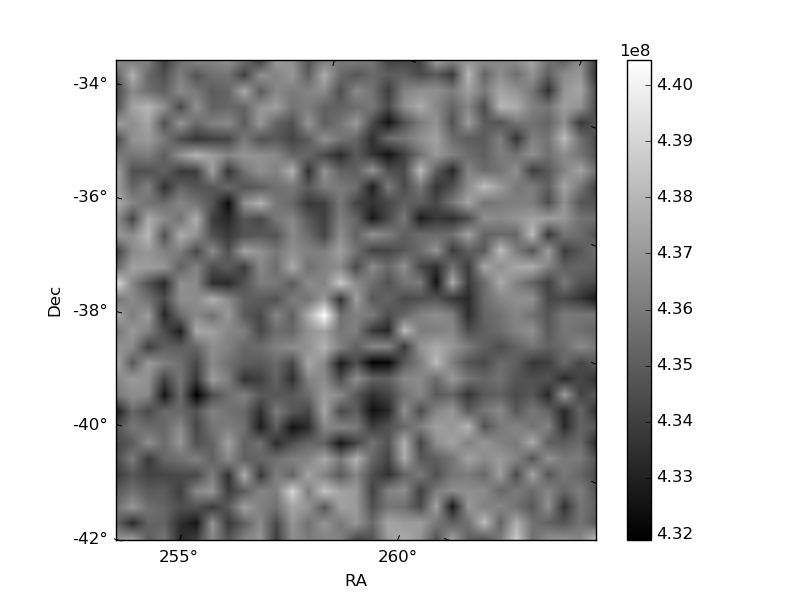
Histogram calculated using DETX and DETY for each event in the final _common_clean file
| Quadrant A | 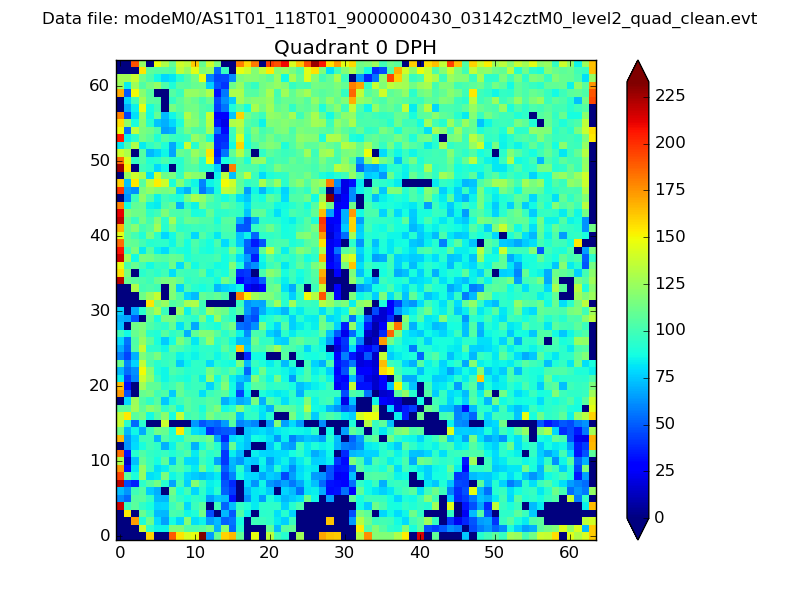 |
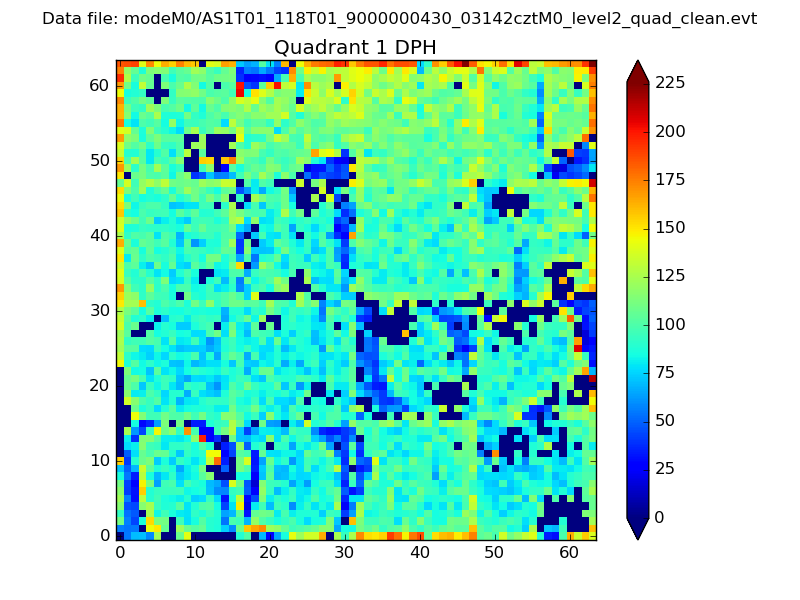 |
Quadrant B |
|---|---|---|---|
| Quadrant D | 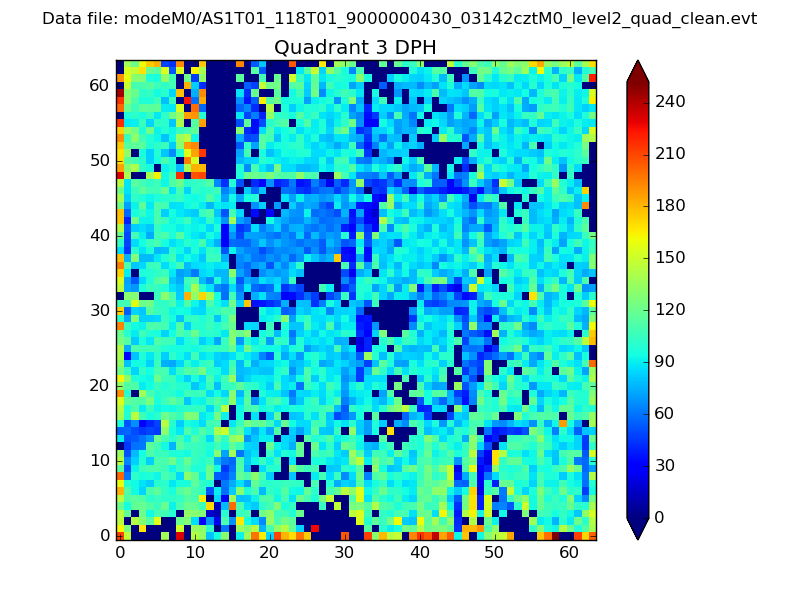 |
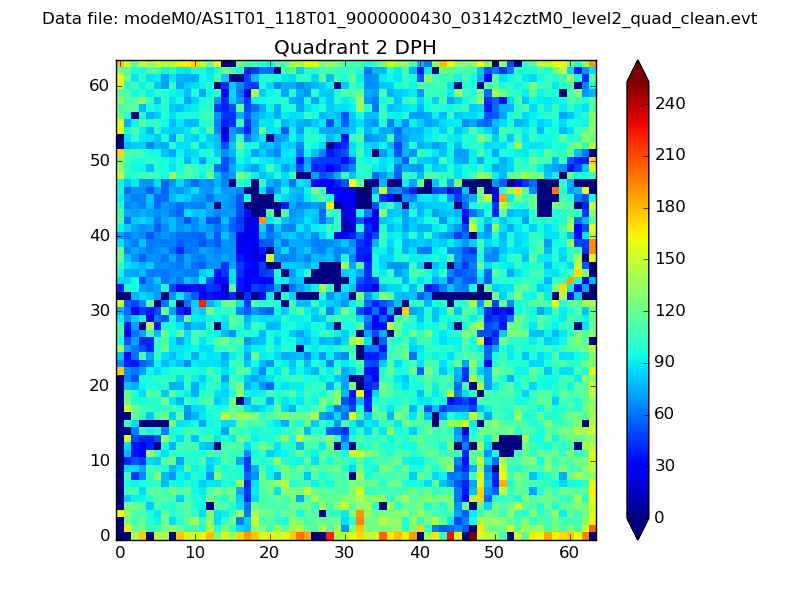 |
Quadrant C |
| Plot type | Count rate plots | Images |
|---|---|---|
| Comparison with Poisson distribution Blue bars denote a histogram of data divided into 1 sec bins. Red curve is a Poisson curve with rate = median count rate of data. |
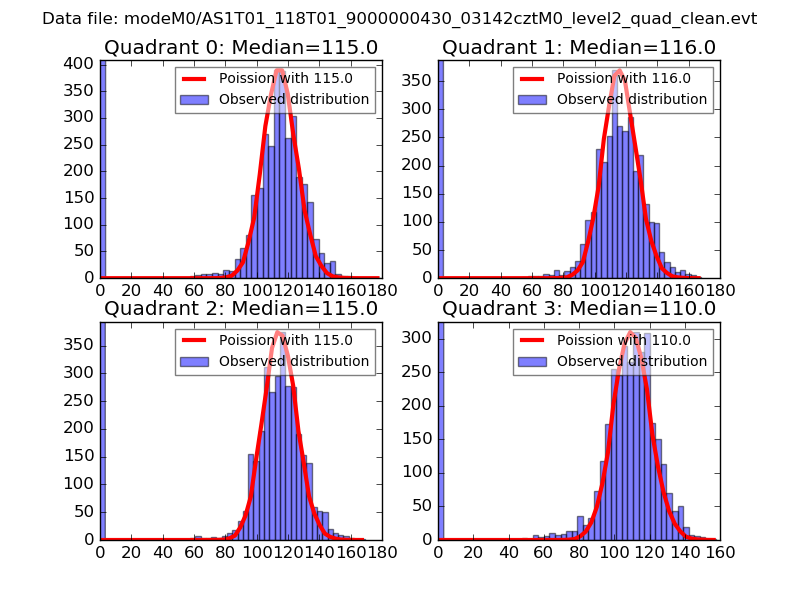 |
 |
| Quadrant-wise count rates Data is divided into 100 sec bins |
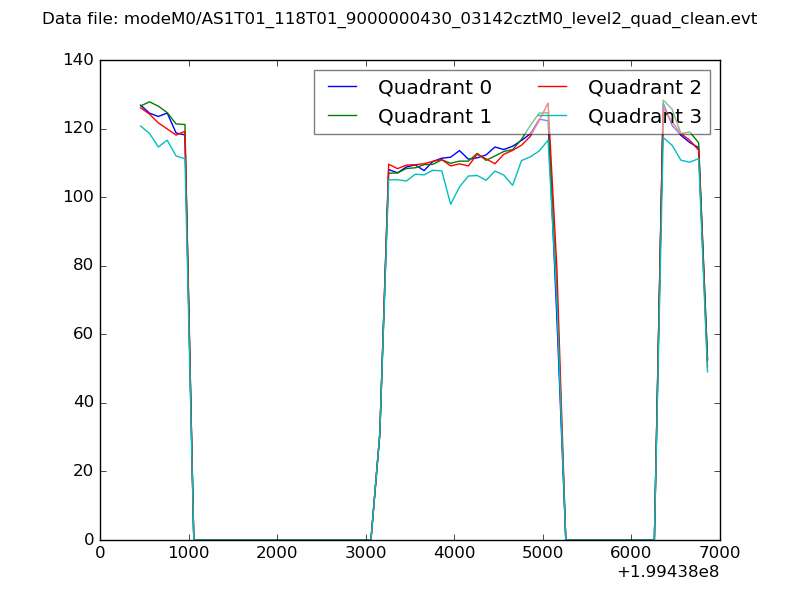 |
|
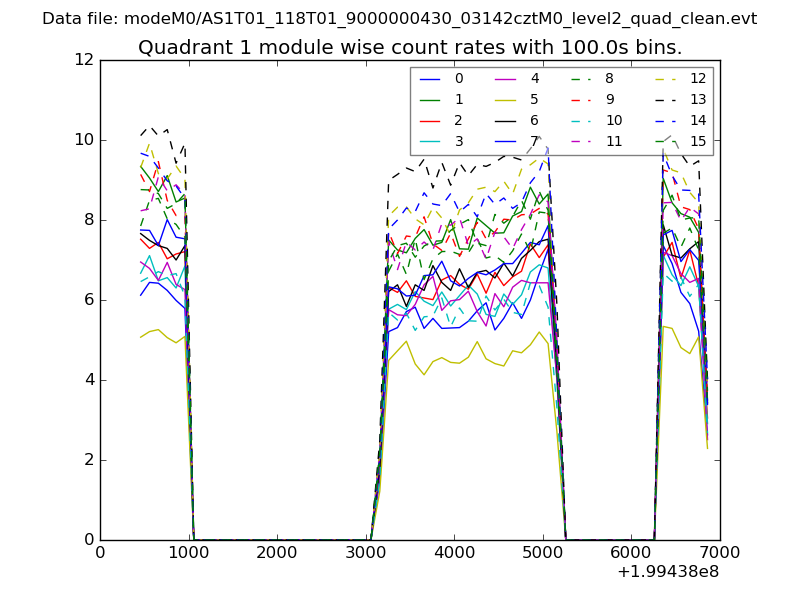
| Module-wise count rates for Quadrant A Data is divided into 100 sec bins |
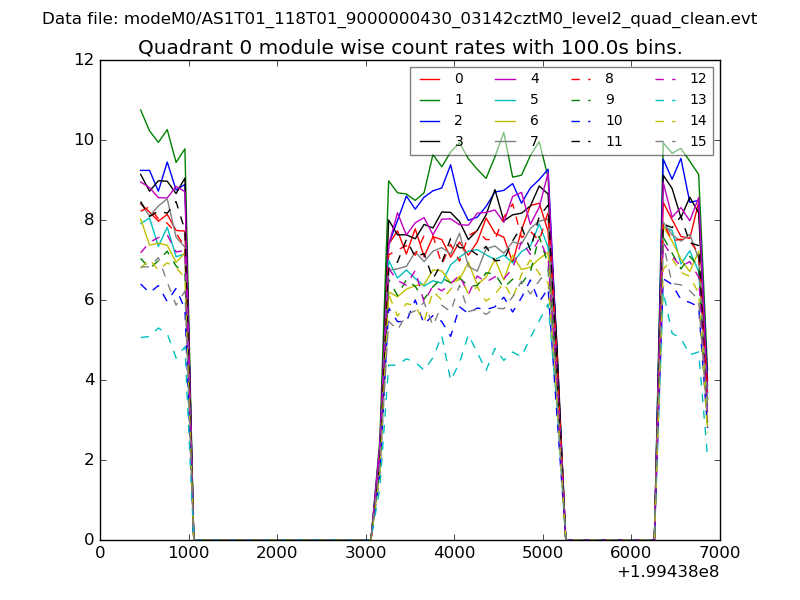 |
 |
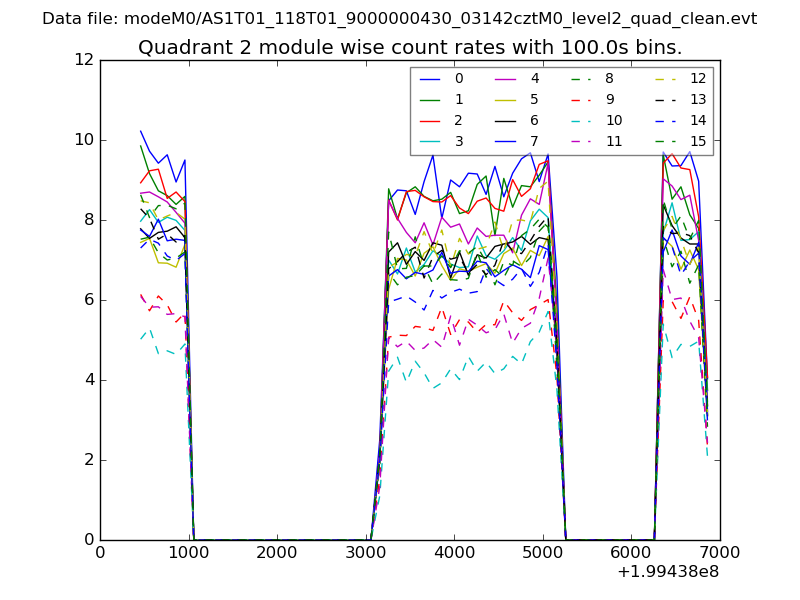
| Module-wise count rates for Quadrant B Data is divided into 100 sec bins |
 |
 |
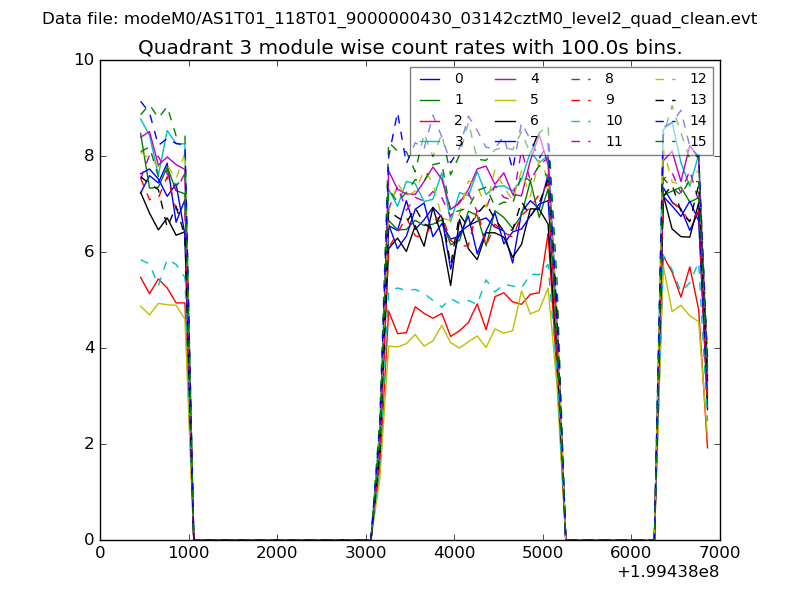
| Module-wise count rates for Quadrant C Data is divided into 100 sec bins |
 |
 |
| Module-wise count rates for Quadrant D Data is divided into 100 sec bins |
 |
 |
| Parameter | Plot |
|---|---|
| CZT HV Monitor | 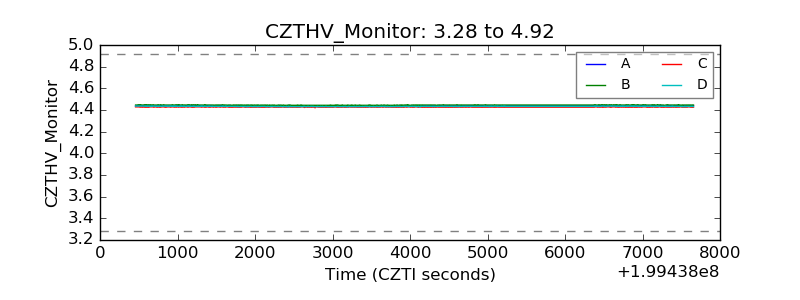 |
| D_VDD | 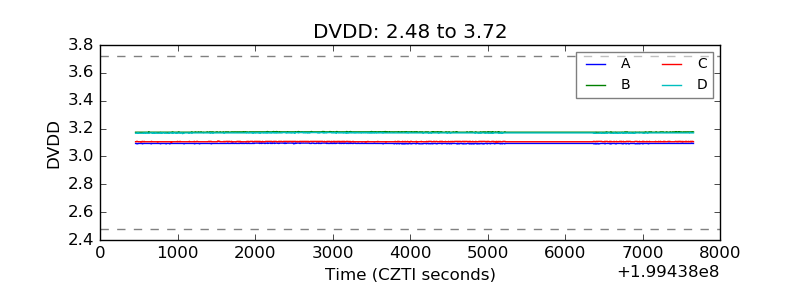 |
| Temperature 1 | 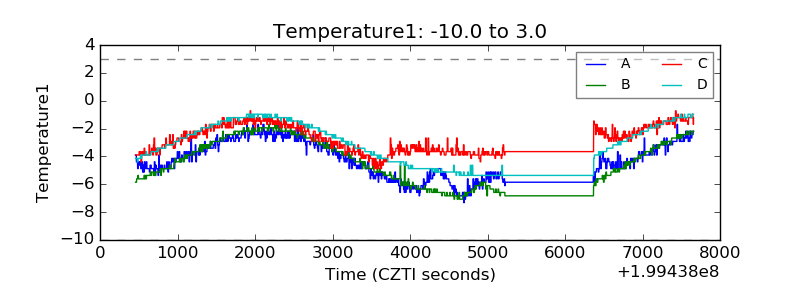 |
| Veto HV Monitor | 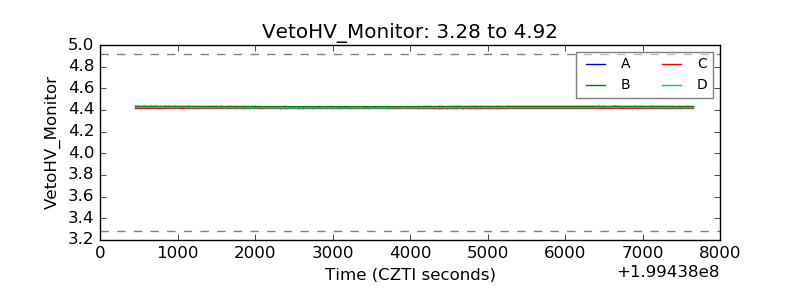 |
| Veto LLD | 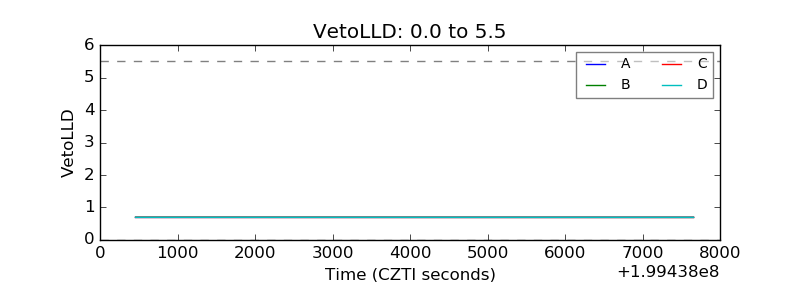 |
| Alpha Counter | 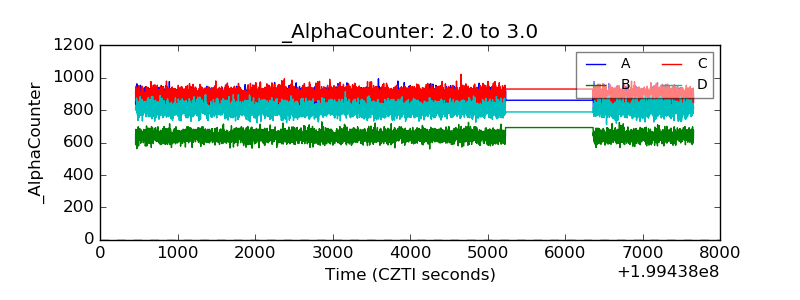 |
| _CPM_Rate | 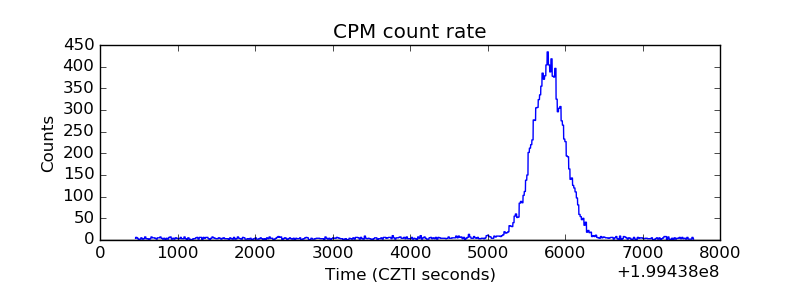 |
| CZT Counter | 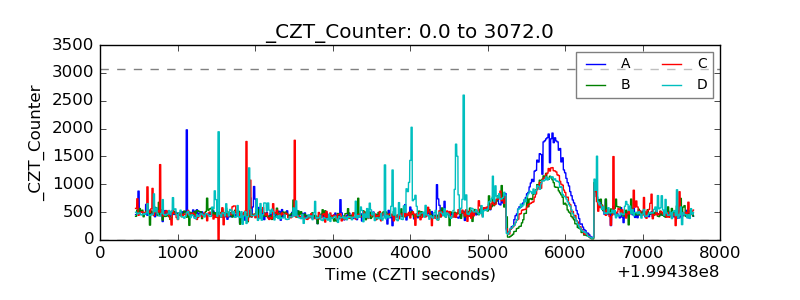 |
| +2.5 Volts monitor |  |
| +5 Volts monitor |  |
| _ROLL_ROT | 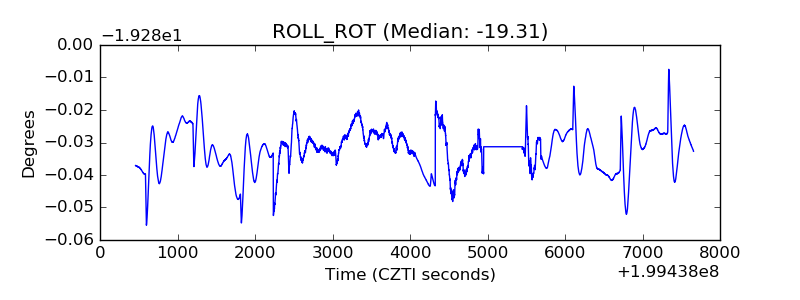 |
| _Roll_DEC | 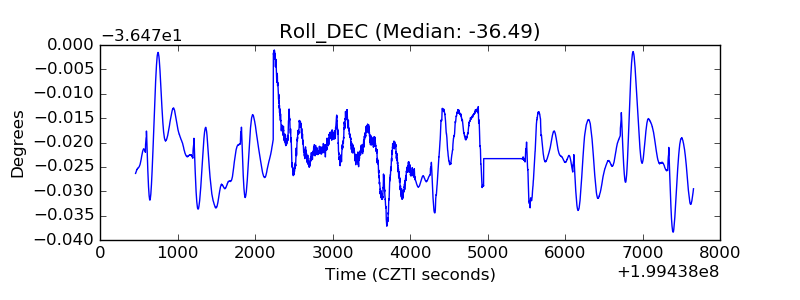 |
| _Roll_RA | 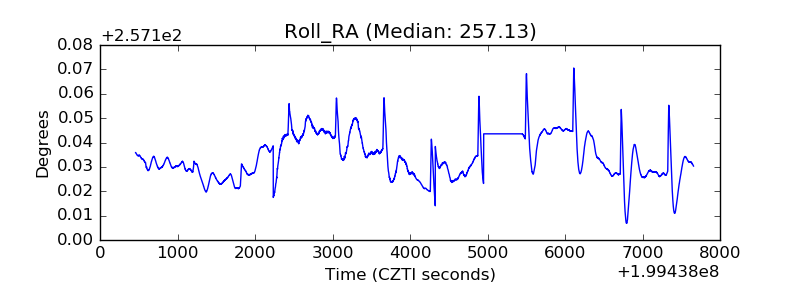 |
| Veto Counter | 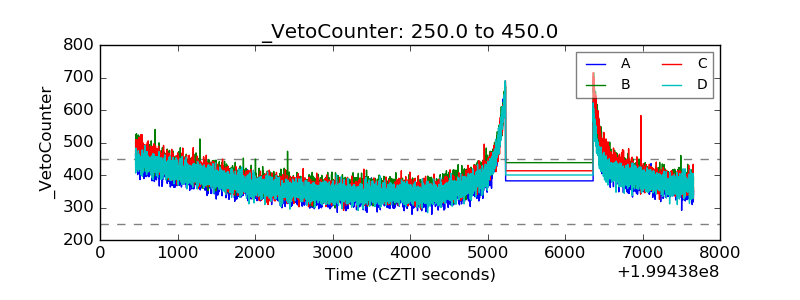 |