| Param | Original file | Final file |
|---|---|---|
| Filename | modeM0/AS1T01_118T01_9000000430_03146cztM0_level2.evt | modeM0/AS1T01_118T01_9000000430_03146cztM0_level2_quad_clean.evt |
| Size (bytes) | 573,359,040 | 74,174,400 |
| Size | 546.8 MB | 70.7 MB |
| Events in quadrant A | 3,719,644 | 431,325 |
| Events in quadrant B | 3,904,006 | 430,048 |
| Events in quadrant C | 5,254,020 | 416,628 |
| Events in quadrant D | 3,945,368 | 413,600 |
| Mode SS | |||
|---|---|---|---|
| Quadrant | BADHDUFLAG | Total packets | Discarded packets |
| A | 0 | 162 | 0 |
| B | 0 | 162 | 0 |
| C | 0 | 162 | 0 |
| D | 0 | 162 | 0 |
| Mode M0 | |||
|---|---|---|---|
| Quadrant | BADHDUFLAG | Total packets | Discarded packets |
| A | 0 | 16722 | 3 |
| B | 0 | 17078 | 2 |
| C | 0 | 21087 | 2 |
| D | 0 | 17583 | 2 |
| Mode M9 | |||
|---|---|---|---|
| Quadrant | BADHDUFLAG | Total packets | Discarded packets |
| A | 0 | 1 | 0 |
| B | 0 | 1 | 0 |
| C | 0 | 1 | 0 |
| D | 0 | 1 | 0 |
| Quadrant | Total seconds | Saturated seconds | Saturation percentage |
|---|---|---|---|
| A | 7969 | 208 | 2.610114% |
| B | 7969 | 249 | 3.124608% |
| C | 7969 | 480 | 6.023340% |
| D | 7969 | 112 | 1.405446% |
Noise dominated data is calculated using 1-second bins in cleaned event files. If a bin has >2000 counts, and if more than 50% of those come from <1% of pixels, then it is considered to be noise-dominated and hence unusable.
| Quadrant | # 1 sec bins | Bins with >0 counts | Bins with >2000 counts | High rate bins dominated by noise | Noise dominated (total time) | Noise dominated (detector-on time) | Marked lightcurve |
|---|---|---|---|---|---|---|---|
| A | 8044 | 7971 | 4 | 4 | 0.05% | 0.05% |  |
| B | 8044 | 7971 | 6 | 6 | 0.07% | 0.08% | 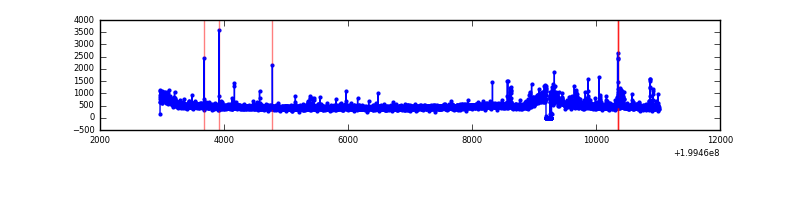 |
| C | 8044 | 7971 | 303 | 303 | 3.77% | 3.80% | 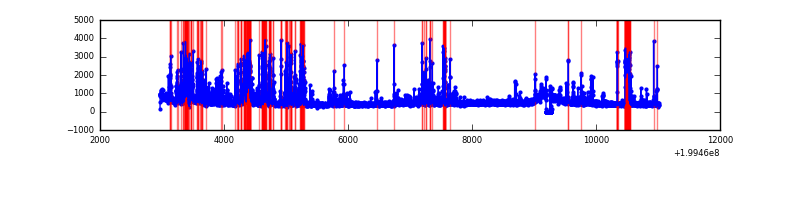 |
| D | 8044 | 7971 | 41 | 41 | 0.51% | 0.51% | 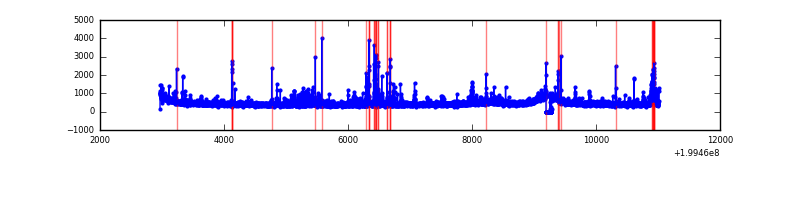 |
Top three noisy pixels from each quadrant. If the there are fewer than three noisy pixels in the level2.evt file, extra rows are filled as -1
| Pixel properties | Quadrant properties | ||||||
|---|---|---|---|---|---|---|---|
| Quadrant | DetID | PixID | Counts | Sigma | Mean | Median | Sigma |
| A | 14 | 249 | 29048 | 144.92 | 943 | 923 | 194.1 |
| A | 12 | 247 | 21220 | 104.58 | 943 | 923 | 194.1 |
| A | 0 | 128 | 15297 | 74.06 | 943 | 923 | 194.1 |
| B | 4 | 81 | 119787 | 641.64 | 955 | 929 | 185.2 |
| B | 2 | 249 | 29990 | 156.88 | 955 | 929 | 185.2 |
| B | 5 | 70 | 14064 | 70.91 | 955 | 929 | 185.2 |
| C | 14 | 223 | 1255904 | 5933.95 | 899 | 901 | 211.5 |
| C | 14 | 234 | 293191 | 1382.01 | 899 | 901 | 211.5 |
| C | 1 | 192 | 117837 | 552.9 | 899 | 901 | 211.5 |
| D | 2 | 136 | 154370 | 682.86 | 913 | 882 | 224.8 |
| D | 13 | 120 | 80482 | 354.14 | 913 | 882 | 224.8 |
| D | 12 | 233 | 73832 | 324.55 | 913 | 882 | 224.8 |
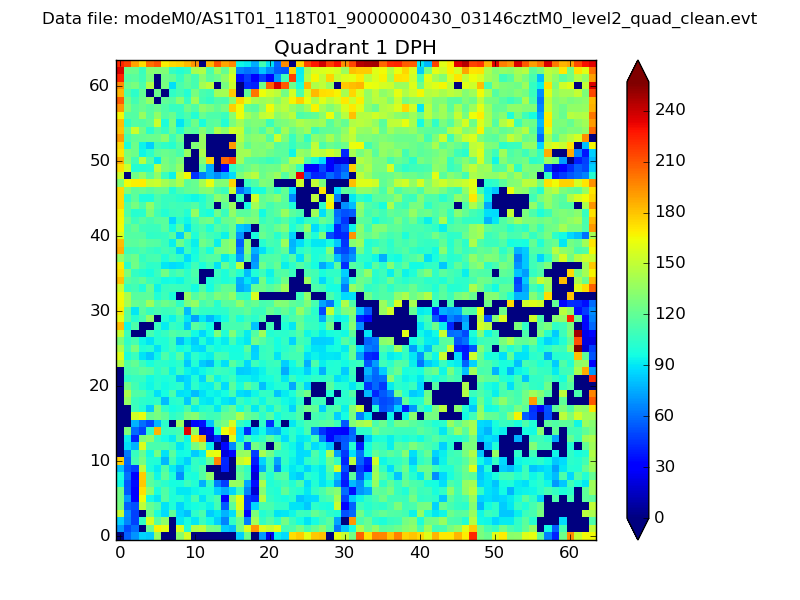
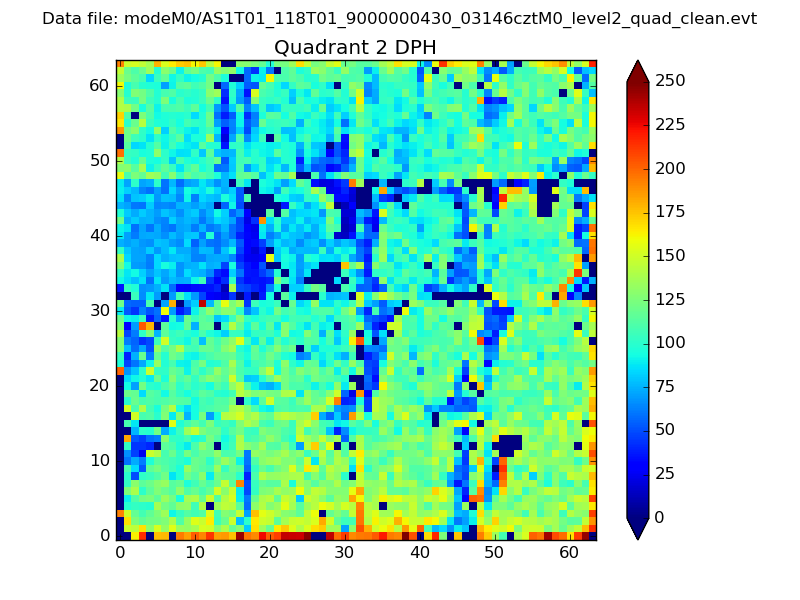
Histogram calculated using DETX and DETY for each event in the final _common_clean file
| Quadrant A | 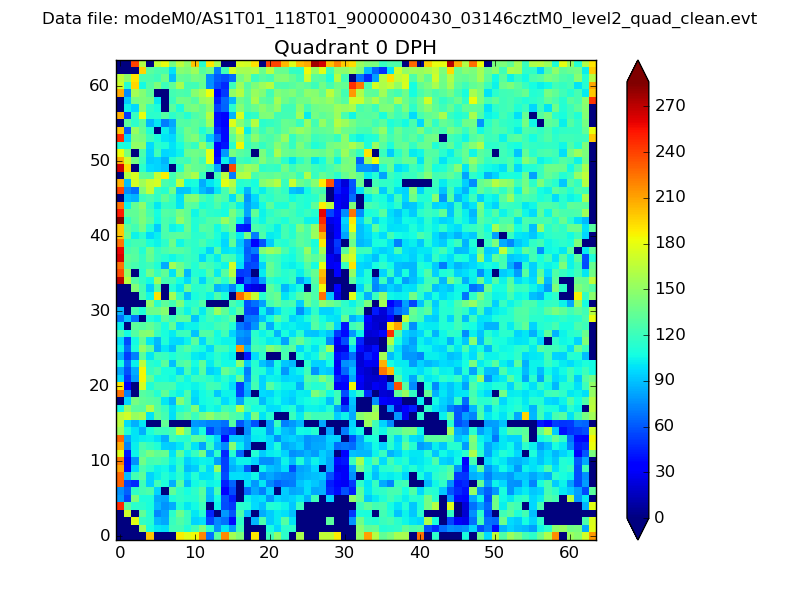 |
 |
Quadrant B |
|---|---|---|---|
| Quadrant D | 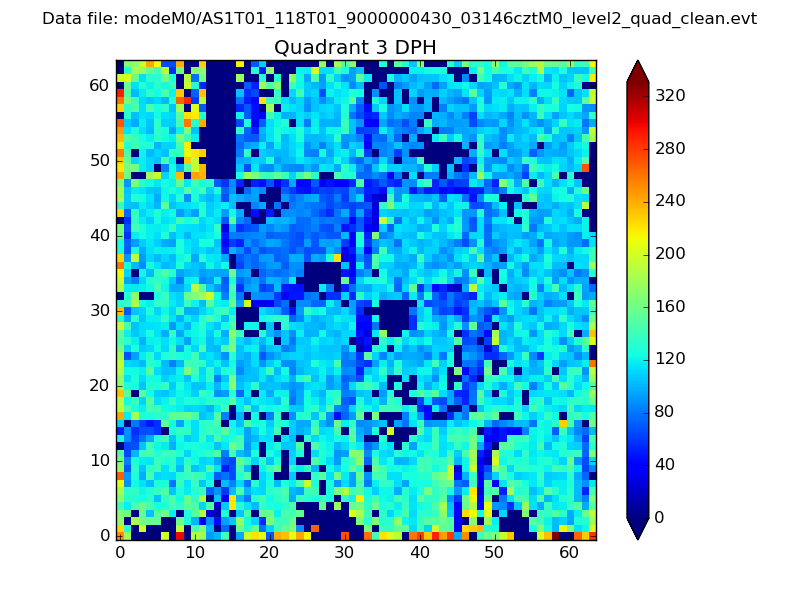 |
 |
Quadrant C |
| Plot type | Count rate plots | Images |
|---|---|---|
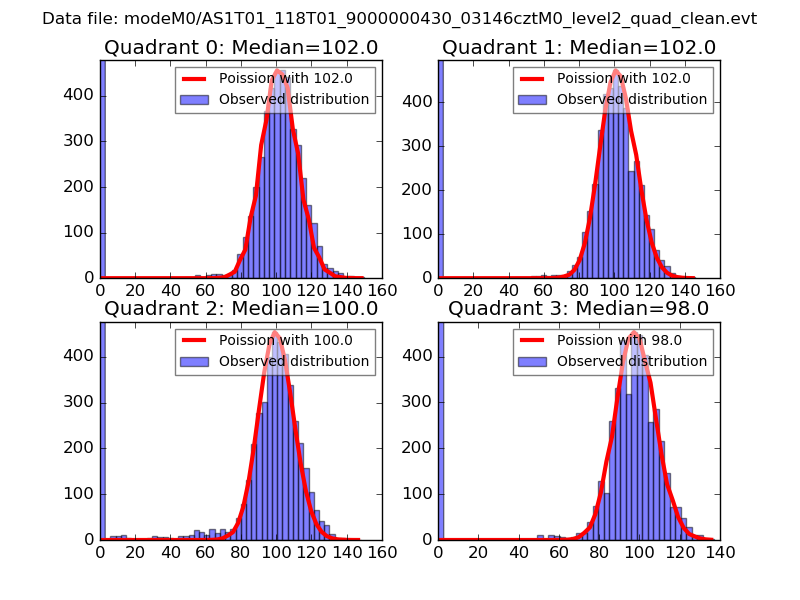
| Comparison with Poisson distribution Blue bars denote a histogram of data divided into 1 sec bins. Red curve is a Poisson curve with rate = median count rate of data. |
 |
 |
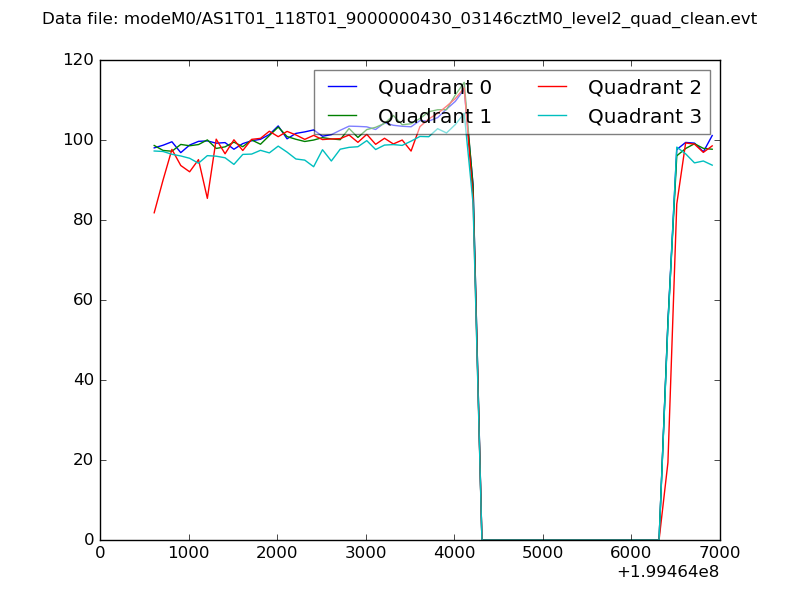
| Quadrant-wise count rates Data is divided into 100 sec bins |
 |
|
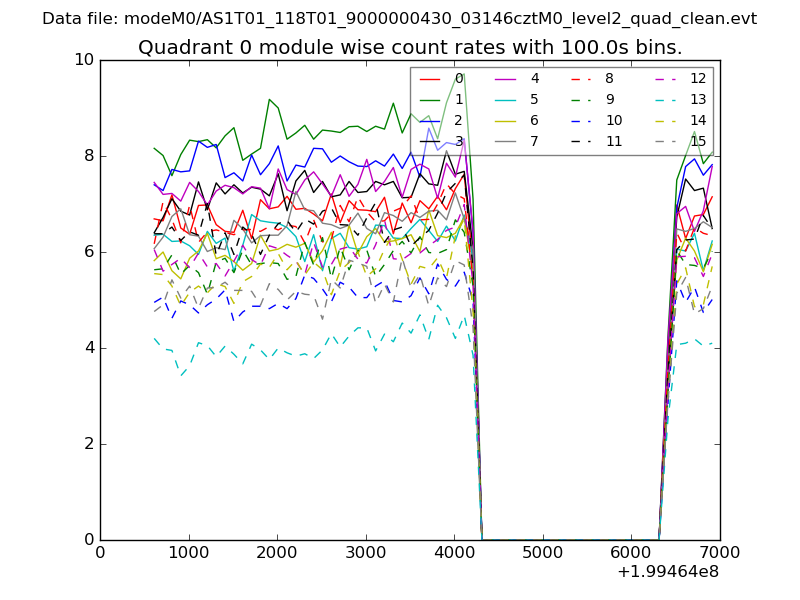
| Module-wise count rates for Quadrant A Data is divided into 100 sec bins |
 |
 |
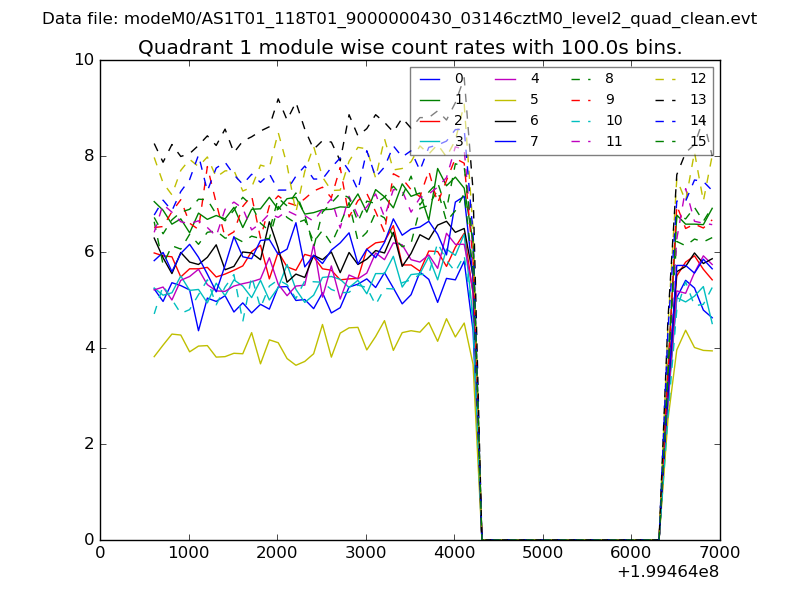
| Module-wise count rates for Quadrant B Data is divided into 100 sec bins |
 |
 |
| Module-wise count rates for Quadrant C Data is divided into 100 sec bins |
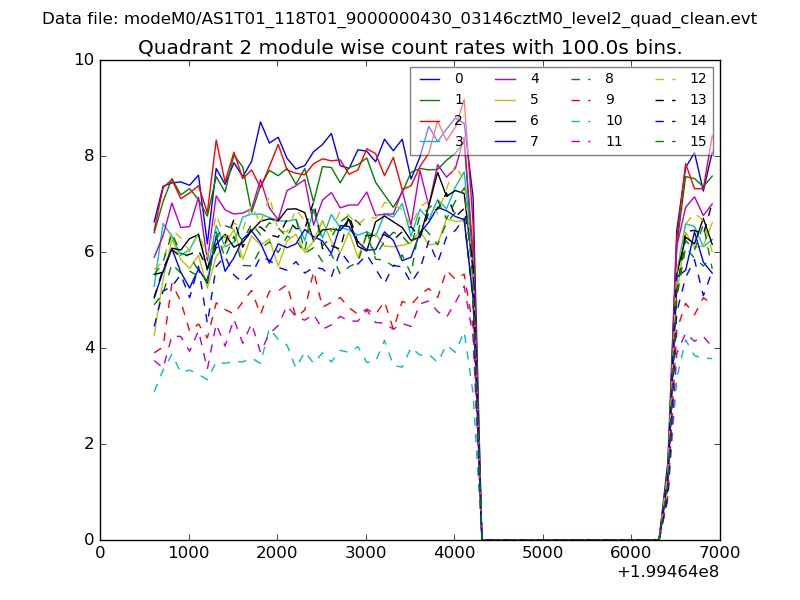 |
 |
| Module-wise count rates for Quadrant D Data is divided into 100 sec bins |
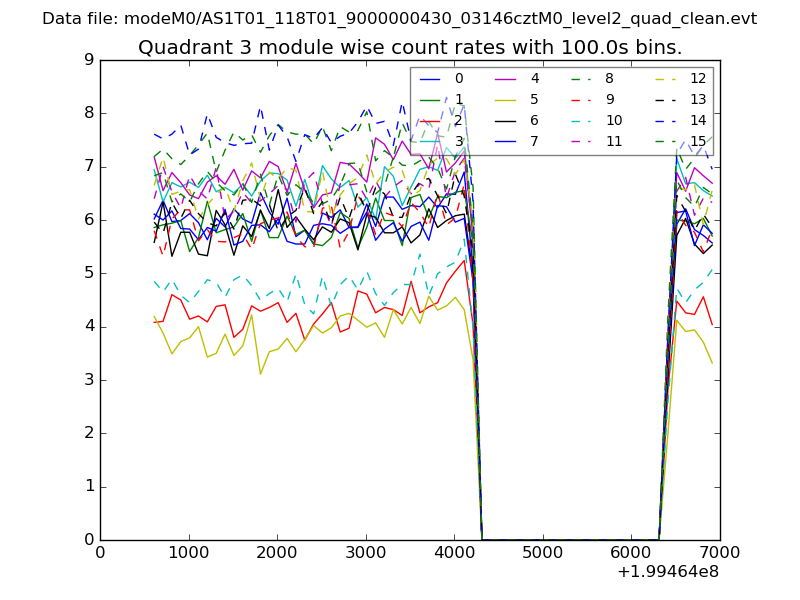 |
 |
| Parameter | Plot |
|---|---|
| CZT HV Monitor | 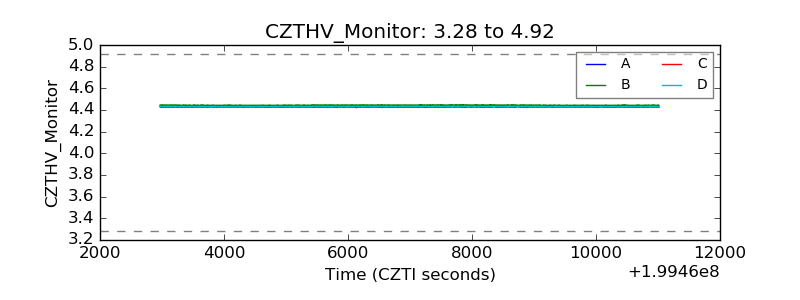 |
| D_VDD |  |
| Temperature 1 | 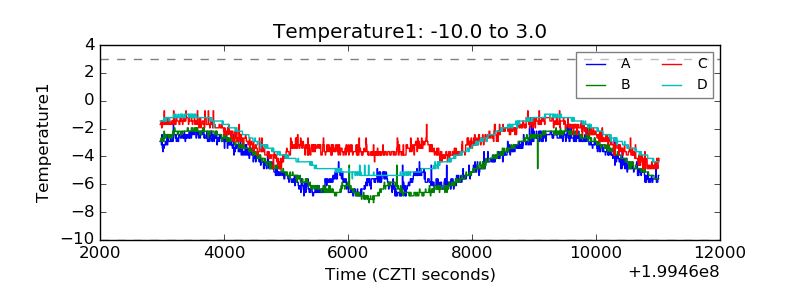 |
| Veto HV Monitor | 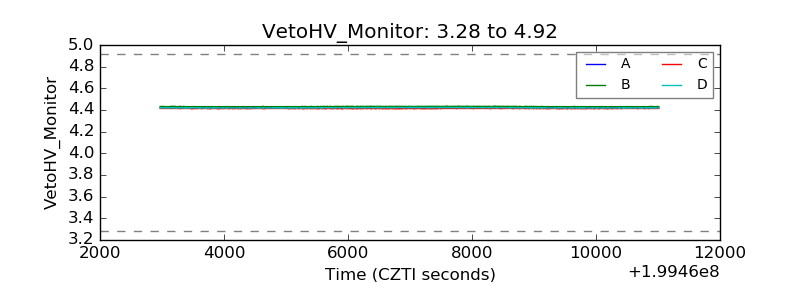 |
| Veto LLD | 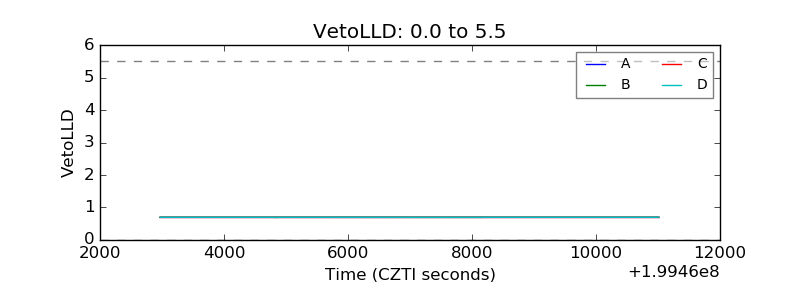 |
| Alpha Counter | 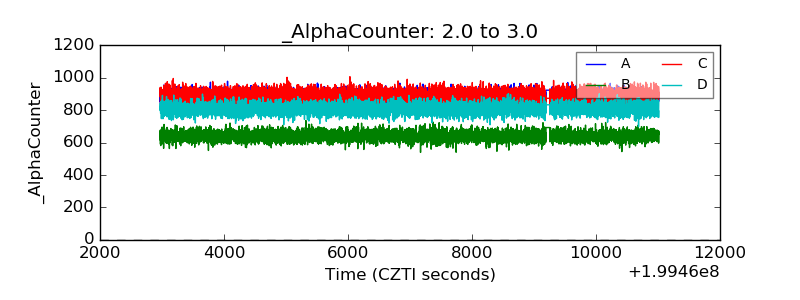 |
| _CPM_Rate | 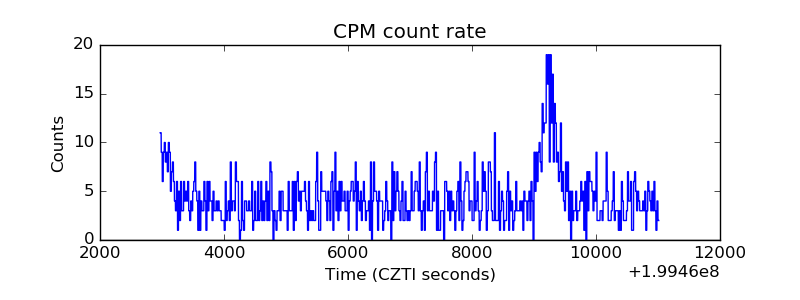 |
| CZT Counter | 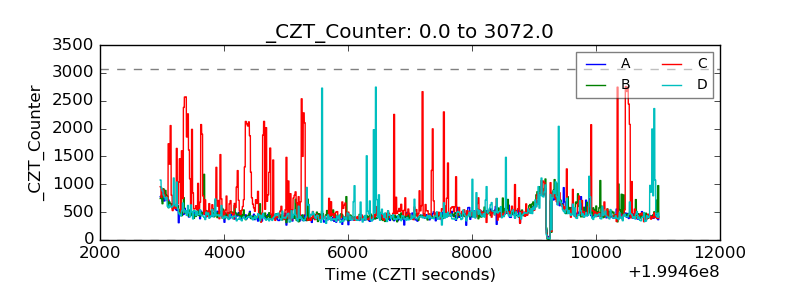 |
| +2.5 Volts monitor |  |
| +5 Volts monitor |  |
| _ROLL_ROT | 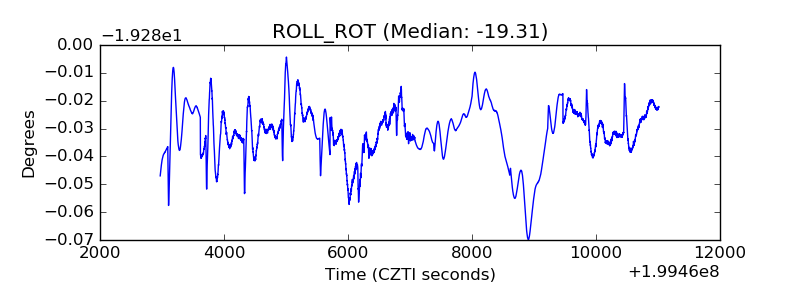 |
| _Roll_DEC | 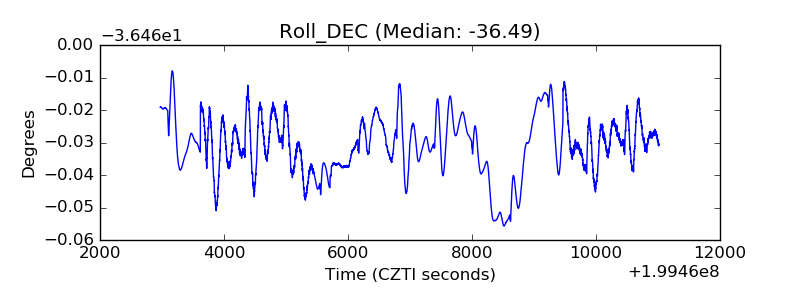 |
| _Roll_RA |  |
| Veto Counter | 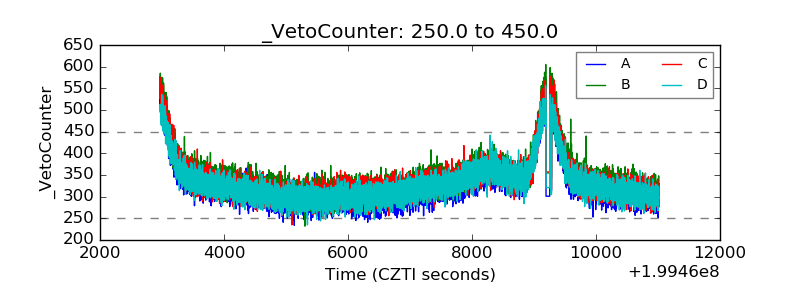 |