| Param | Original file | Final file |
|---|---|---|
| Filename | modeM0/AS1G05_167T02_9000000432cztM0_level2.fits | modeM0/AS1G05_167T02_9000000432cztM0_level2_quad_clean.evt |
| Size (bytes) | 216,604,800 | 239,630,400 |
| Size | 206.6 MB | 228.5 MB |
| Events in quadrant A | 1,297,596 | 1,472,182 |
| Events in quadrant B | 1,248,824 | 1,451,928 |
| Events in quadrant C | 1,250,876 | 1,386,925 |
| Events in quadrant D | 1,075,460 | 1,259,351 |
| Mode M0 | |||
|---|---|---|---|
| Quadrant | BADHDUFLAG | Total packets | Discarded packets |
| A | 0 | 51098 | 0 |
| B | 0 | 53583 | 0 |
| C | 0 | 60827 | 0 |
| D | 0 | 63011 | 0 |
| Mode SS | |||
|---|---|---|---|
| Quadrant | BADHDUFLAG | Total packets | Discarded packets |
| A | 0 | 500 | 0 |
| B | 0 | 500 | 0 |
| C | 0 | 500 | 0 |
| D | 0 | 500 | 0 |
| Mode M9 | |||
|---|---|---|---|
| Quadrant | BADHDUFLAG | Total packets | Discarded packets |
| A | 0 | 38 | 0 |
| B | 0 | 38 | 0 |
| C | 0 | 38 | 0 |
| D | 0 | 38 | 0 |
| Quadrant | Total seconds | Saturated seconds | Saturation percentage |
|---|---|---|---|
| A | 24515 | 188 | 0.766877% |
| B | 24515 | 386 | 1.574546% |
| C | 24515 | 849 | 3.463186% |
| D | 24515 | 852 | 3.475423% |
Noise dominated data is calculated using 1-second bins in cleaned event files. If a bin has >2000 counts, and if more than 50% of those come from <1% of pixels, then it is considered to be noise-dominated and hence unusable.
| Quadrant | # 1 sec bins | Bins with >0 counts | Bins with >2000 counts | High rate bins dominated by noise | Noise dominated (total time) | Noise dominated (detector-on time) | Marked lightcurve |
|---|---|---|---|---|---|---|---|
| A | 28285 | 24514 | 0 | 0 | 0.00% | 0.00% | 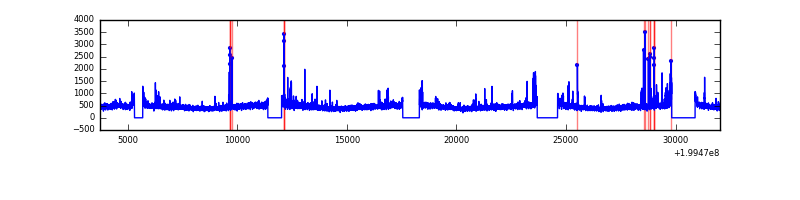 |
| B | 28285 | 24513 | 0 | 0 | 0.00% | 0.00% | 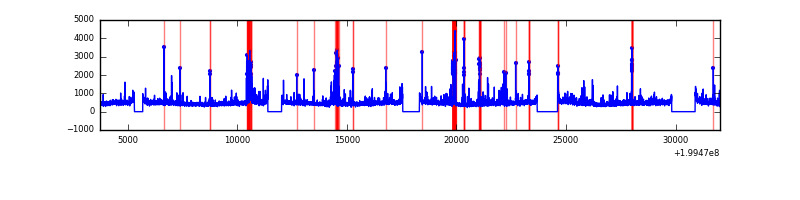 |
| C | 28285 | 24499 | 0 | 0 | 0.00% | 0.00% |  |
| D | 28285 | 24502 | 0 | 0 | 0.00% | 0.00% | 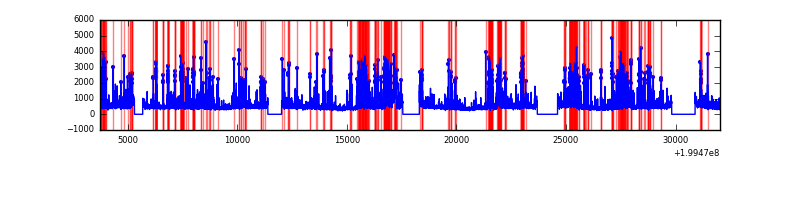 |
Top three noisy pixels from each quadrant. If the there are fewer than three noisy pixels in the level2.evt file, extra rows are filled as -1
| Pixel properties | Quadrant properties | ||||||
|---|---|---|---|---|---|---|---|
| Quadrant | DetID | PixID | Counts | Sigma | Mean | Median | Sigma |
| A | 0 | 29 | 1291 | 10.73 | 336 | 312 | 91.2 |
| A | 14 | 188 | 1163 | 9.33 | 336 | 312 | 91.2 |
| A | 14 | 204 | 1082 | 8.44 | 336 | 312 | 91.2 |
| B | 2 | 9 | 1098 | 11.49 | 328 | 311 | 68.5 |
| B | 12 | 226 | 962 | 9.51 | 328 | 311 | 68.5 |
| B | 5 | 128 | 900 | 8.6 | 328 | 311 | 68.5 |
| C | 1 | 80 | 911 | 6.71 | 330 | 305 | 90.3 |
| C | 12 | 241 | 888 | 6.46 | 330 | 305 | 90.3 |
| C | 1 | 81 | 851 | 6.05 | 330 | 305 | 90.3 |
| D | 7 | 5 | 823 | 6.45 | 307 | 278 | 84.4 |
| D | 4 | 160 | 807 | 6.27 | 307 | 278 | 84.4 |
| D | 6 | 231 | 796 | 6.14 | 307 | 278 | 84.4 |
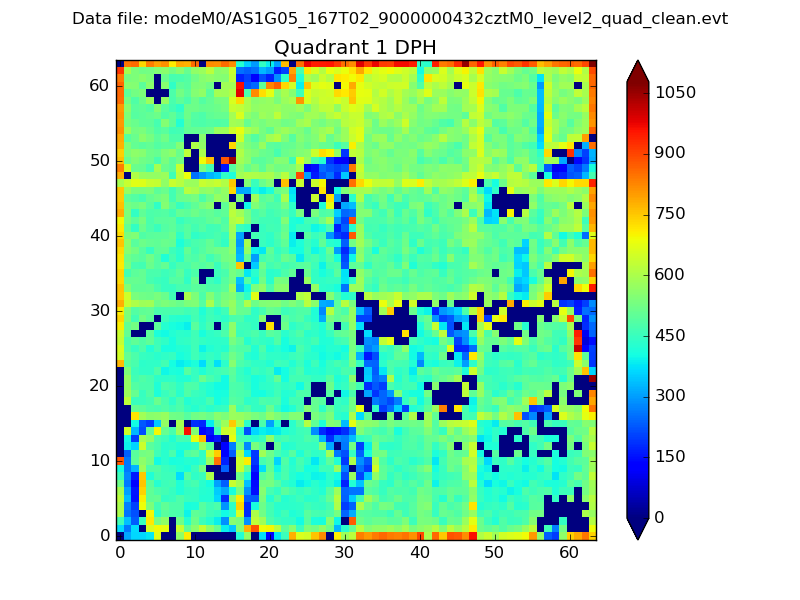
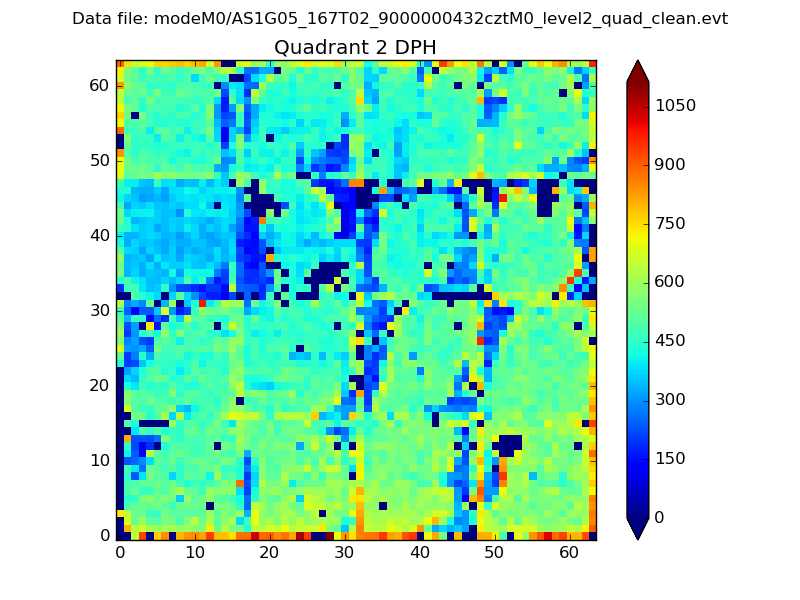
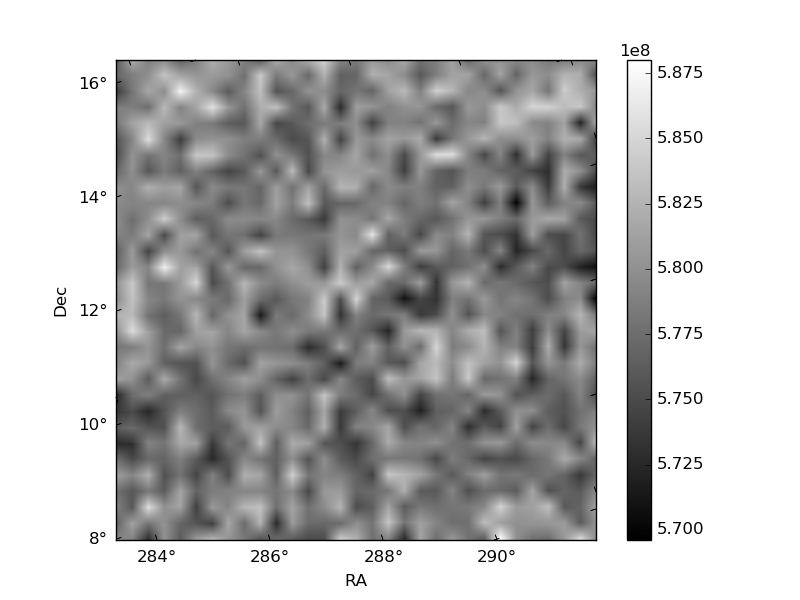
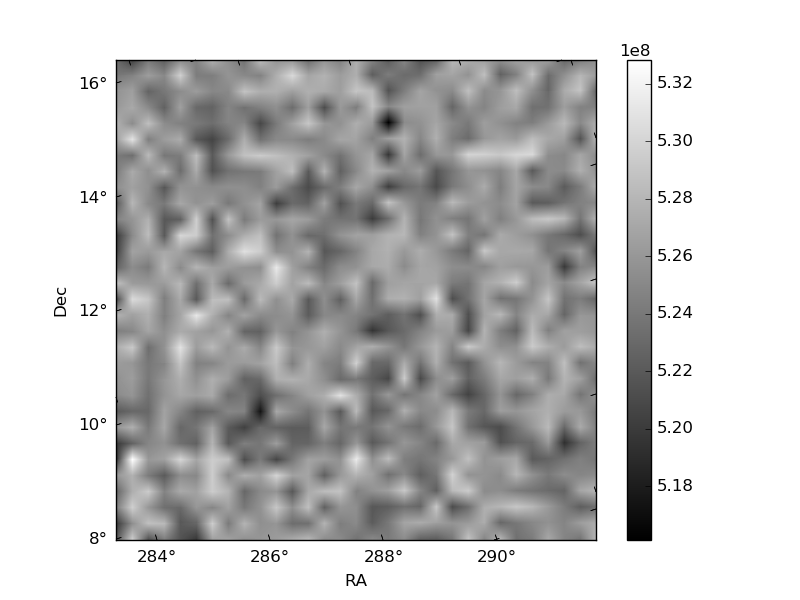
Histogram calculated using DETX and DETY for each event in the final _common_clean file
| Quadrant A | 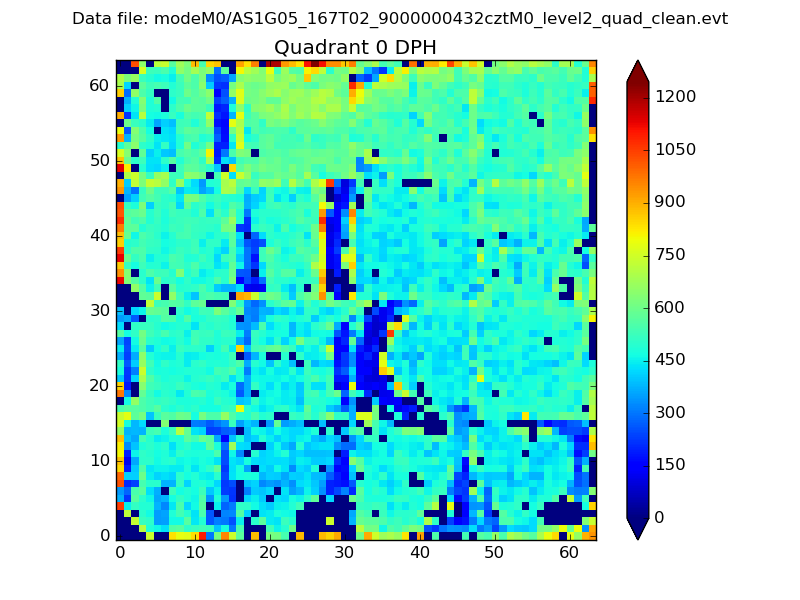 |
 |
Quadrant B |
|---|---|---|---|
| Quadrant D | 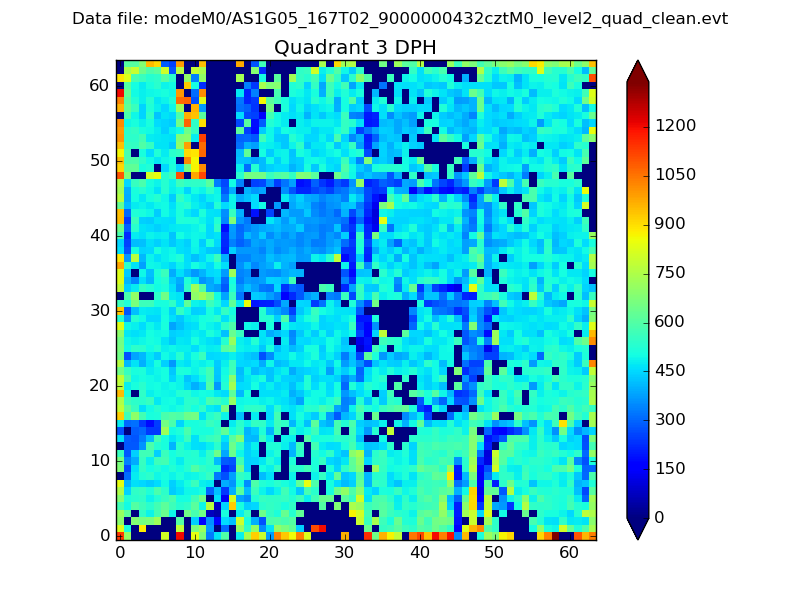 |
 |
Quadrant C |
| Plot type | Count rate plots | Images |
|---|---|---|
| Comparison with Poisson distribution Blue bars denote a histogram of data divided into 1 sec bins. Red curve is a Poisson curve with rate = median count rate of data. |
 |
 |
| Quadrant-wise count rates Data is divided into 100 sec bins |
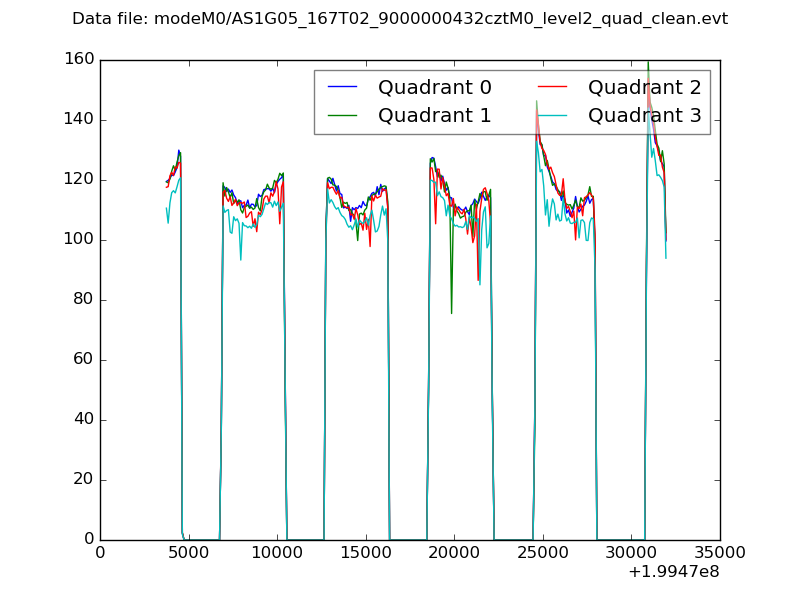 |
|
| Module-wise count rates for Quadrant A Data is divided into 100 sec bins |
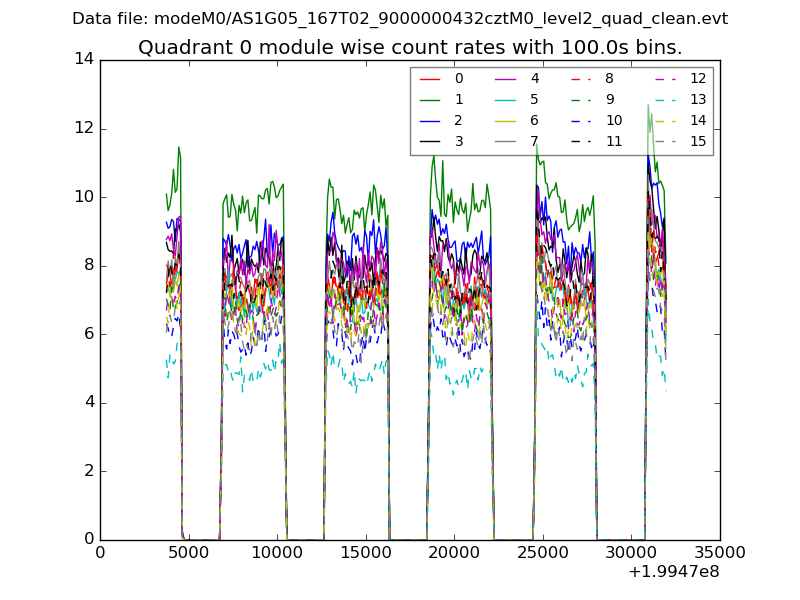 |
 |
| Module-wise count rates for Quadrant B Data is divided into 100 sec bins |
 |
 |
| Module-wise count rates for Quadrant C Data is divided into 100 sec bins |
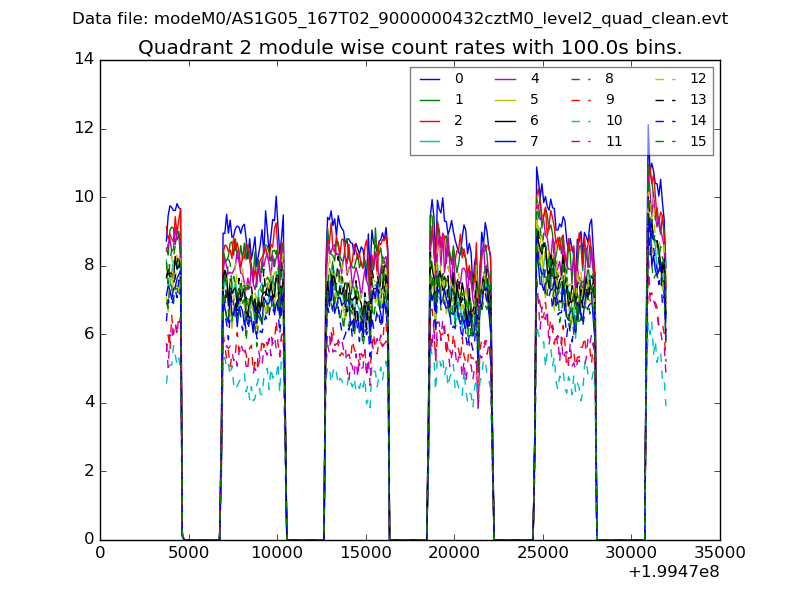 |
 |
| Module-wise count rates for Quadrant D Data is divided into 100 sec bins |
 |
 |
| Parameter | Plot |
|---|---|
| CZT HV Monitor | 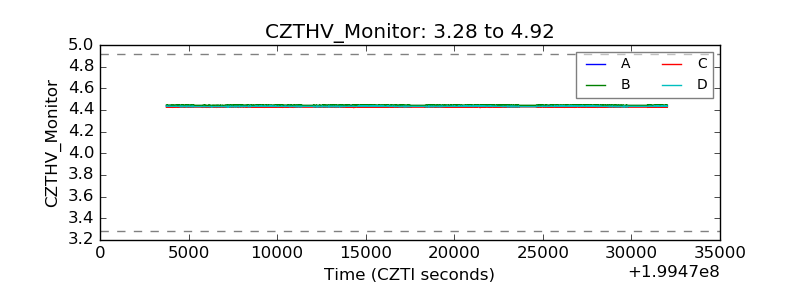 |
| D_VDD | 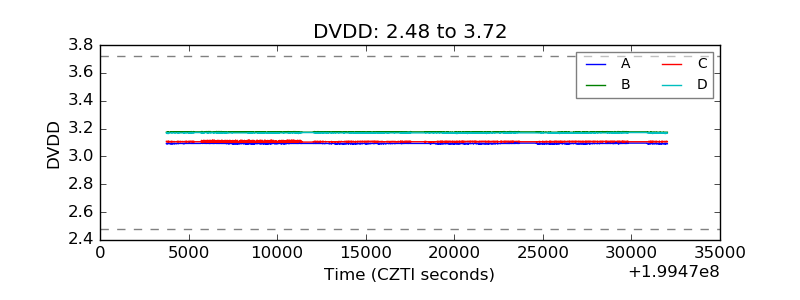 |
| Temperature 1 | 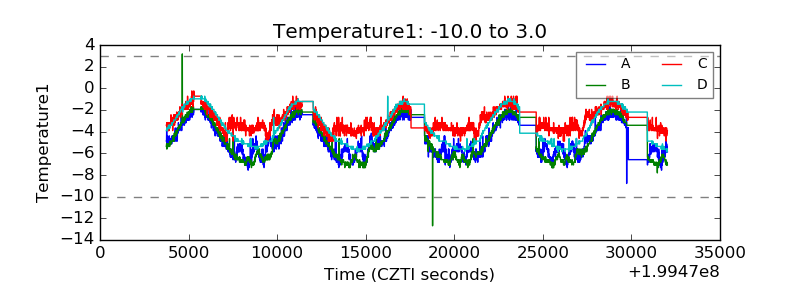 |
| Veto HV Monitor | 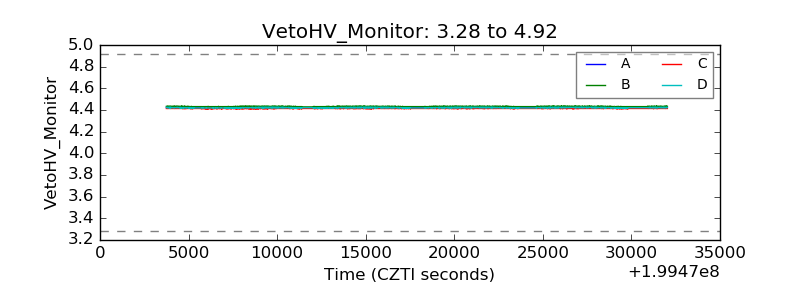 |
| Veto LLD | 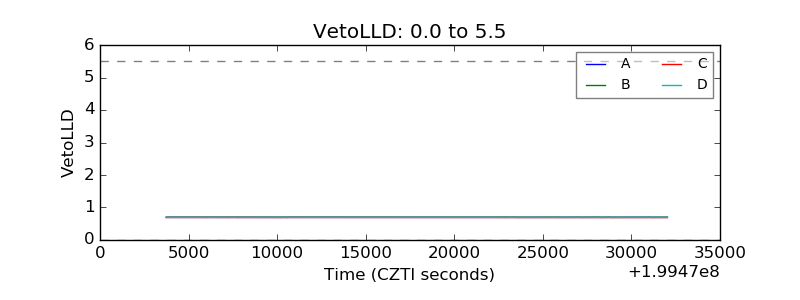 |
| Alpha Counter |  |
| _CPM_Rate | 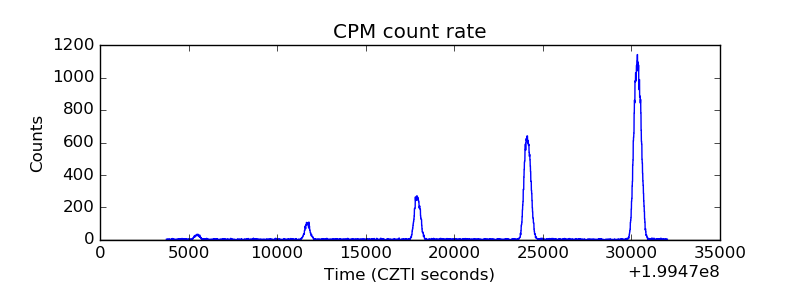 |
| CZT Counter | 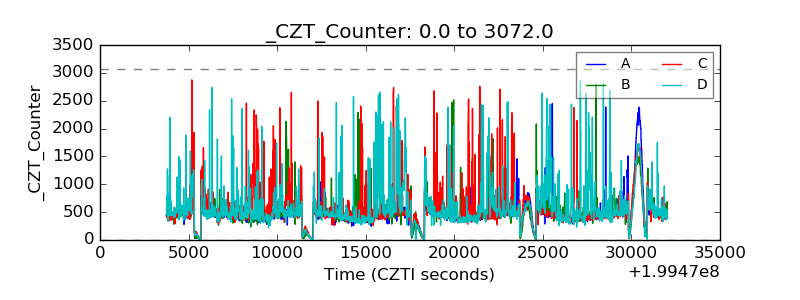 |
| +2.5 Volts monitor |  |
| +5 Volts monitor |  |
| _ROLL_ROT | 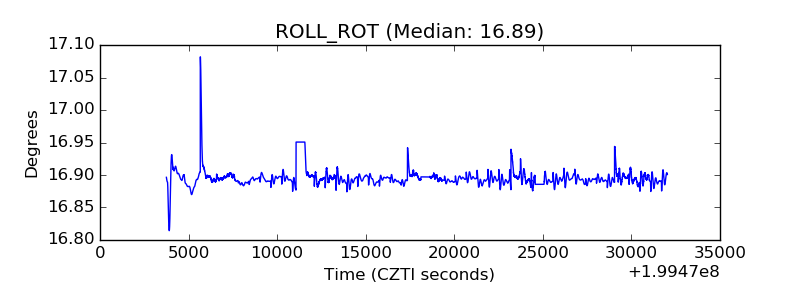 |
| _Roll_DEC | 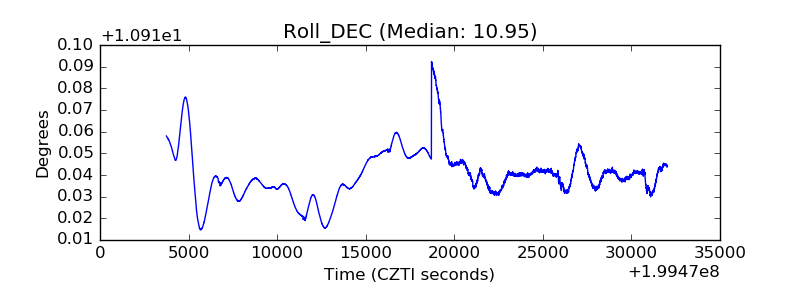 |
| _Roll_RA | 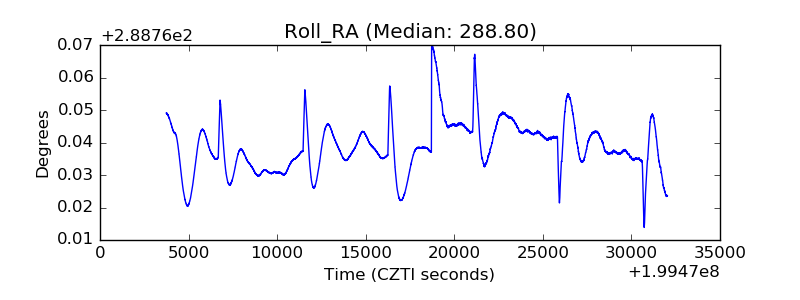 |
| Veto Counter |  |