| Param | Original file | Final file |
|---|---|---|
| Filename | modeM0/AS1G05_167T02_9000000432_03149cztM0_level2.evt | modeM0/AS1G05_167T02_9000000432_03149cztM0_level2_quad_clean.evt |
| Size (bytes) | 1,085,198,400 | 172,584,000 |
| Size | 1.0 GB | 164.6 MB |
| Events in quadrant A | 6,599,698 | 1,082,885 |
| Events in quadrant B | 7,236,047 | 1,078,452 |
| Events in quadrant C | 9,101,659 | 1,059,655 |
| Events in quadrant D | 8,960,576 | 1,017,688 |
| Mode M0 | |||
|---|---|---|---|
| Quadrant | BADHDUFLAG | Total packets | Discarded packets |
| A | 0 | 29511 | 4 |
| B | 0 | 31055 | 3 |
| C | 0 | 36577 | 3 |
| D | 0 | 36548 | 3 |
| Mode SS | |||
|---|---|---|---|
| Quadrant | BADHDUFLAG | Total packets | Discarded packets |
| A | 0 | 292 | 0 |
| B | 0 | 292 | 0 |
| C | 0 | 292 | 0 |
| D | 0 | 292 | 0 |
| Mode M9 | |||
|---|---|---|---|
| Quadrant | BADHDUFLAG | Total packets | Discarded packets |
| A | 0 | 18 | 0 |
| B | 0 | 18 | 0 |
| C | 0 | 18 | 0 |
| D | 0 | 18 | 0 |
| Quadrant | Total seconds | Saturated seconds | Saturation percentage |
|---|---|---|---|
| A | 14312 | 116 | 0.810509% |
| B | 14312 | 218 | 1.523197% |
| C | 14312 | 563 | 3.933762% |
| D | 14312 | 511 | 3.570430% |
Noise dominated data is calculated using 1-second bins in cleaned event files. If a bin has >2000 counts, and if more than 50% of those come from <1% of pixels, then it is considered to be noise-dominated and hence unusable.
| Quadrant | # 1 sec bins | Bins with >0 counts | Bins with >2000 counts | High rate bins dominated by noise | Noise dominated (total time) | Noise dominated (detector-on time) | Marked lightcurve |
|---|---|---|---|---|---|---|---|
| A | 16082 | 14314 | 7 | 7 | 0.04% | 0.05% | 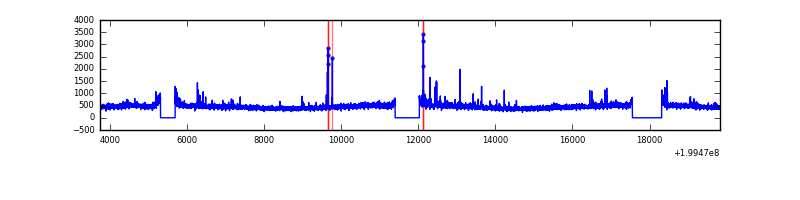 |
| B | 16082 | 14315 | 56 | 56 | 0.35% | 0.39% | 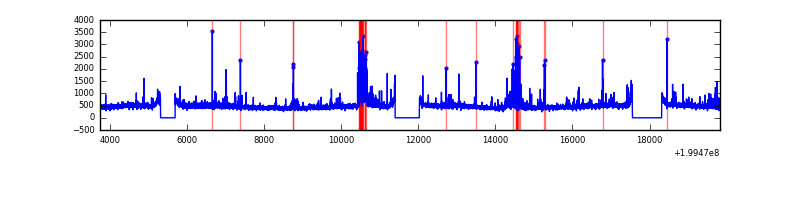 |
| C | 16082 | 14314 | 366 | 366 | 2.28% | 2.56% | 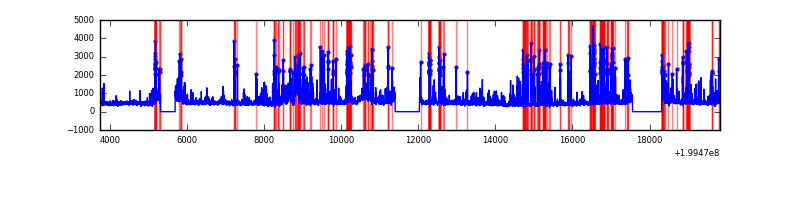 |
| D | 16082 | 14315 | 354 | 354 | 2.20% | 2.47% |  |
Top three noisy pixels from each quadrant. If the there are fewer than three noisy pixels in the level2.evt file, extra rows are filled as -1
| Pixel properties | Quadrant properties | ||||||
|---|---|---|---|---|---|---|---|
| Quadrant | DetID | PixID | Counts | Sigma | Mean | Median | Sigma |
| A | 14 | 249 | 81459 | 233.31 | 1662 | 1624 | 342.2 |
| A | 12 | 247 | 34236 | 95.3 | 1662 | 1624 | 342.2 |
| A | 13 | 164 | 30667 | 84.87 | 1662 | 1624 | 342.2 |
| B | 4 | 81 | 361249 | 1104.96 | 1682 | 1646 | 325.4 |
| B | 5 | 70 | 130849 | 397.0 | 1682 | 1646 | 325.4 |
| B | 3 | 0 | 78117 | 234.97 | 1682 | 1646 | 325.4 |
| C | 14 | 223 | 1969518 | 5304.97 | 1590 | 1601 | 371.0 |
| C | 1 | 192 | 605394 | 1627.66 | 1590 | 1601 | 371.0 |
| C | 6 | 80 | 100219 | 265.85 | 1590 | 1601 | 371.0 |
| D | 12 | 233 | 1292195 | 3365.11 | 1584 | 1532 | 383.5 |
| D | 2 | 136 | 417258 | 1083.91 | 1584 | 1532 | 383.5 |
| D | 5 | 233 | 364233 | 945.66 | 1584 | 1532 | 383.5 |
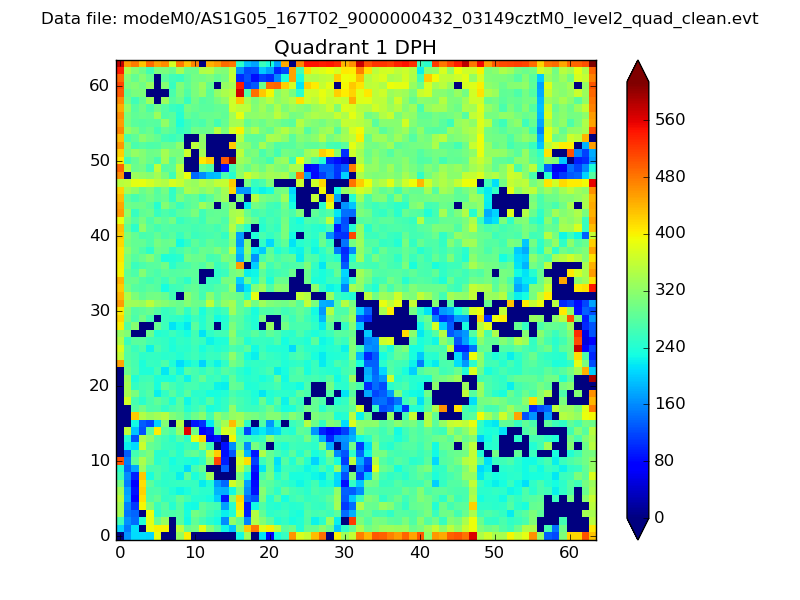
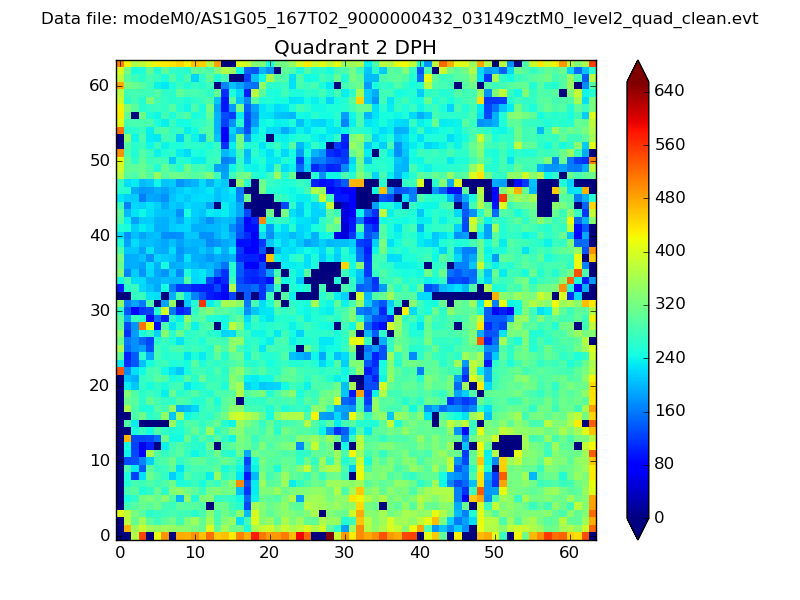
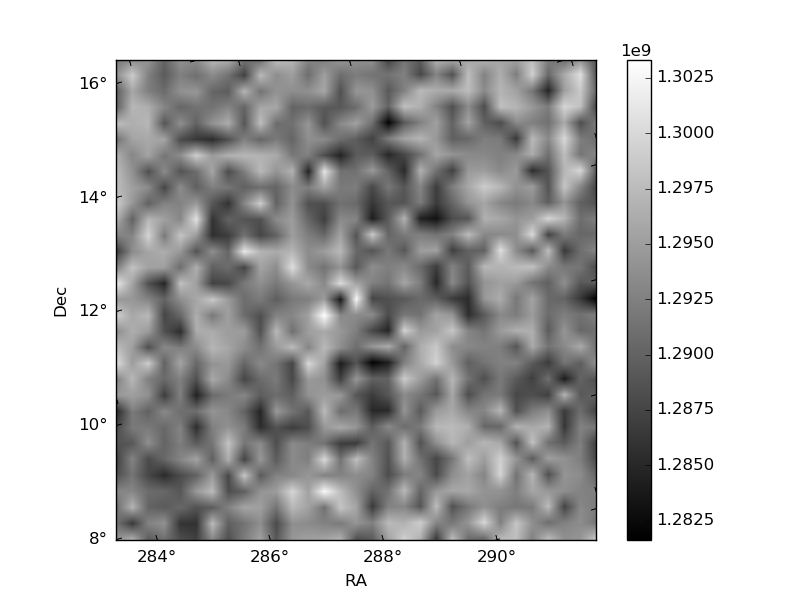
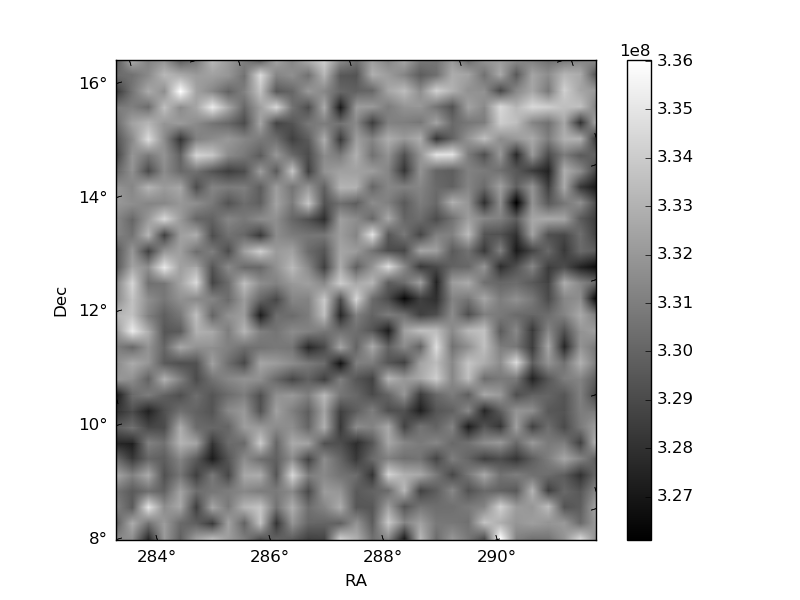
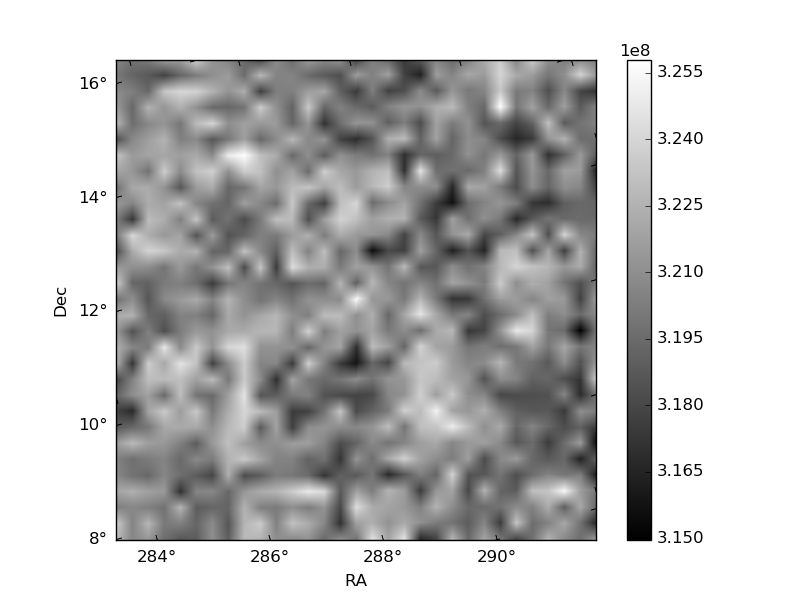
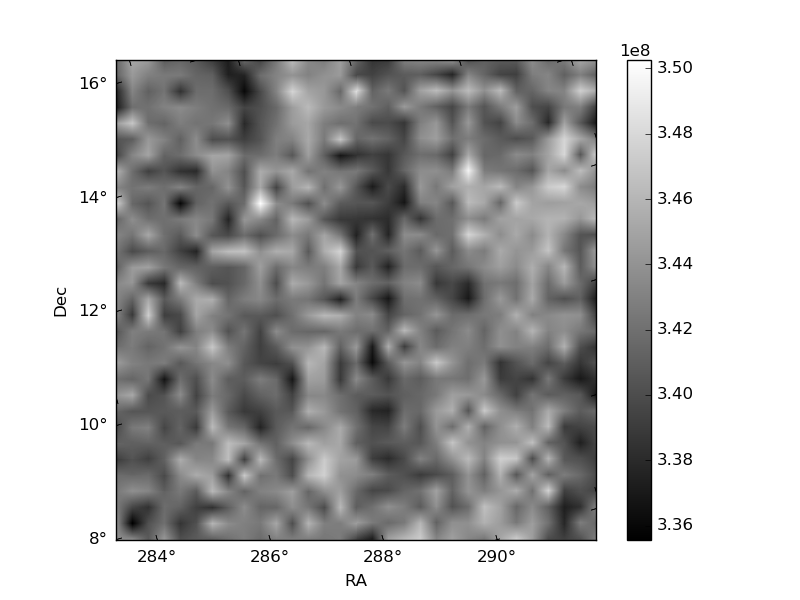
Histogram calculated using DETX and DETY for each event in the final _common_clean file
| Quadrant A | 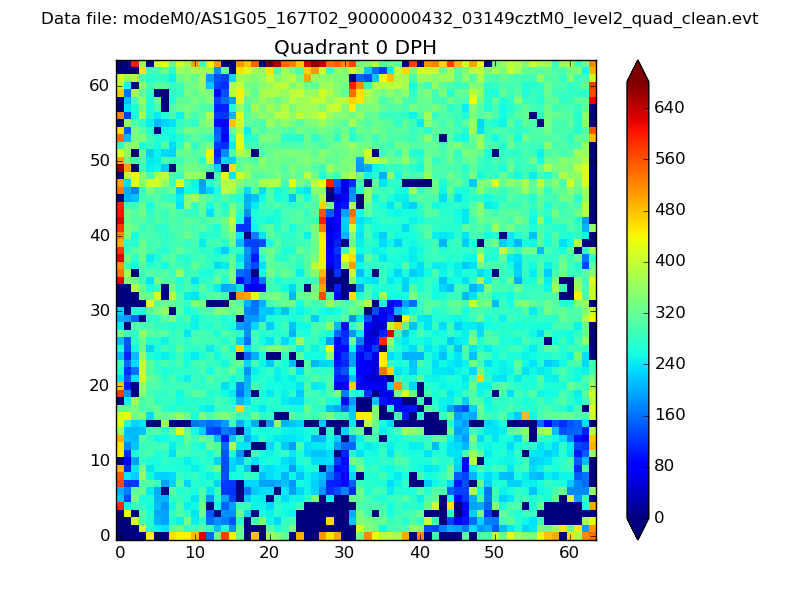 |
 |
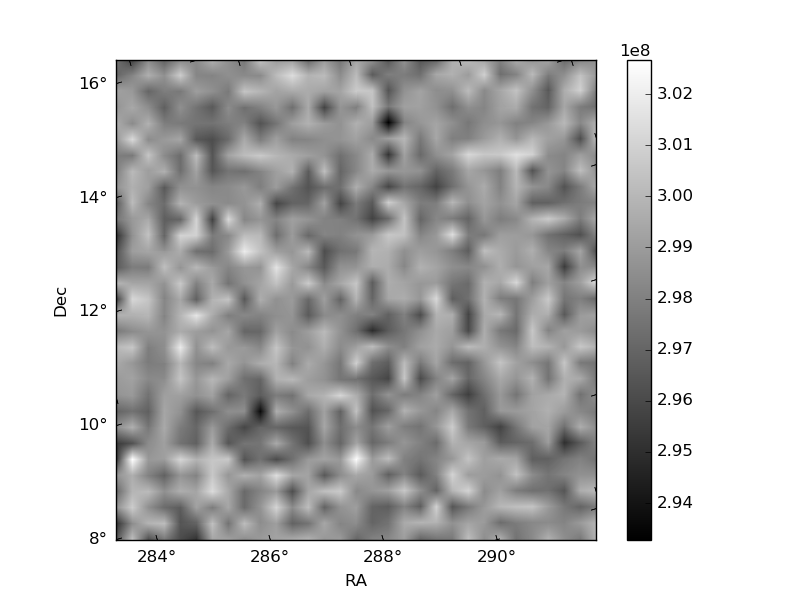
Quadrant B |
|---|---|---|---|
| Quadrant D | 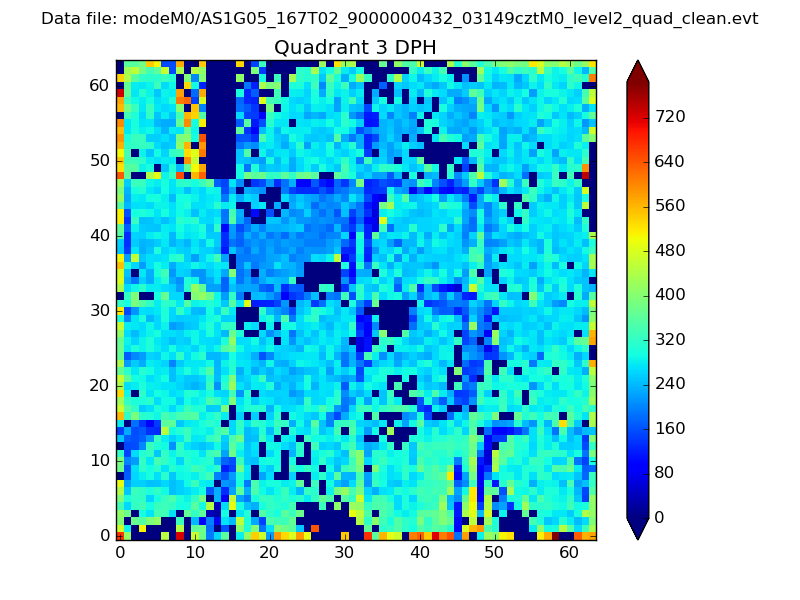 |
 |
Quadrant C |
| Plot type | Count rate plots | Images |
|---|---|---|
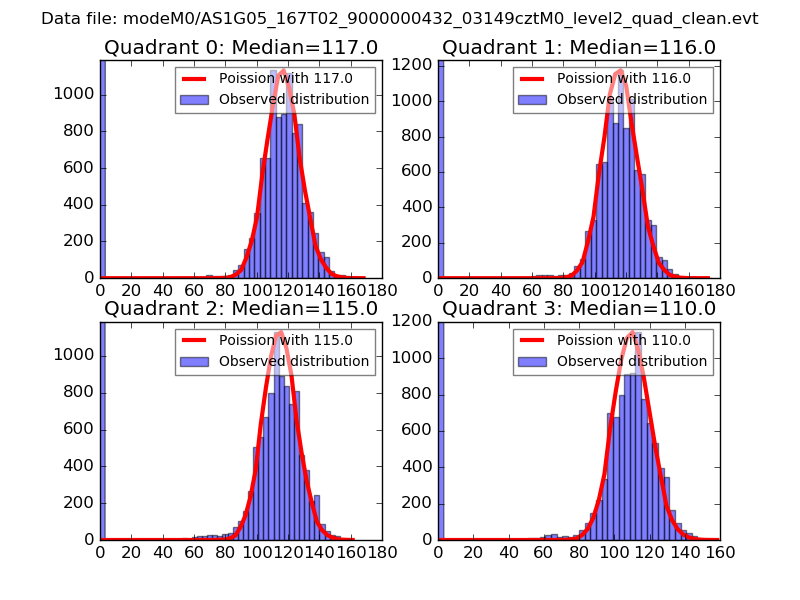
| Comparison with Poisson distribution Blue bars denote a histogram of data divided into 1 sec bins. Red curve is a Poisson curve with rate = median count rate of data. |
 |
 |
| Quadrant-wise count rates Data is divided into 100 sec bins |
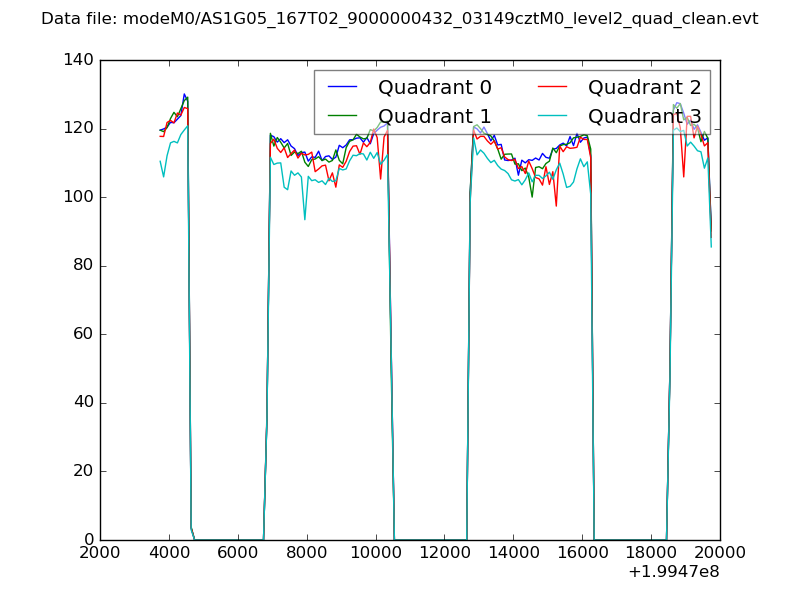 |
|
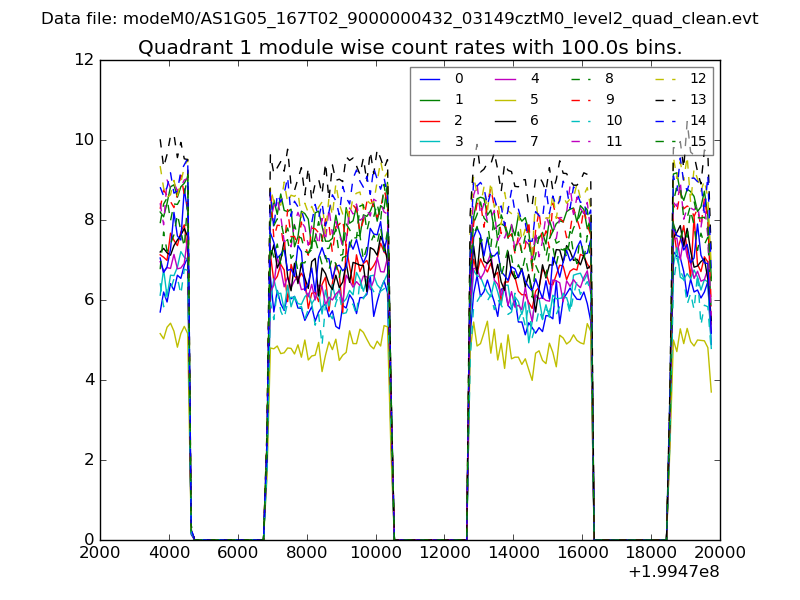
| Module-wise count rates for Quadrant A Data is divided into 100 sec bins |
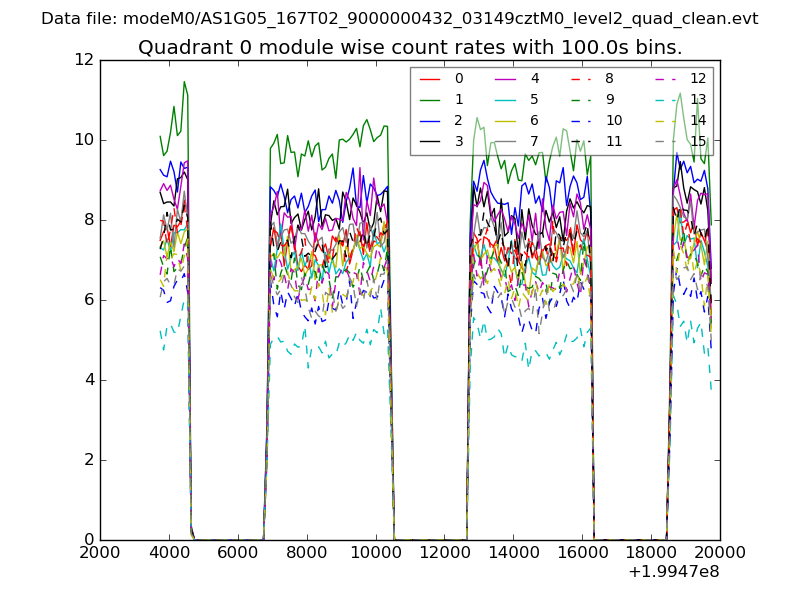 |
 |
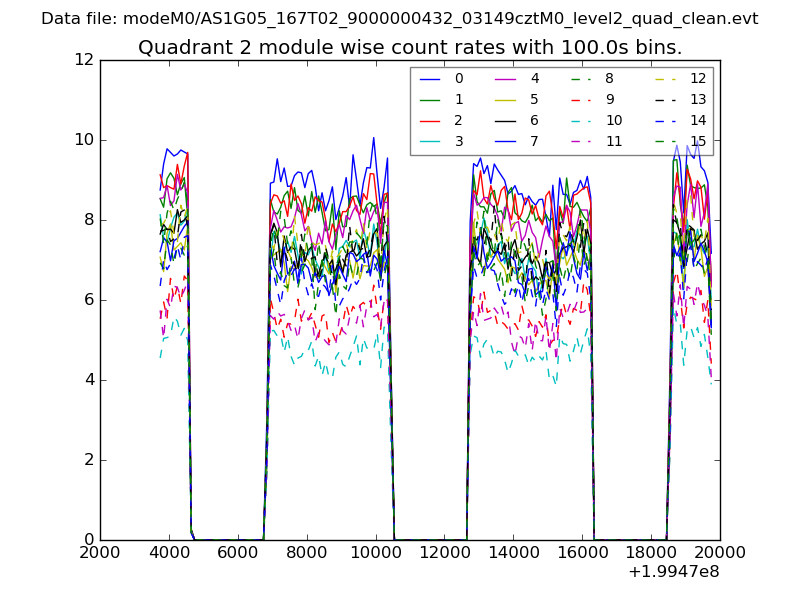
| Module-wise count rates for Quadrant B Data is divided into 100 sec bins |
 |
 |
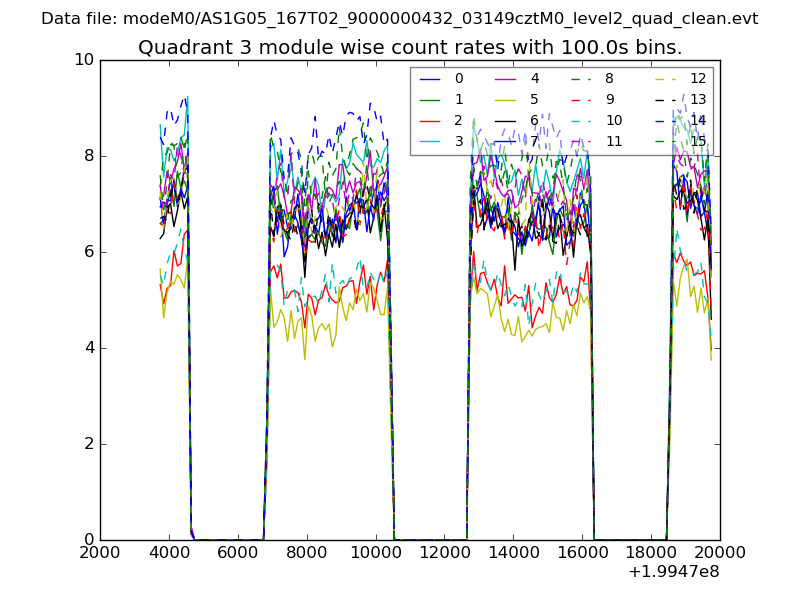
| Module-wise count rates for Quadrant C Data is divided into 100 sec bins |
 |
 |
| Module-wise count rates for Quadrant D Data is divided into 100 sec bins |
 |
 |
| Parameter | Plot |
|---|---|
| CZT HV Monitor | 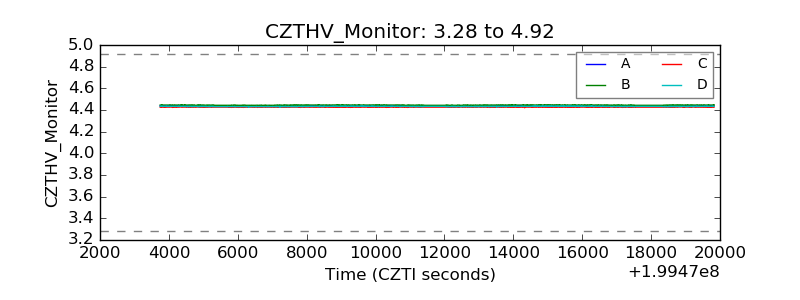 |
| D_VDD | 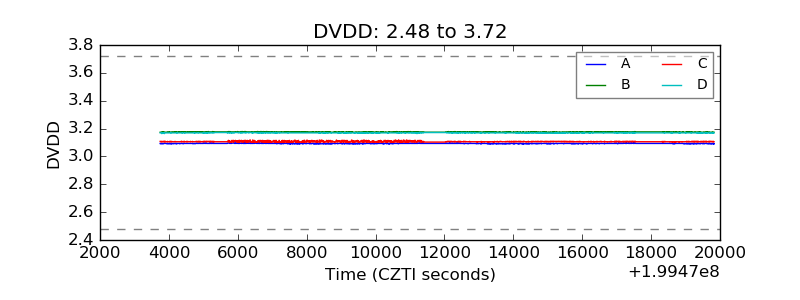 |
| Temperature 1 | 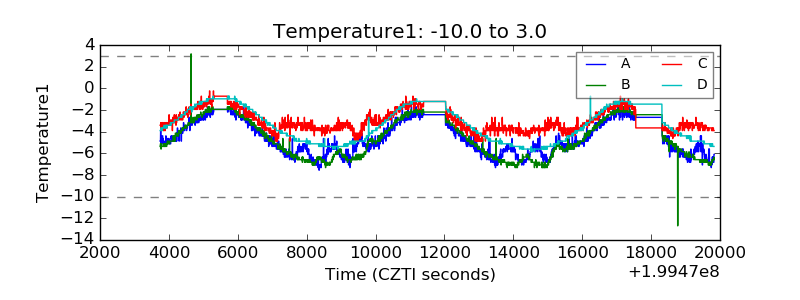 |
| Veto HV Monitor | 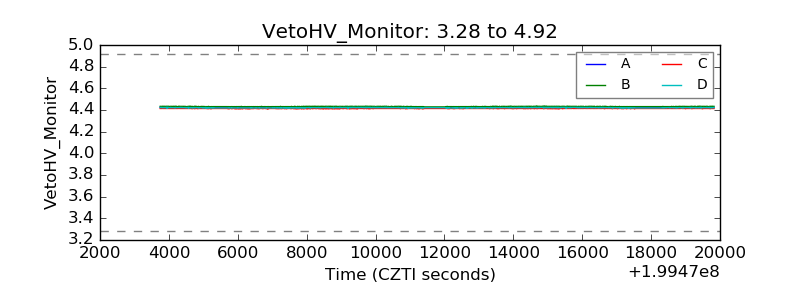 |
| Veto LLD | 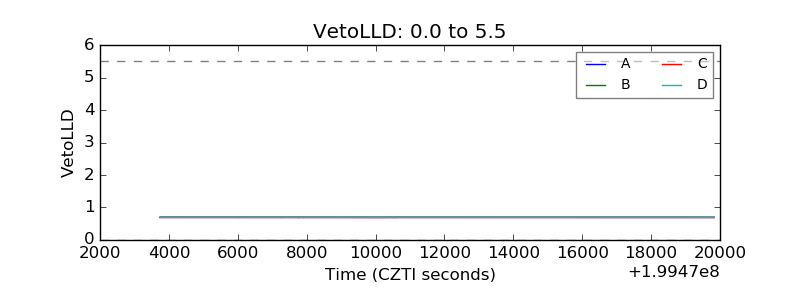 |
| Alpha Counter | 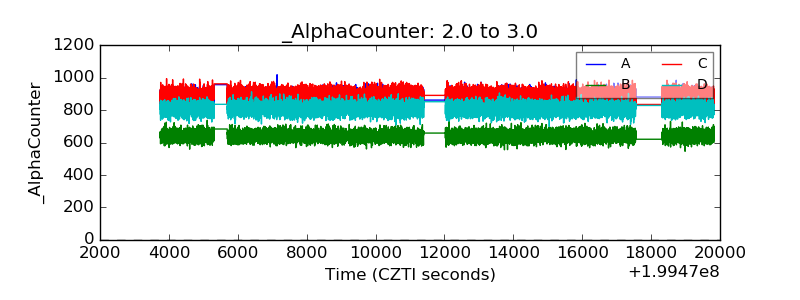 |
| _CPM_Rate | 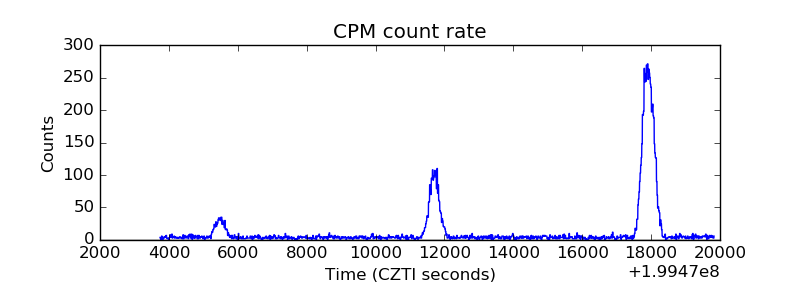 |
| CZT Counter | 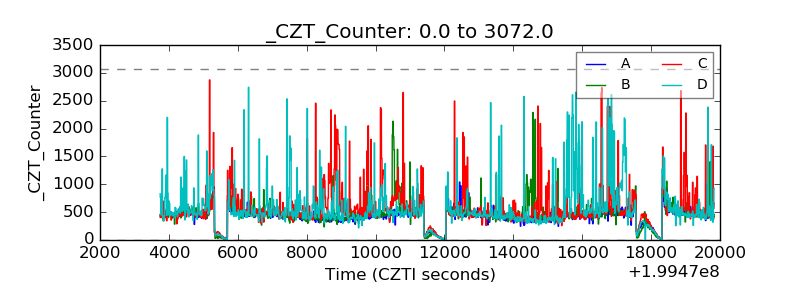 |
| +2.5 Volts monitor |  |
| +5 Volts monitor |  |
| _ROLL_ROT | 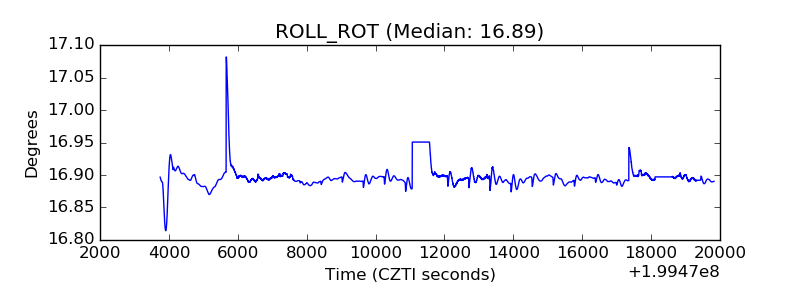 |
| _Roll_DEC | 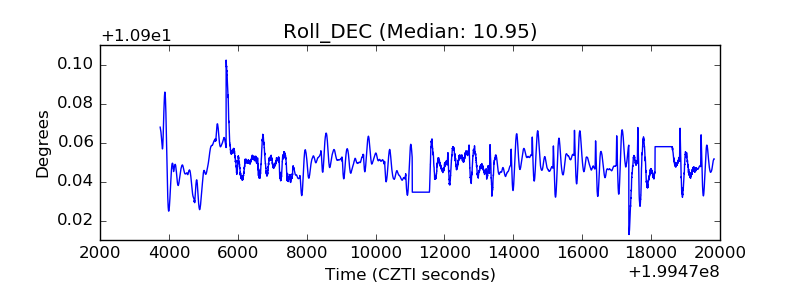 |
| _Roll_RA | 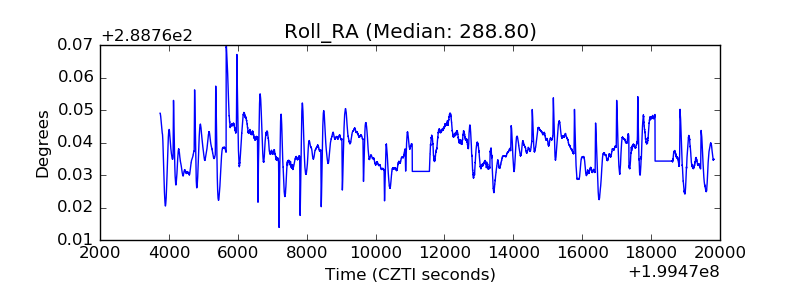 |
| Veto Counter | 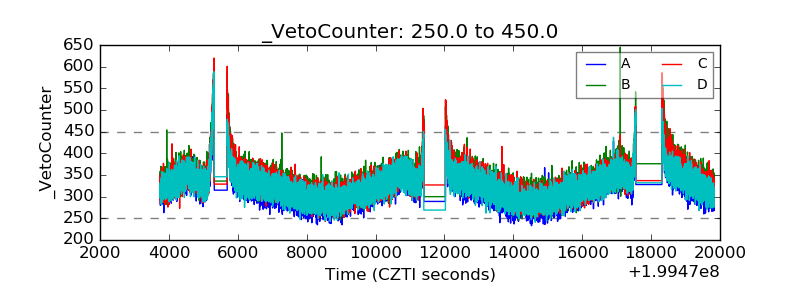 |