| Param | Original file | Final file |
|---|---|---|
| Filename | modeM0/AS1G05_167T02_9000000432_03150cztM0_level2.evt | modeM0/AS1G05_167T02_9000000432_03150cztM0_level2_quad_clean.evt |
| Size (bytes) | 501,514,560 | 90,933,120 |
| Size | 478.3 MB | 86.7 MB |
| Events in quadrant A | 3,012,017 | 590,064 |
| Events in quadrant B | 3,438,021 | 584,118 |
| Events in quadrant C | 4,183,809 | 579,445 |
| Events in quadrant D | 4,115,690 | 548,830 |
| Mode M0 | |||
|---|---|---|---|
| Quadrant | BADHDUFLAG | Total packets | Discarded packets |
| A | 0 | 13496 | 2 |
| B | 0 | 14617 | 1 |
| C | 0 | 16839 | 1 |
| D | 0 | 16910 | 1 |
| Mode SS | |||
|---|---|---|---|
| Quadrant | BADHDUFLAG | Total packets | Discarded packets |
| A | 0 | 130 | 0 |
| B | 0 | 130 | 0 |
| C | 0 | 130 | 0 |
| D | 0 | 130 | 0 |
| Mode M9 | |||
|---|---|---|---|
| Quadrant | BADHDUFLAG | Total packets | Discarded packets |
| A | 0 | 10 | 0 |
| B | 0 | 10 | 0 |
| C | 0 | 10 | 0 |
| D | 0 | 10 | 0 |
| Quadrant | Total seconds | Saturated seconds | Saturation percentage |
|---|---|---|---|
| A | 6471 | 24 | 0.370885% |
| B | 6471 | 129 | 1.993510% |
| C | 6471 | 290 | 4.481533% |
| D | 6471 | 253 | 3.909751% |
Noise dominated data is calculated using 1-second bins in cleaned event files. If a bin has >2000 counts, and if more than 50% of those come from <1% of pixels, then it is considered to be noise-dominated and hence unusable.
| Quadrant | # 1 sec bins | Bins with >0 counts | Bins with >2000 counts | High rate bins dominated by noise | Noise dominated (total time) | Noise dominated (detector-on time) | Marked lightcurve |
|---|---|---|---|---|---|---|---|
| A | 7401 | 6472 | 1 | 1 | 0.01% | 0.02% | 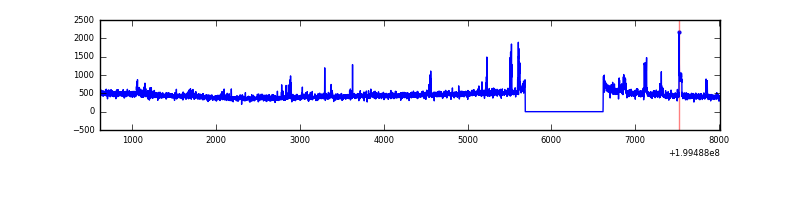 |
| B | 7401 | 6472 | 86 | 86 | 1.16% | 1.33% | 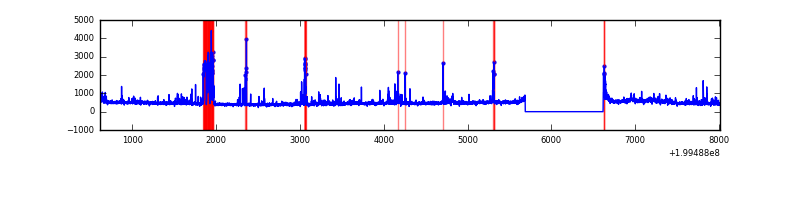 |
| C | 7401 | 6472 | 238 | 238 | 3.22% | 3.68% | 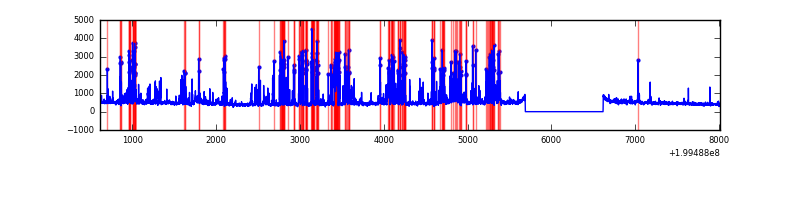 |
| D | 7401 | 6472 | 224 | 224 | 3.03% | 3.46% | 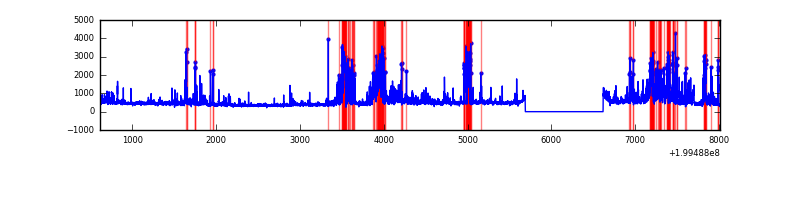 |
Top three noisy pixels from each quadrant. If the there are fewer than three noisy pixels in the level2.evt file, extra rows are filled as -1
| Pixel properties | Quadrant properties | ||||||
|---|---|---|---|---|---|---|---|
| Quadrant | DetID | PixID | Counts | Sigma | Mean | Median | Sigma |
| A | 3 | 1 | 89745 | 581.16 | 738 | 723 | 153.2 |
| A | 14 | 249 | 60646 | 391.19 | 738 | 723 | 153.2 |
| A | 12 | 247 | 16559 | 103.38 | 738 | 723 | 153.2 |
| B | 5 | 70 | 296431 | 2035.85 | 747 | 729 | 145.2 |
| B | 4 | 81 | 109673 | 750.06 | 747 | 729 | 145.2 |
| B | 3 | 0 | 77092 | 525.74 | 747 | 729 | 145.2 |
| C | 14 | 223 | 1302268 | 7784.73 | 712 | 716 | 167.2 |
| C | 1 | 192 | 54336 | 320.71 | 712 | 716 | 167.2 |
| C | 6 | 80 | 18831 | 108.35 | 712 | 716 | 167.2 |
| D | 12 | 233 | 784337 | 4551.81 | 703 | 684 | 172.2 |
| D | 13 | 223 | 200824 | 1162.5 | 703 | 684 | 172.2 |
| D | 2 | 136 | 141484 | 817.83 | 703 | 684 | 172.2 |
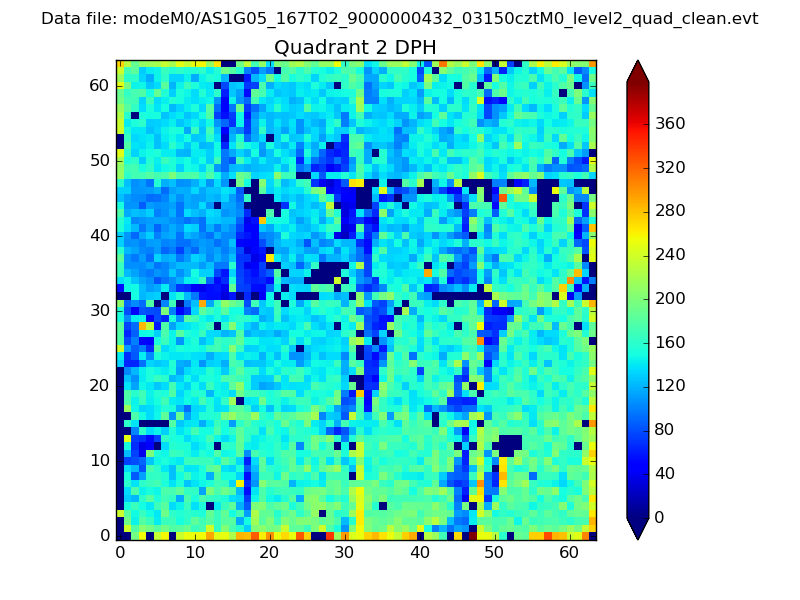
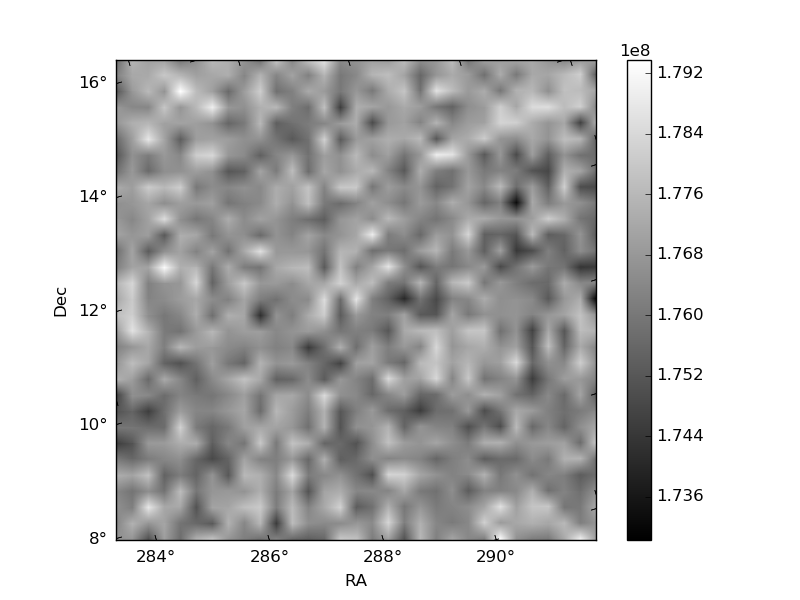
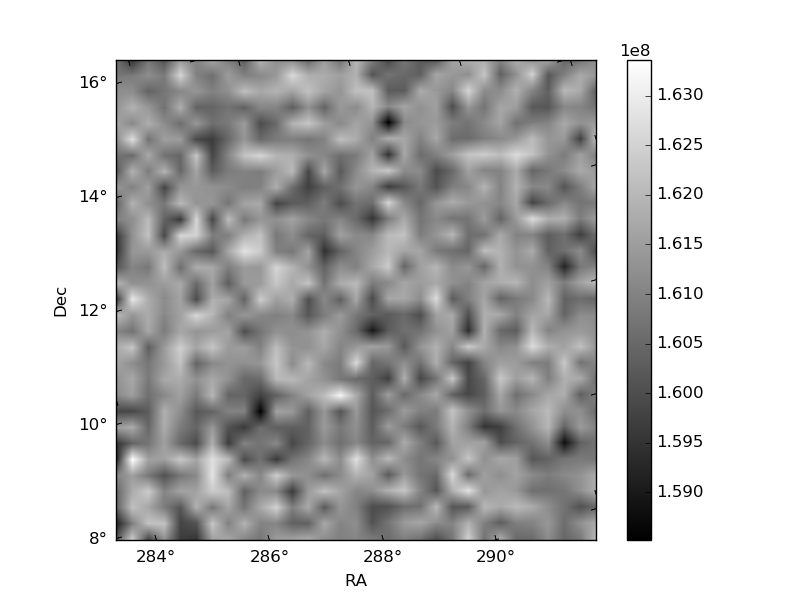
Histogram calculated using DETX and DETY for each event in the final _common_clean file
| Quadrant A | 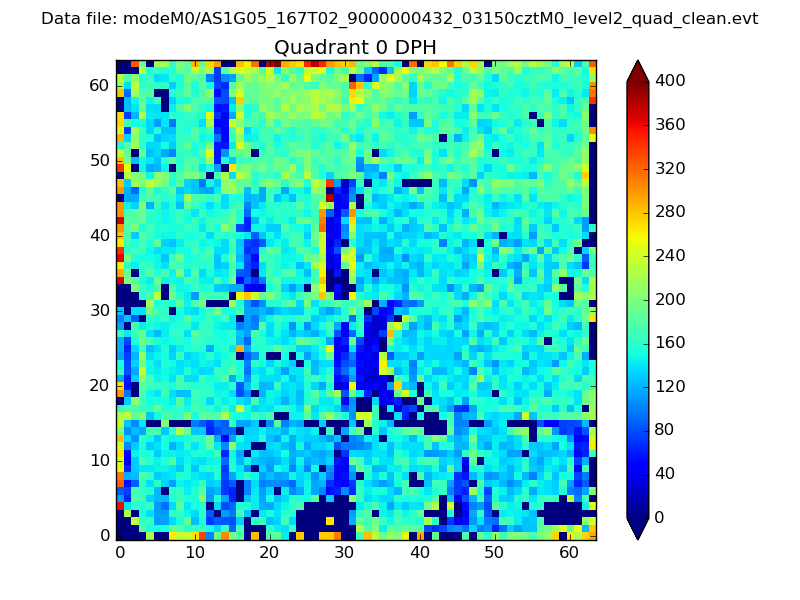 |
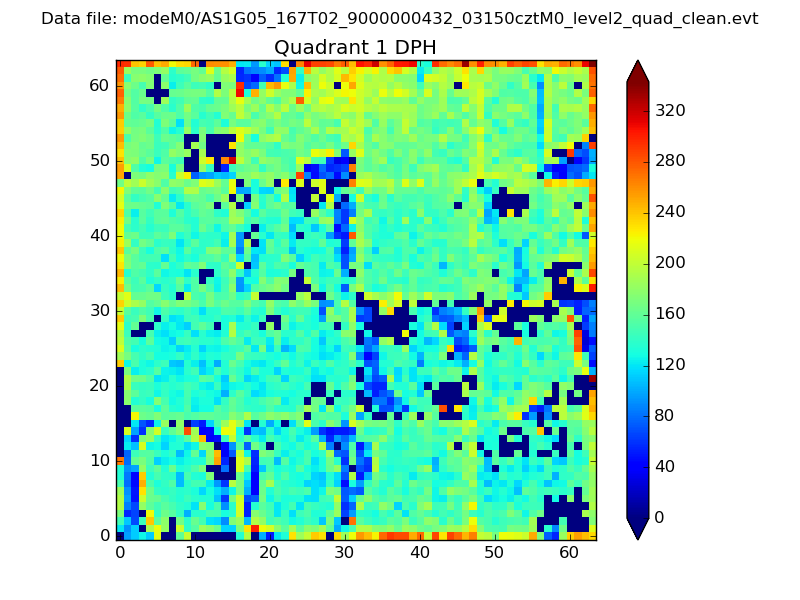 |
Quadrant B |
|---|---|---|---|
| Quadrant D | 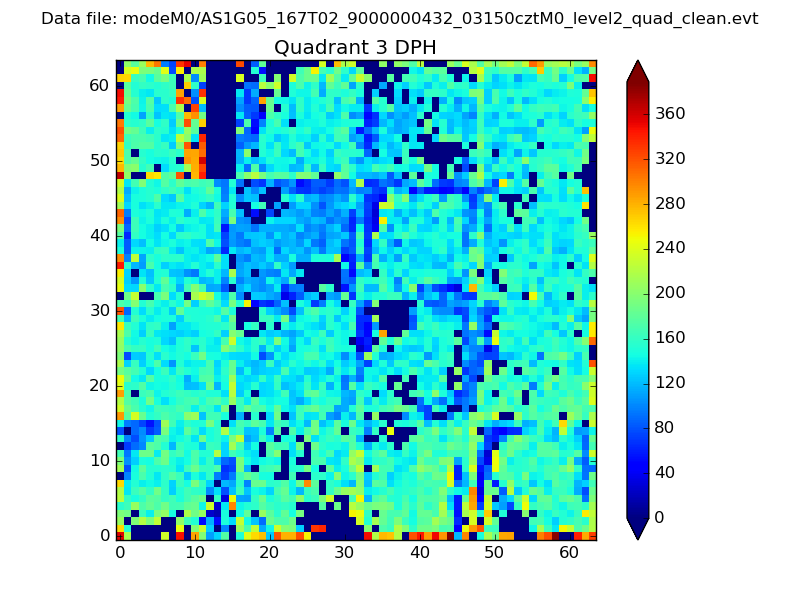 |
 |
Quadrant C |
| Plot type | Count rate plots | Images |
|---|---|---|
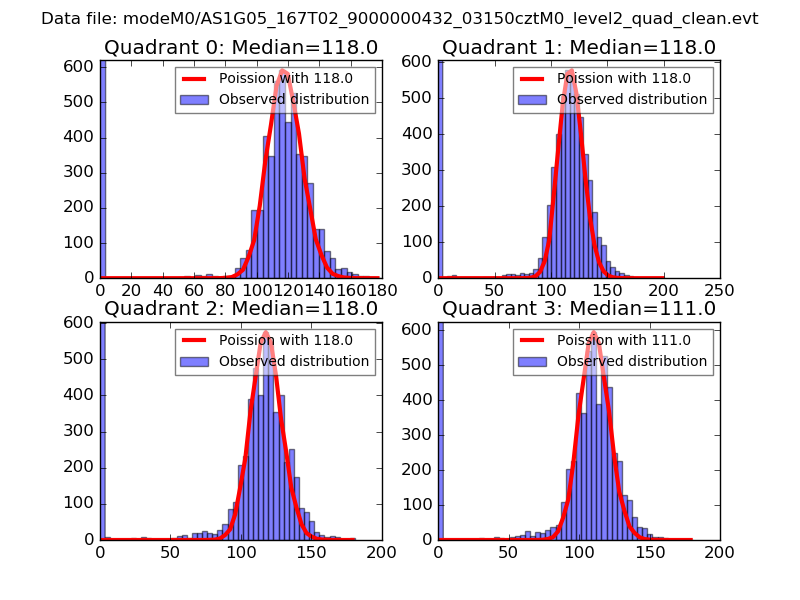
| Comparison with Poisson distribution Blue bars denote a histogram of data divided into 1 sec bins. Red curve is a Poisson curve with rate = median count rate of data. |
 |
 |
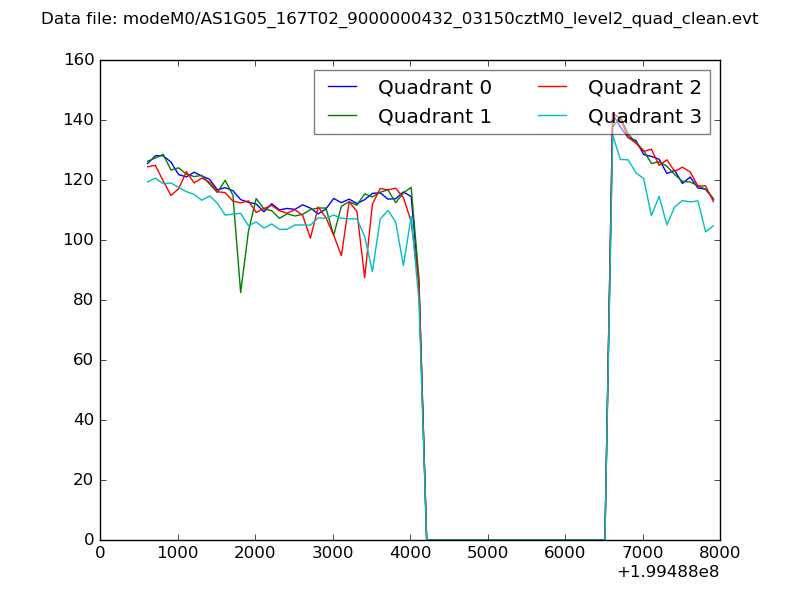
| Quadrant-wise count rates Data is divided into 100 sec bins |
 |
|
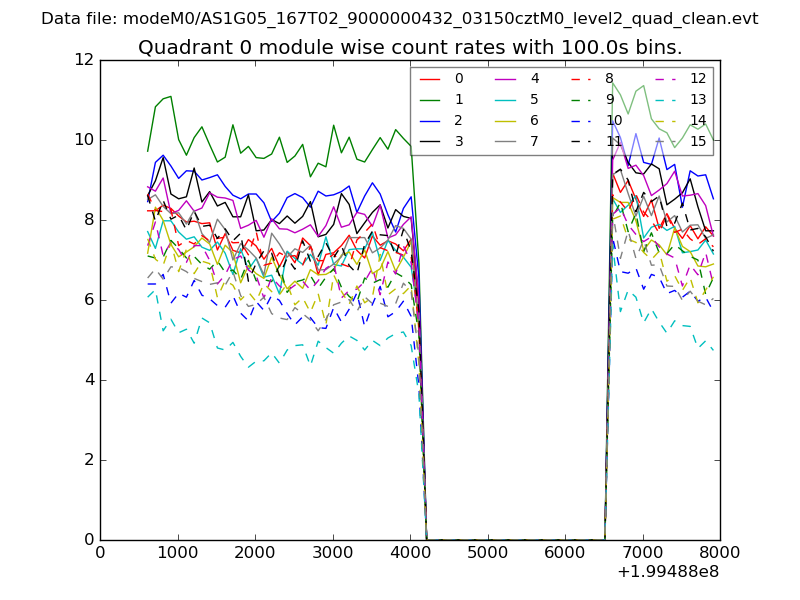
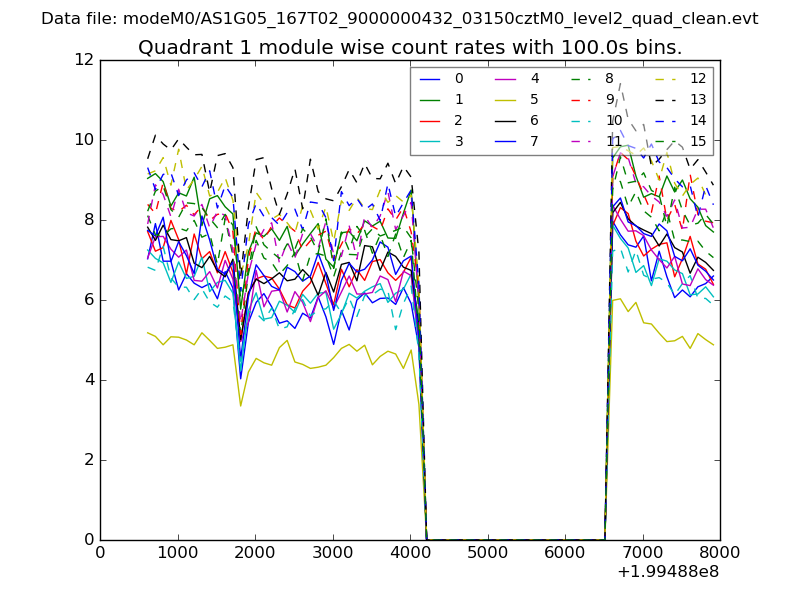
| Module-wise count rates for Quadrant A Data is divided into 100 sec bins |
 |
 |
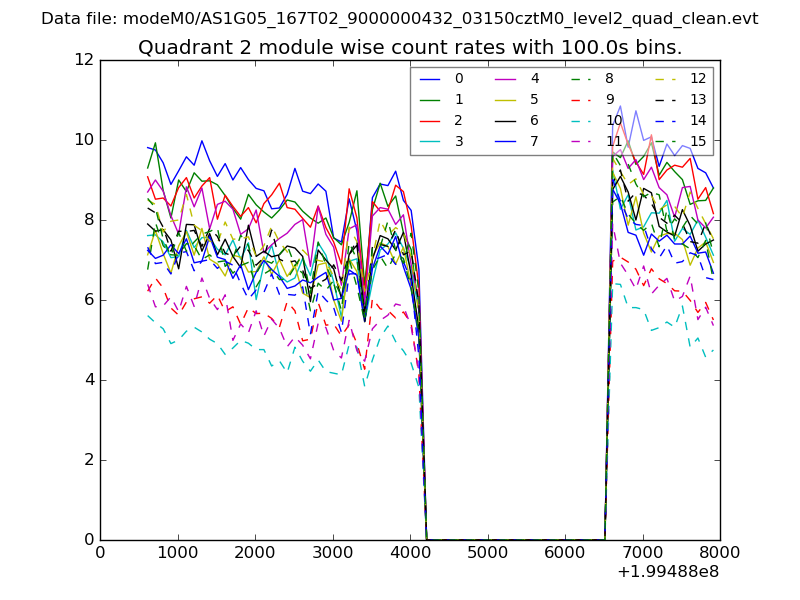
| Module-wise count rates for Quadrant B Data is divided into 100 sec bins |
 |
 |
| Module-wise count rates for Quadrant C Data is divided into 100 sec bins |
 |
 |
| Module-wise count rates for Quadrant D Data is divided into 100 sec bins |
 |
 |
| Parameter | Plot |
|---|---|
| CZT HV Monitor | 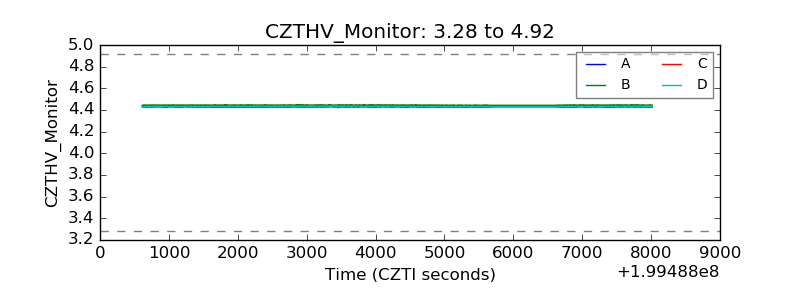 |
| D_VDD | 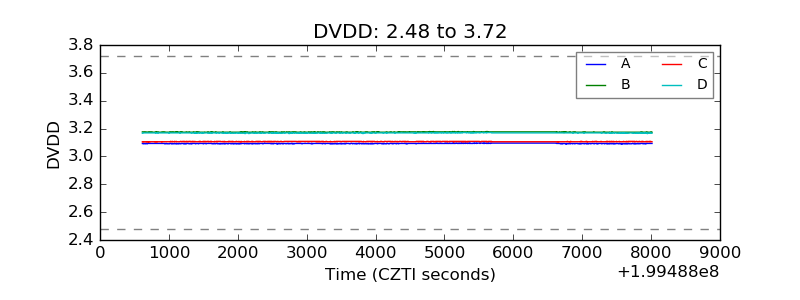 |
| Temperature 1 | 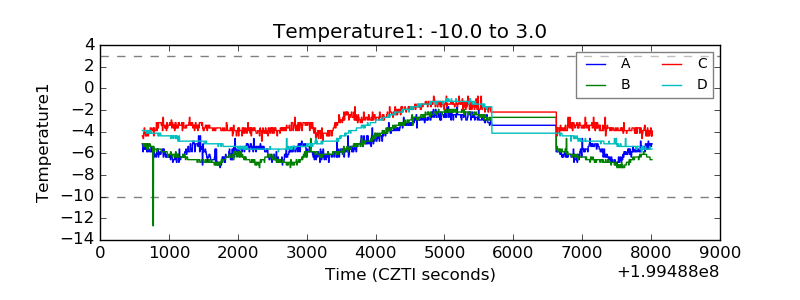 |
| Veto HV Monitor | 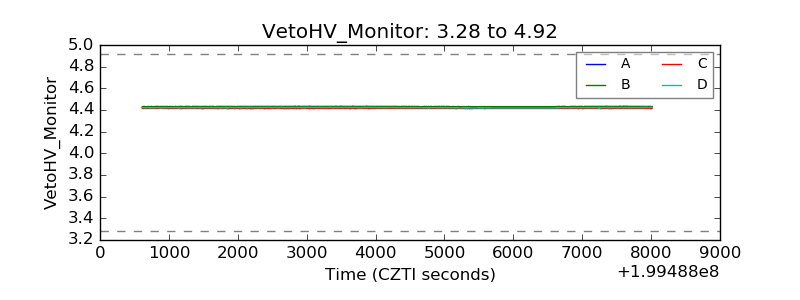 |
| Veto LLD | 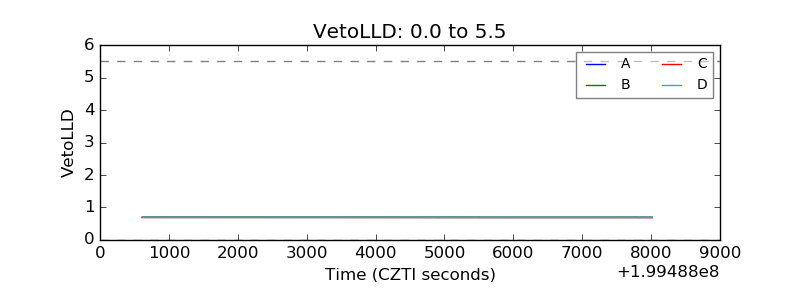 |
| Alpha Counter | 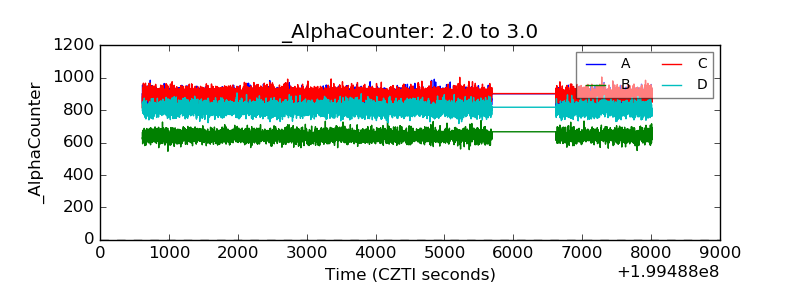 |
| _CPM_Rate | 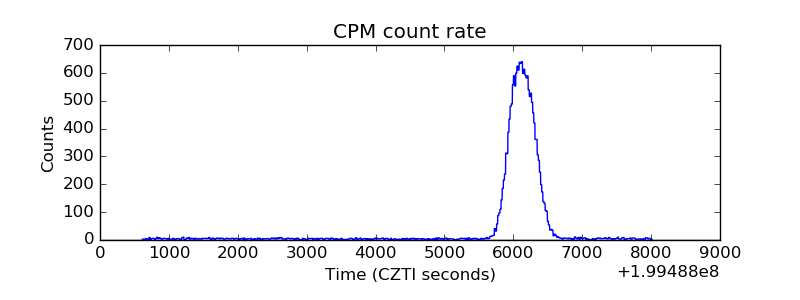 |
| CZT Counter | 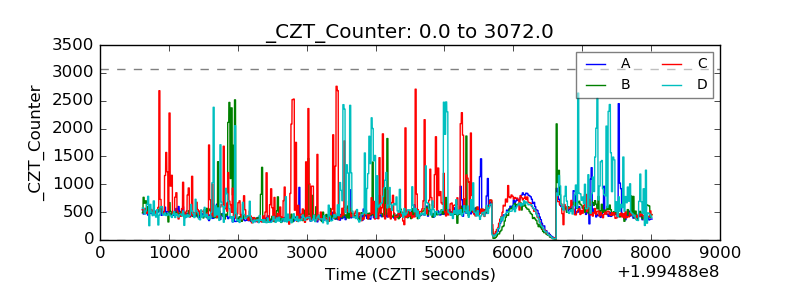 |
| +2.5 Volts monitor |  |
| +5 Volts monitor |  |
| _ROLL_ROT |  |
| _Roll_DEC | 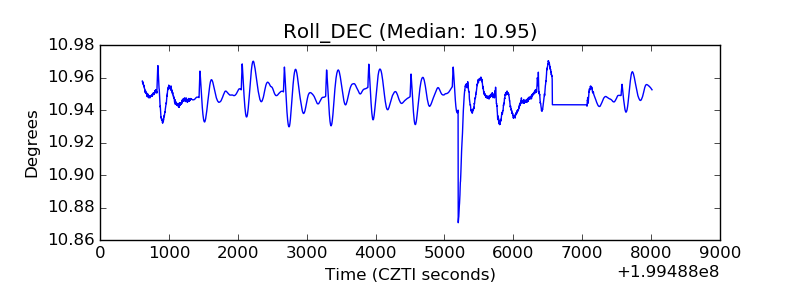 |
| _Roll_RA | 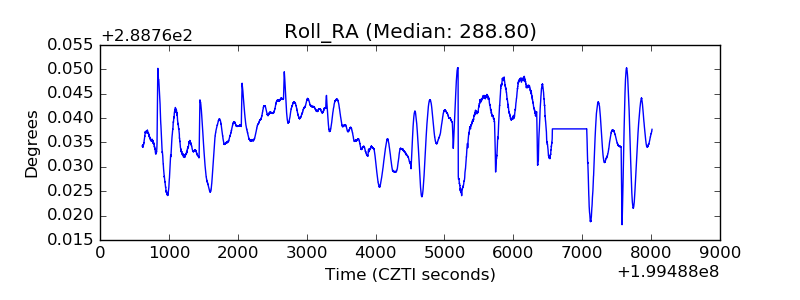 |
| Veto Counter | 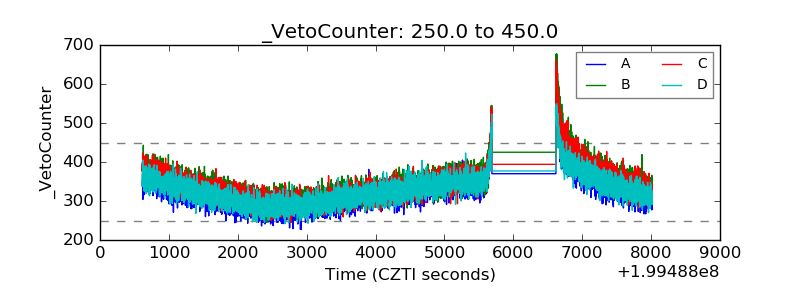 |