| Param | Original file | Final file |
|---|---|---|
| Filename | modeM0/AS1G05_167T02_9000000432_03153cztM0_level2.evt | modeM0/AS1G05_167T02_9000000432_03153cztM0_level2_quad_clean.evt |
| Size (bytes) | 418,760,640 | 78,171,840 |
| Size | 399.4 MB | 74.6 MB |
| Events in quadrant A | 2,804,489 | 494,546 |
| Events in quadrant B | 2,900,215 | 500,708 |
| Events in quadrant C | 2,785,106 | 497,750 |
| Events in quadrant D | 3,791,165 | 461,714 |
| Mode M0 | |||
|---|---|---|---|
| Quadrant | BADHDUFLAG | Total packets | Discarded packets |
| A | 0 | 12595 | 1 |
| B | 0 | 12605 | 1 |
| C | 0 | 12458 | 1 |
| D | 0 | 15459 | 1 |
| Mode SS | |||
|---|---|---|---|
| Quadrant | BADHDUFLAG | Total packets | Discarded packets |
| A | 0 | 122 | 0 |
| B | 0 | 122 | 0 |
| C | 0 | 122 | 0 |
| D | 0 | 122 | 0 |
| Mode M9 | |||
|---|---|---|---|
| Quadrant | BADHDUFLAG | Total packets | Discarded packets |
| A | 0 | 10 | 0 |
| B | 0 | 10 | 0 |
| C | 0 | 10 | 0 |
| D | 0 | 10 | 0 |
| Quadrant | Total seconds | Saturated seconds | Saturation percentage |
|---|---|---|---|
| A | 5894 | 49 | 0.831354% |
| B | 5894 | 40 | 0.678656% |
| C | 5894 | 42 | 0.712589% |
| D | 5894 | 176 | 2.986088% |
Noise dominated data is calculated using 1-second bins in cleaned event files. If a bin has >2000 counts, and if more than 50% of those come from <1% of pixels, then it is considered to be noise-dominated and hence unusable.
| Quadrant | # 1 sec bins | Bins with >0 counts | Bins with >2000 counts | High rate bins dominated by noise | Noise dominated (total time) | Noise dominated (detector-on time) | Marked lightcurve |
|---|---|---|---|---|---|---|---|
| A | 6964 | 5895 | 10 | 10 | 0.14% | 0.17% | 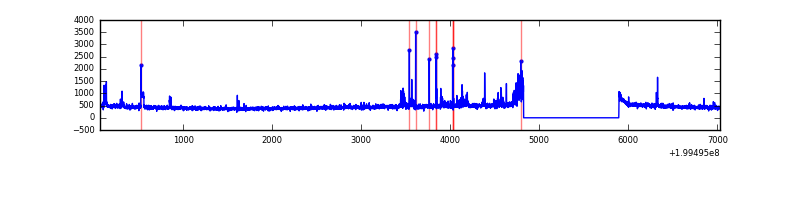 |
| B | 6964 | 5895 | 9 | 9 | 0.13% | 0.15% | 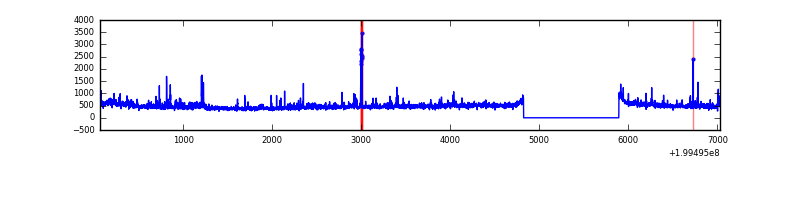 |
| C | 6964 | 5895 | 34 | 34 | 0.49% | 0.58% | 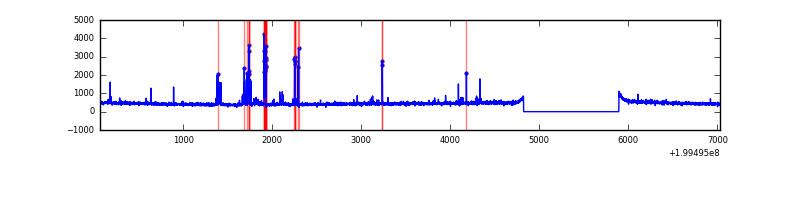 |
| D | 6964 | 5895 | 163 | 163 | 2.34% | 2.77% | 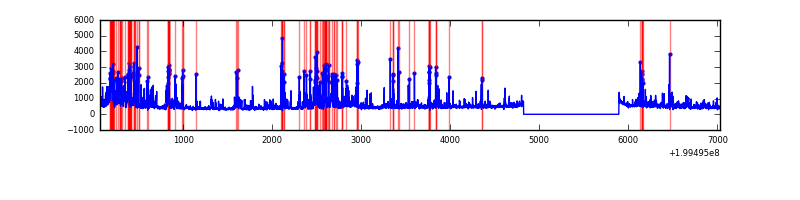 |
Top three noisy pixels from each quadrant. If the there are fewer than three noisy pixels in the level2.evt file, extra rows are filled as -1
| Pixel properties | Quadrant properties | ||||||
|---|---|---|---|---|---|---|---|
| Quadrant | DetID | PixID | Counts | Sigma | Mean | Median | Sigma |
| A | 14 | 249 | 162836 | 1167.86 | 673 | 658 | 138.9 |
| A | 3 | 1 | 40381 | 286.05 | 673 | 658 | 138.9 |
| A | 12 | 247 | 7636 | 50.25 | 673 | 658 | 138.9 |
| B | 4 | 81 | 61452 | 455.54 | 685 | 669 | 133.4 |
| B | 5 | 70 | 60581 | 449.01 | 685 | 669 | 133.4 |
| B | 3 | 0 | 60534 | 448.66 | 685 | 669 | 133.4 |
| C | 14 | 223 | 150337 | 972.16 | 656 | 662 | 154.0 |
| C | 14 | 234 | 22314 | 140.63 | 656 | 662 | 154.0 |
| C | 15 | 208 | 16194 | 100.88 | 656 | 662 | 154.0 |
| D | 12 | 233 | 797343 | 5090.62 | 641 | 622 | 156.5 |
| D | 2 | 136 | 143160 | 910.74 | 641 | 622 | 156.5 |
| D | 13 | 223 | 116293 | 739.08 | 641 | 622 | 156.5 |
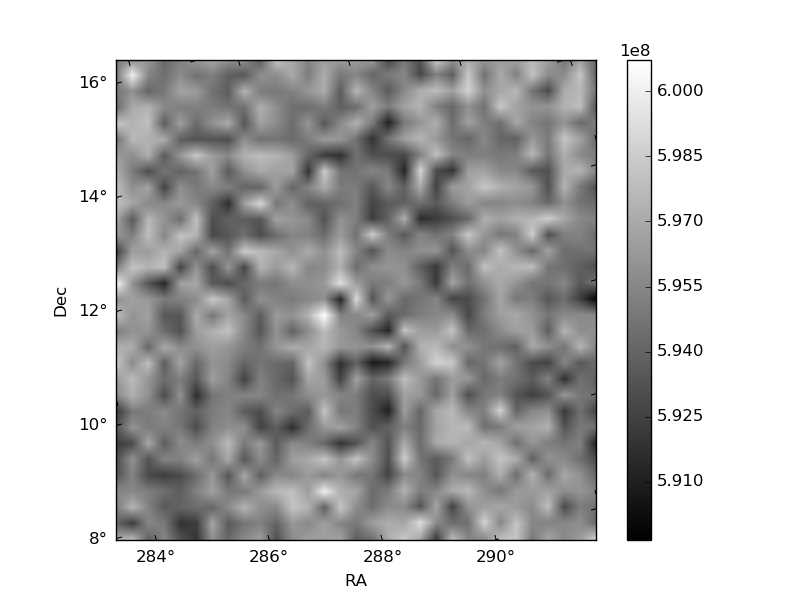
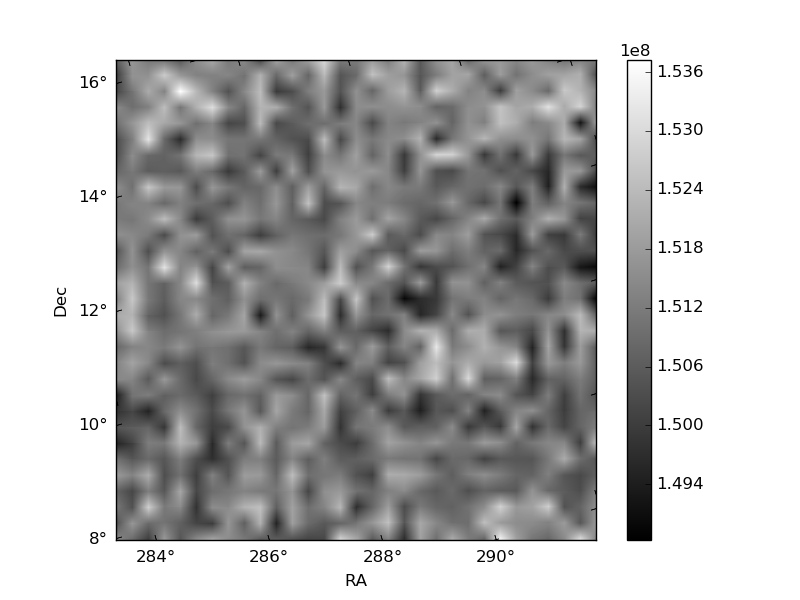
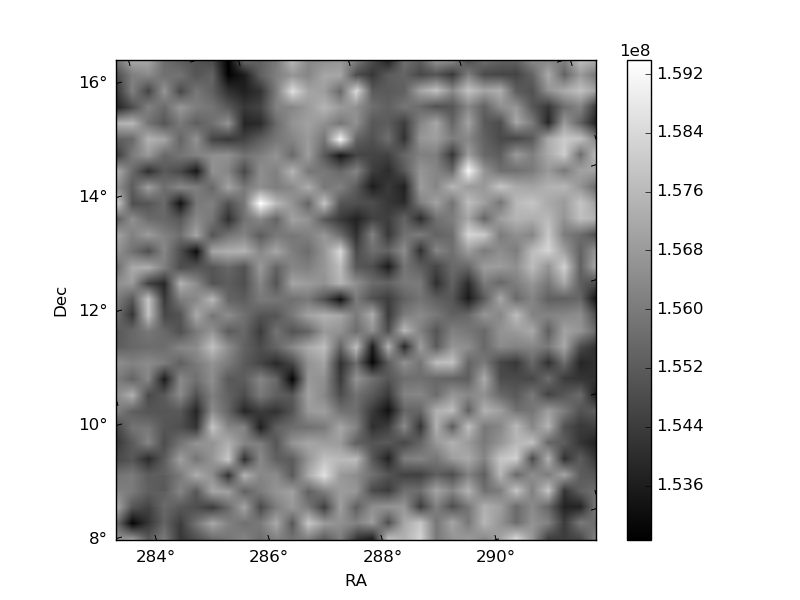
Histogram calculated using DETX and DETY for each event in the final _common_clean file
| Quadrant A | 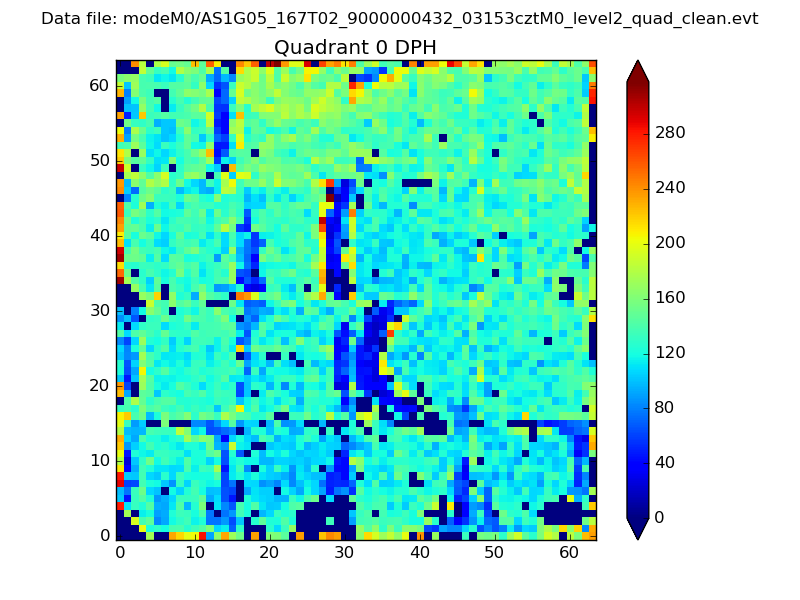 |
 |
Quadrant B |
|---|---|---|---|
| Quadrant D | 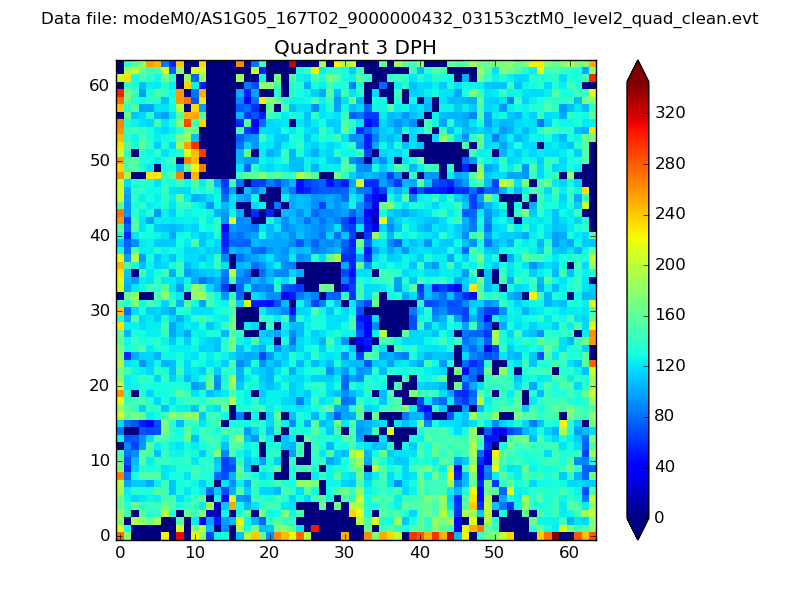 |
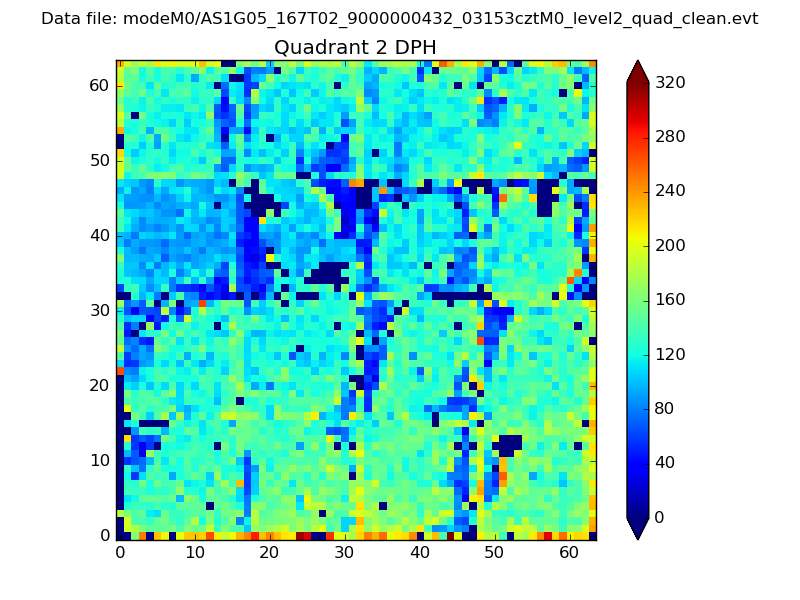 |
Quadrant C |
| Plot type | Count rate plots | Images |
|---|---|---|
| Comparison with Poisson distribution Blue bars denote a histogram of data divided into 1 sec bins. Red curve is a Poisson curve with rate = median count rate of data. |
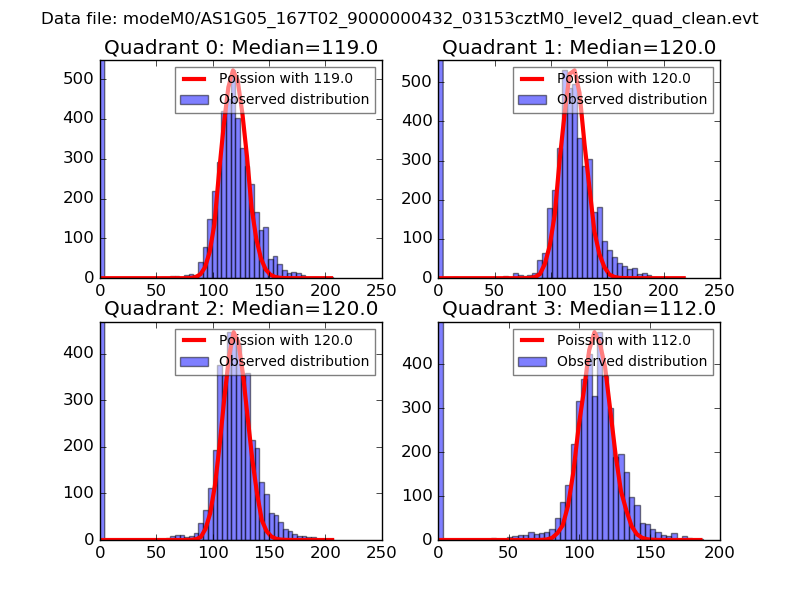 |
 |
| Quadrant-wise count rates Data is divided into 100 sec bins |
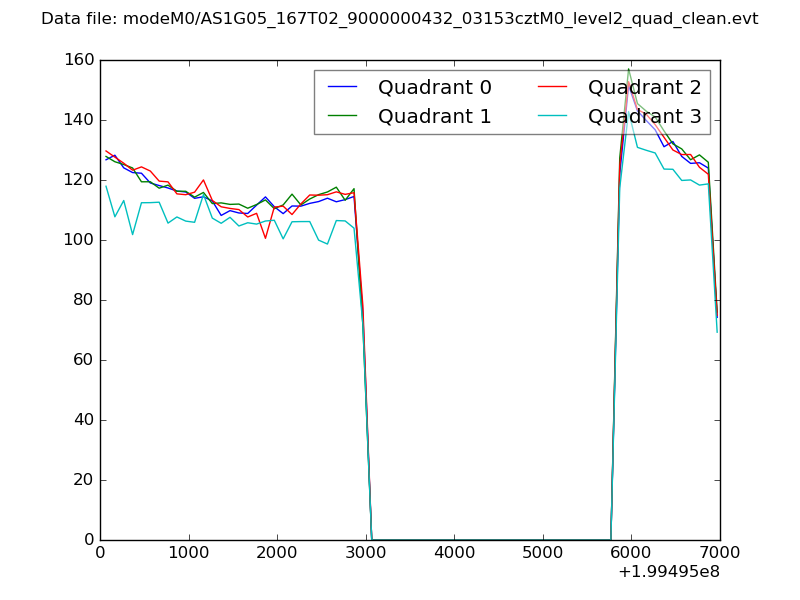 |
|
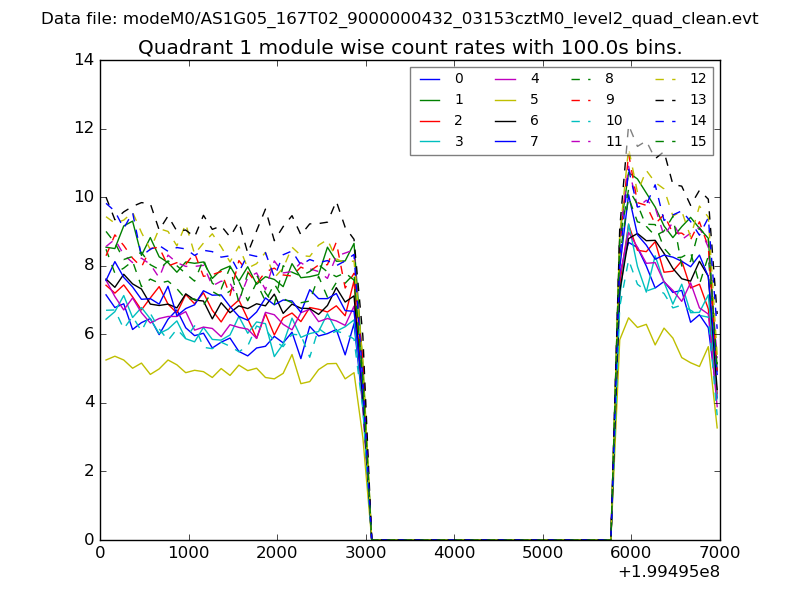
| Module-wise count rates for Quadrant A Data is divided into 100 sec bins |
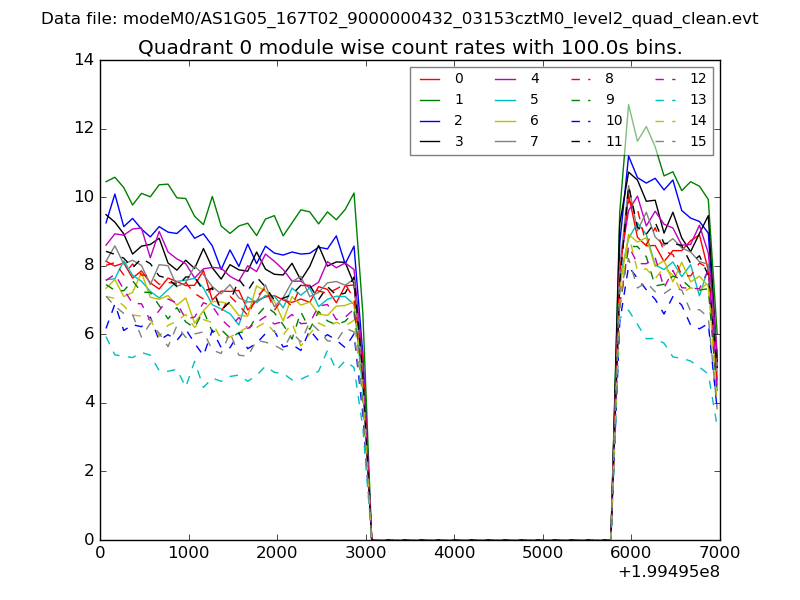 |
 |
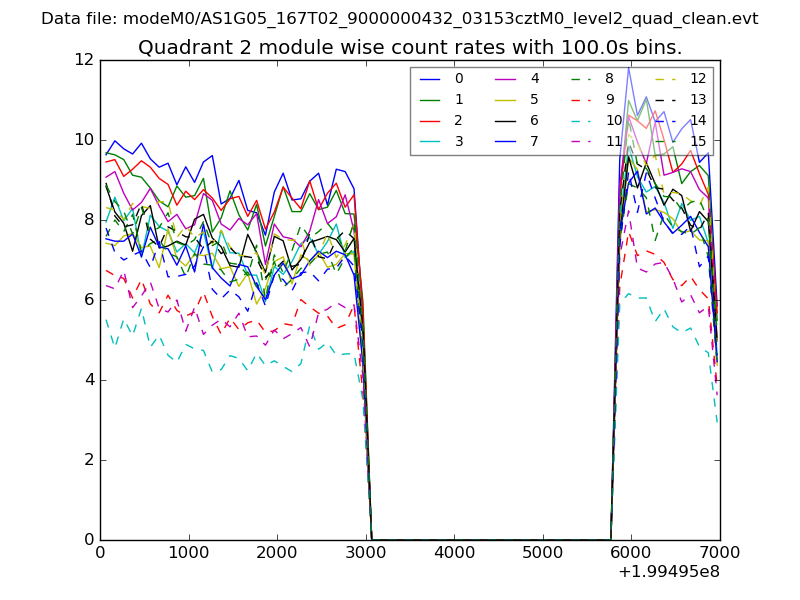
| Module-wise count rates for Quadrant B Data is divided into 100 sec bins |
 |
 |
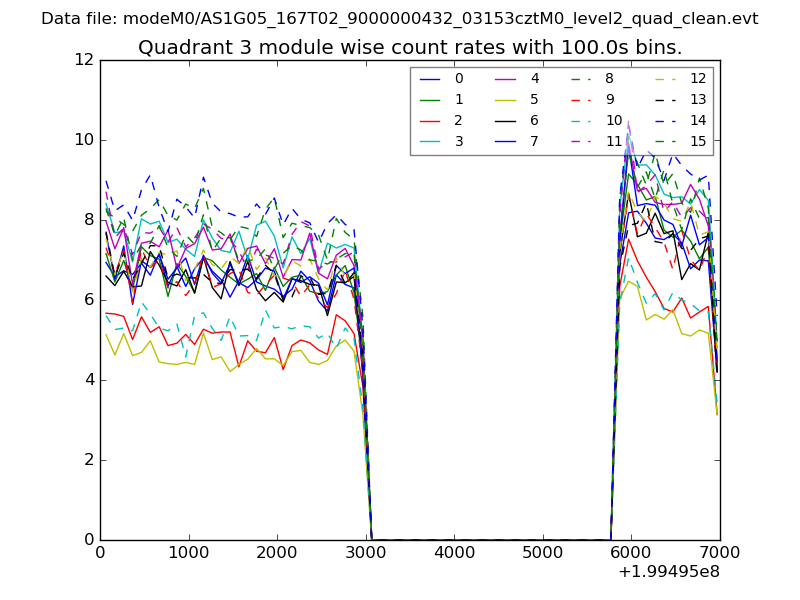
| Module-wise count rates for Quadrant C Data is divided into 100 sec bins |
 |
 |
| Module-wise count rates for Quadrant D Data is divided into 100 sec bins |
 |
 |
| Parameter | Plot |
|---|---|
| CZT HV Monitor | 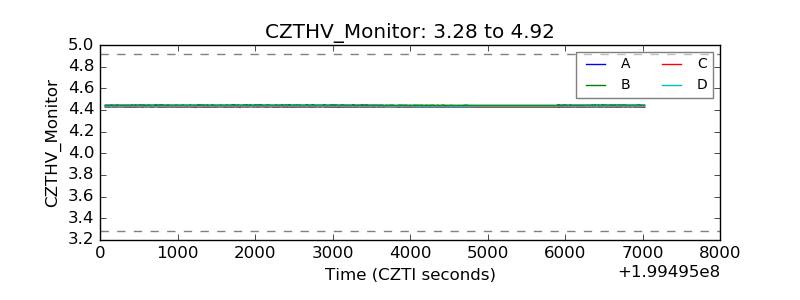 |
| D_VDD | 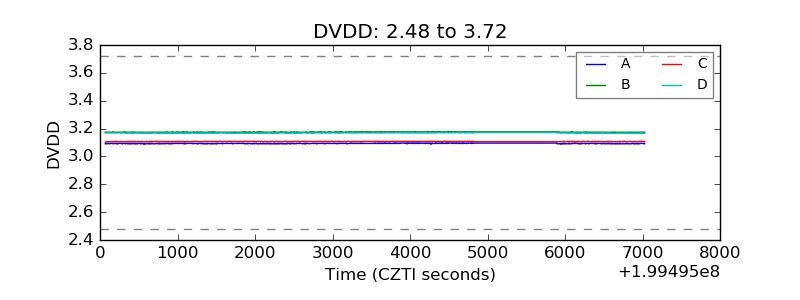 |
| Temperature 1 | 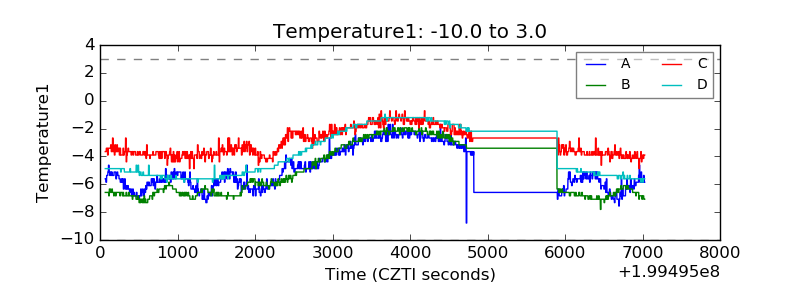 |
| Veto HV Monitor | 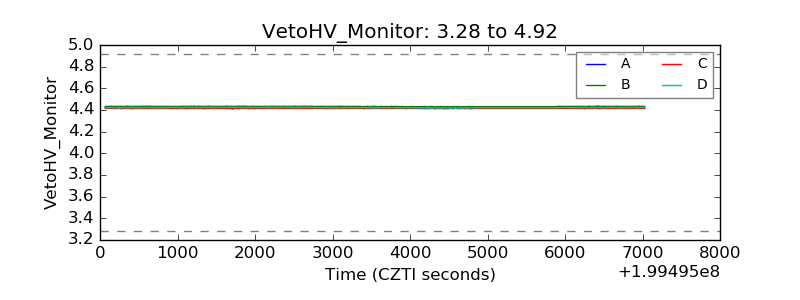 |
| Veto LLD | 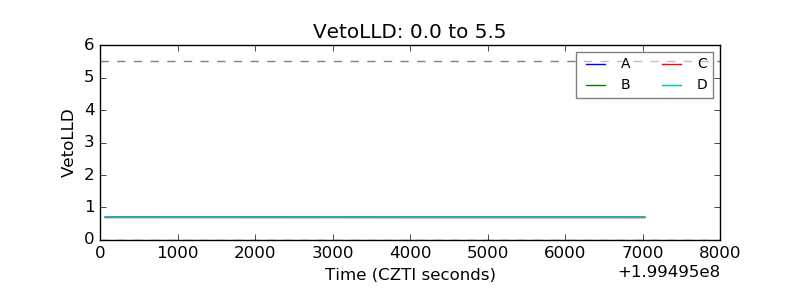 |
| Alpha Counter | 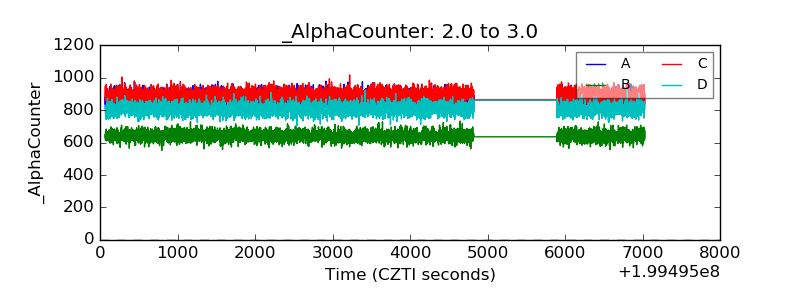 |
| _CPM_Rate | 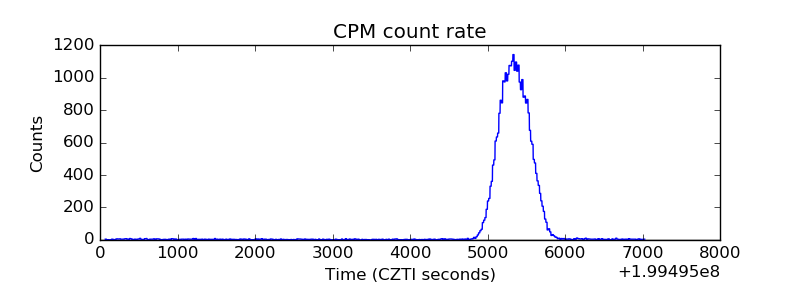 |
| CZT Counter | 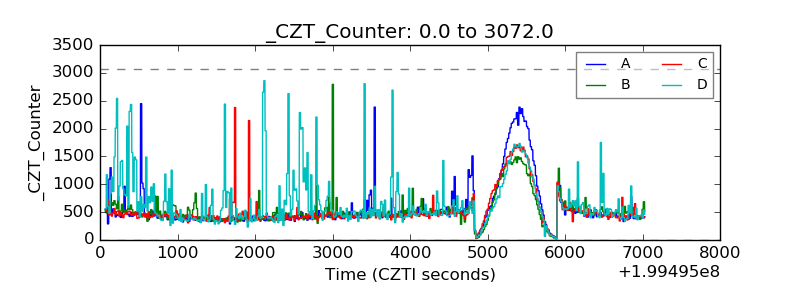 |
| +2.5 Volts monitor |  |
| +5 Volts monitor |  |
| _ROLL_ROT | 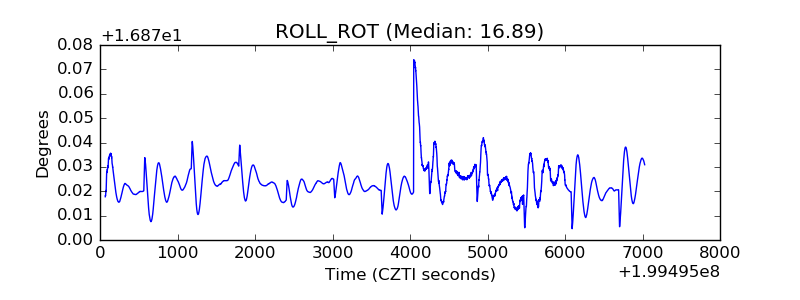 |
| _Roll_DEC | 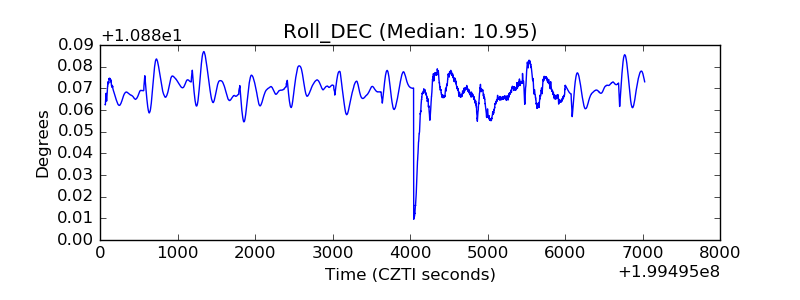 |
| _Roll_RA | 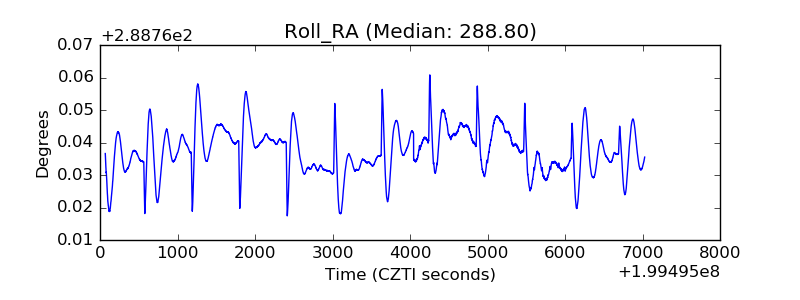 |
| Veto Counter | 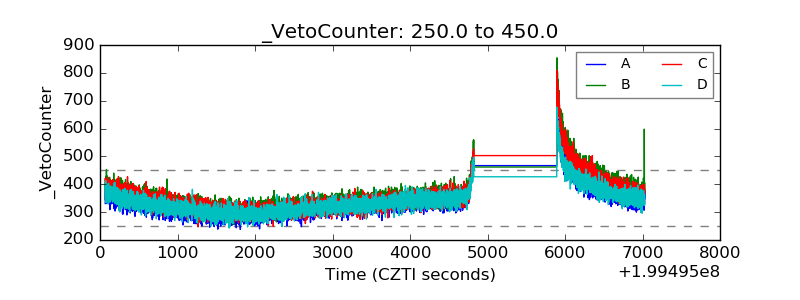 |