| Param | Original file | Final file |
|---|---|---|
| Filename | modeM0/AS1G05_218T02_9000000434_03154cztM0_level2.evt | modeM0/AS1G05_218T02_9000000434_03154cztM0_level2_quad_clean.evt |
| Size (bytes) | 451,402,560 | 77,051,520 |
| Size | 430.5 MB | 73.5 MB |
| Events in quadrant A | 3,735,616 | 472,068 |
| Events in quadrant B | 3,241,964 | 490,475 |
| Events in quadrant C | 3,093,256 | 471,548 |
| Events in quadrant D | 3,166,500 | 453,870 |
| Mode SS | |||
|---|---|---|---|
| Quadrant | BADHDUFLAG | Total packets | Discarded packets |
| A | 0 | 128 | 0 |
| B | 0 | 128 | 0 |
| C | 0 | 128 | 0 |
| D | 0 | 128 | 0 |
| Mode M0 | |||
|---|---|---|---|
| Quadrant | BADHDUFLAG | Total packets | Discarded packets |
| A | 0 | 15508 | 2 |
| B | 0 | 13862 | 1 |
| C | 0 | 13695 | 1 |
| D | 0 | 13952 | 1 |
| Mode M9 | |||
|---|---|---|---|
| Quadrant | BADHDUFLAG | Total packets | Discarded packets |
| A | 0 | 13 | 0 |
| B | 0 | 13 | 0 |
| C | 0 | 13 | 0 |
| D | 0 | 13 | 0 |
| Quadrant | Total seconds | Saturated seconds | Saturation percentage |
|---|---|---|---|
| A | 6383 | 184 | 2.882657% |
| B | 6383 | 65 | 1.018330% |
| C | 6383 | 87 | 1.362995% |
| D | 6383 | 46 | 0.720664% |
Noise dominated data is calculated using 1-second bins in cleaned event files. If a bin has >2000 counts, and if more than 50% of those come from <1% of pixels, then it is considered to be noise-dominated and hence unusable.
| Quadrant | # 1 sec bins | Bins with >0 counts | Bins with >2000 counts | High rate bins dominated by noise | Noise dominated (total time) | Noise dominated (detector-on time) | Marked lightcurve |
|---|---|---|---|---|---|---|---|
| A | 7663 | 6384 | 123 | 123 | 1.61% | 1.93% |  |
| B | 7663 | 6384 | 26 | 26 | 0.34% | 0.41% | 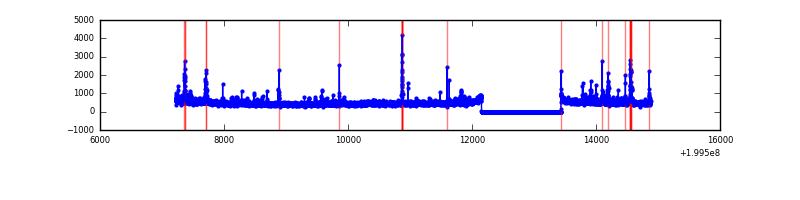 |
| C | 7663 | 6384 | 42 | 42 | 0.55% | 0.66% | 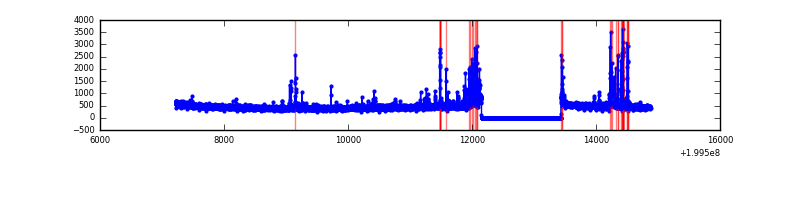 |
| D | 7663 | 6384 | 33 | 33 | 0.43% | 0.52% | 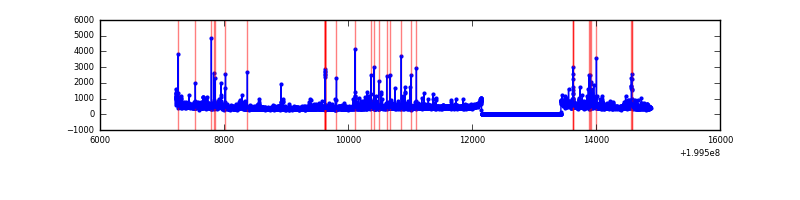 |
Top three noisy pixels from each quadrant. If the there are fewer than three noisy pixels in the level2.evt file, extra rows are filled as -1
| Pixel properties | Quadrant properties | ||||||
|---|---|---|---|---|---|---|---|
| Quadrant | DetID | PixID | Counts | Sigma | Mean | Median | Sigma |
| A | 14 | 249 | 801040 | 5356.01 | 741 | 725 | 149.4 |
| A | 0 | 31 | 28765 | 187.65 | 741 | 725 | 149.4 |
| A | 0 | 149 | 23852 | 154.77 | 741 | 725 | 149.4 |
| B | 4 | 81 | 161685 | 1110.22 | 762 | 744 | 145.0 |
| B | 2 | 249 | 39904 | 270.13 | 762 | 744 | 145.0 |
| B | 15 | 85 | 36835 | 248.96 | 762 | 744 | 145.0 |
| C | 14 | 223 | 194352 | 1173.3 | 717 | 718 | 165.0 |
| C | 14 | 234 | 60193 | 360.38 | 717 | 718 | 165.0 |
| C | 6 | 80 | 20300 | 118.65 | 717 | 718 | 165.0 |
| D | 12 | 233 | 67371 | 392.19 | 713 | 693 | 170.0 |
| D | 5 | 233 | 57041 | 331.43 | 713 | 693 | 170.0 |
| D | 7 | 39 | 57026 | 331.35 | 713 | 693 | 170.0 |
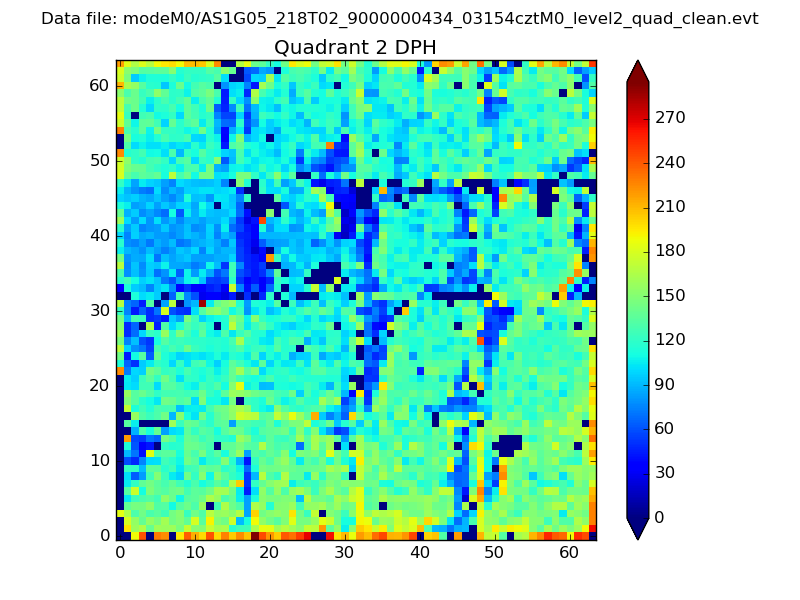
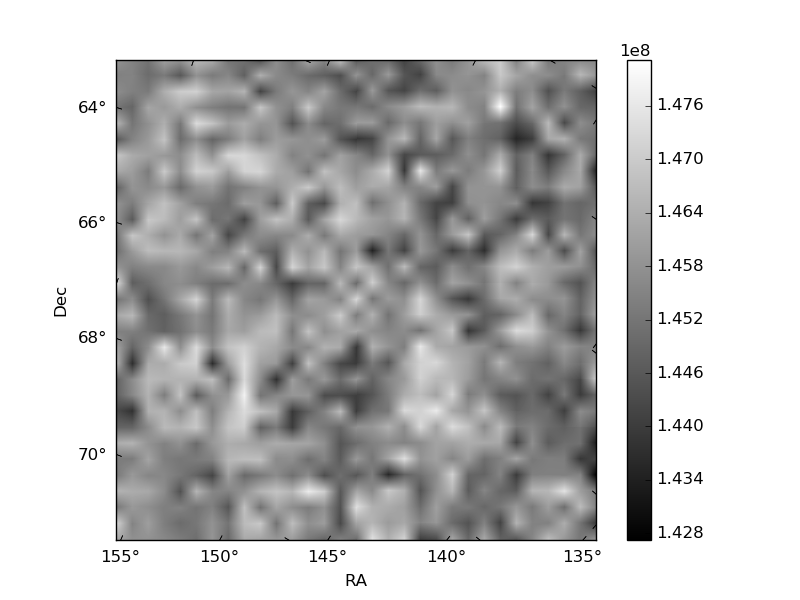
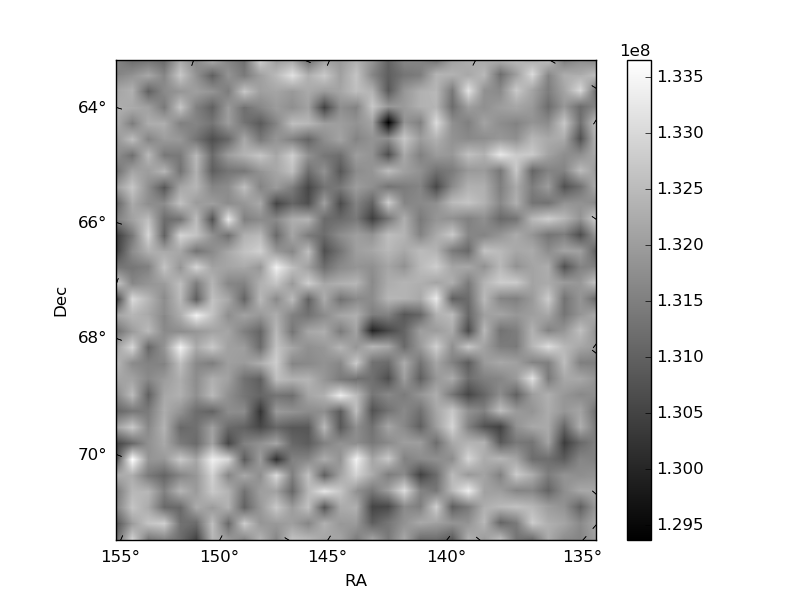
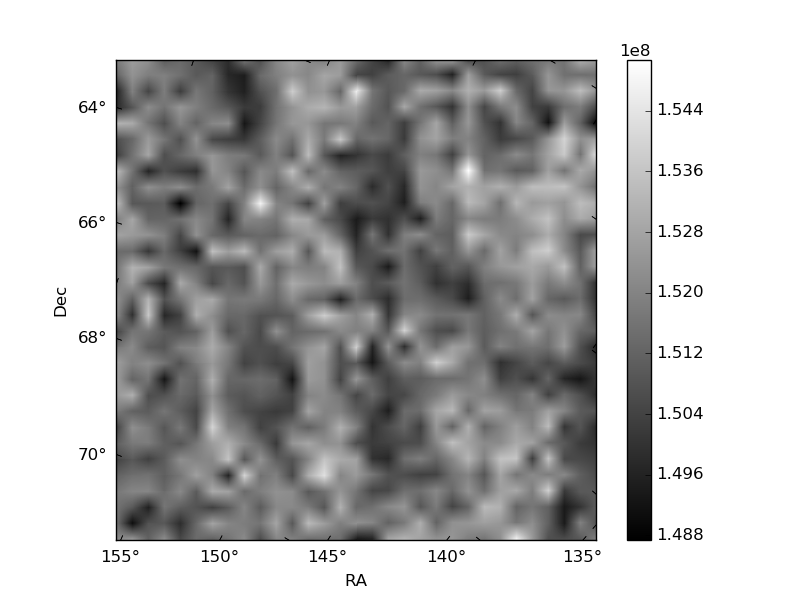
Histogram calculated using DETX and DETY for each event in the final _common_clean file
| Quadrant A | 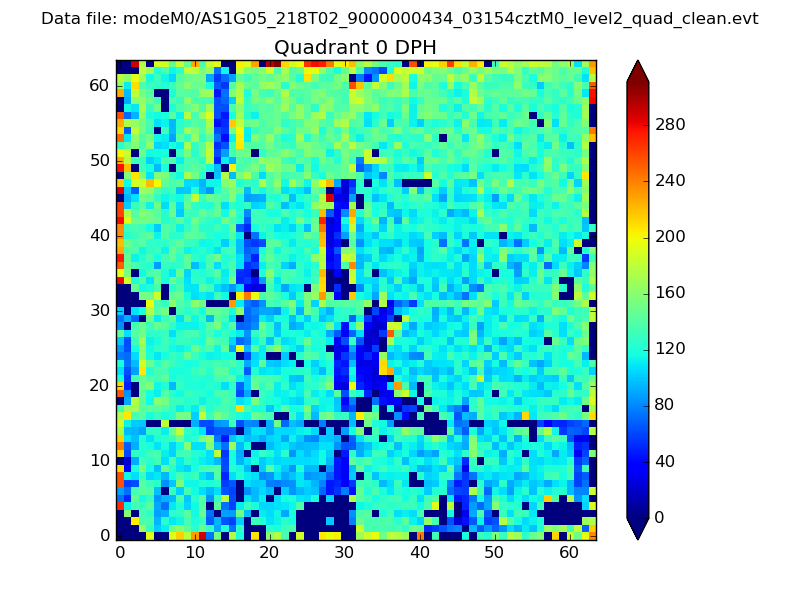 |
 |
Quadrant B |
|---|---|---|---|
| Quadrant D | 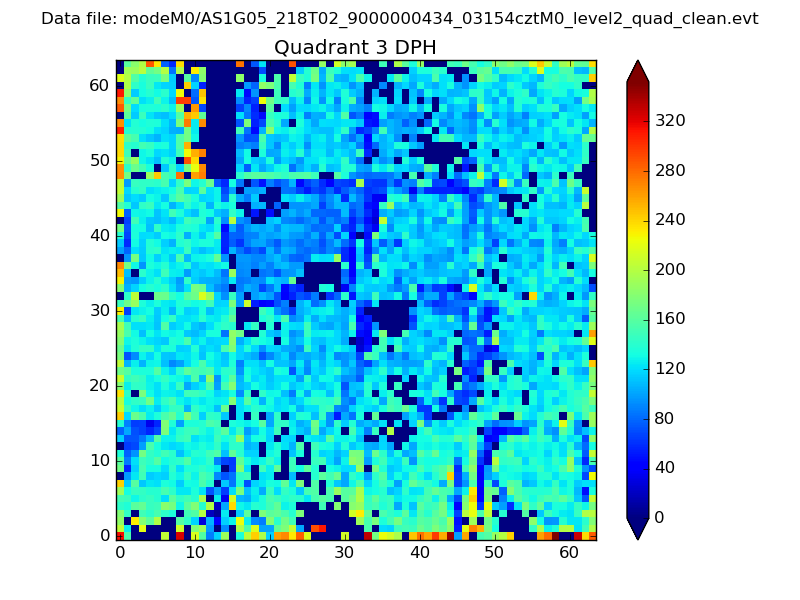 |
 |
Quadrant C |
| Plot type | Count rate plots | Images |
|---|---|---|
| Comparison with Poisson distribution Blue bars denote a histogram of data divided into 1 sec bins. Red curve is a Poisson curve with rate = median count rate of data. |
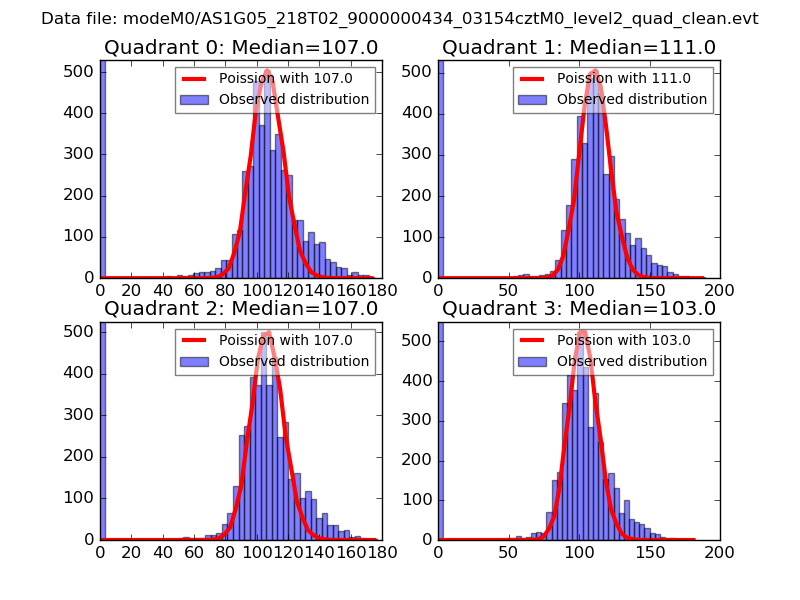 |
 |
| Quadrant-wise count rates Data is divided into 100 sec bins |
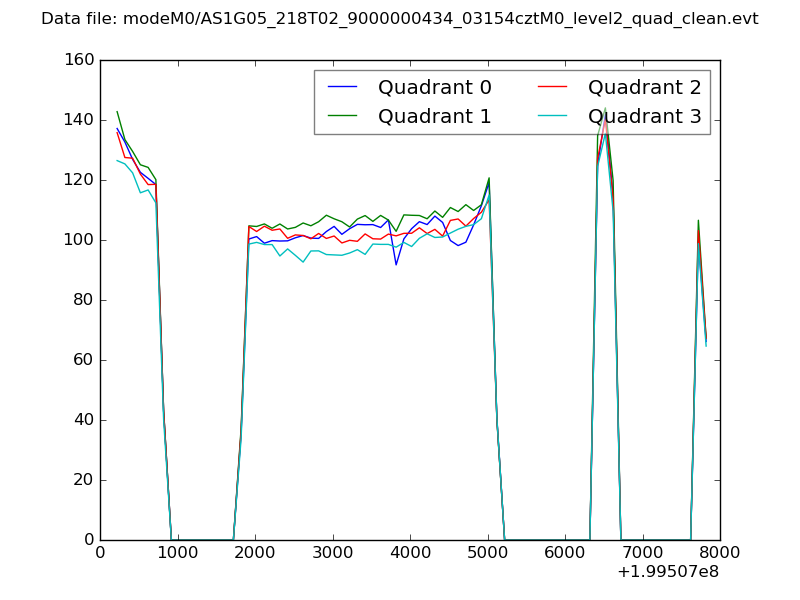 |
|
| Module-wise count rates for Quadrant A Data is divided into 100 sec bins |
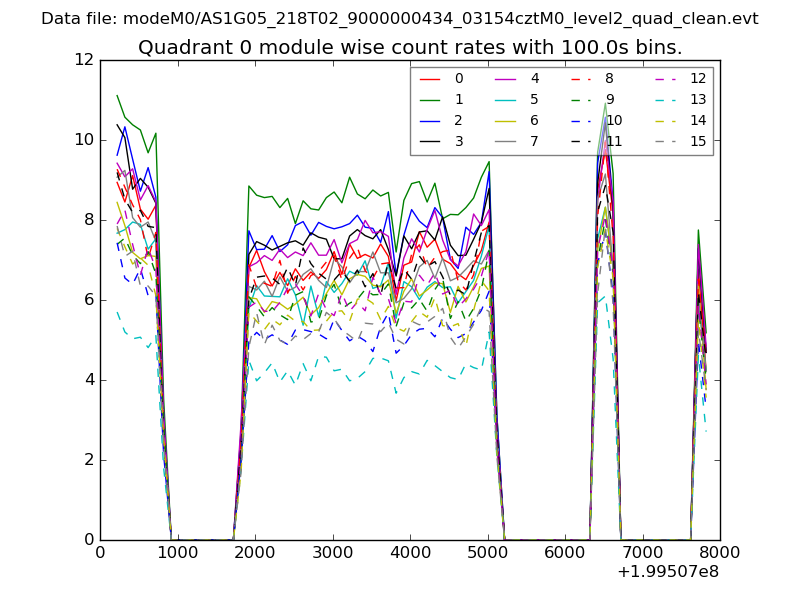 |
 |
| Module-wise count rates for Quadrant B Data is divided into 100 sec bins |
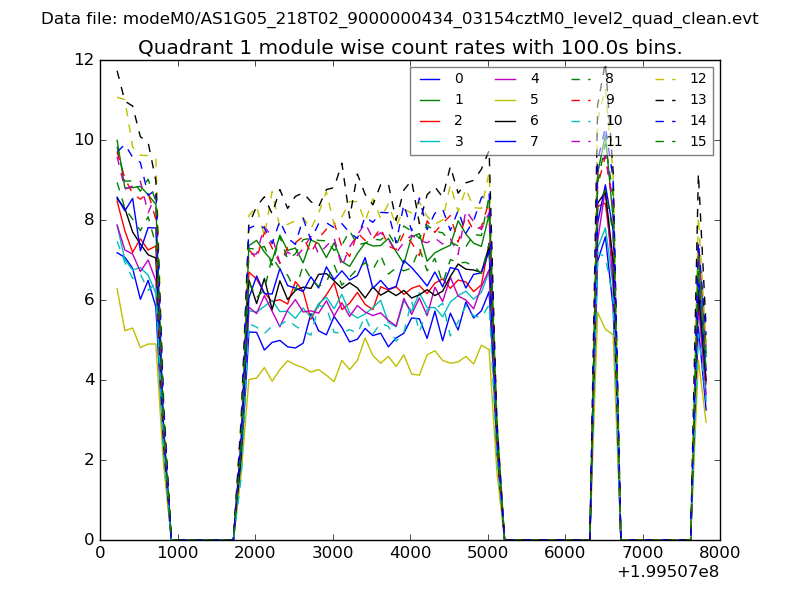 |
 |
| Module-wise count rates for Quadrant C Data is divided into 100 sec bins |
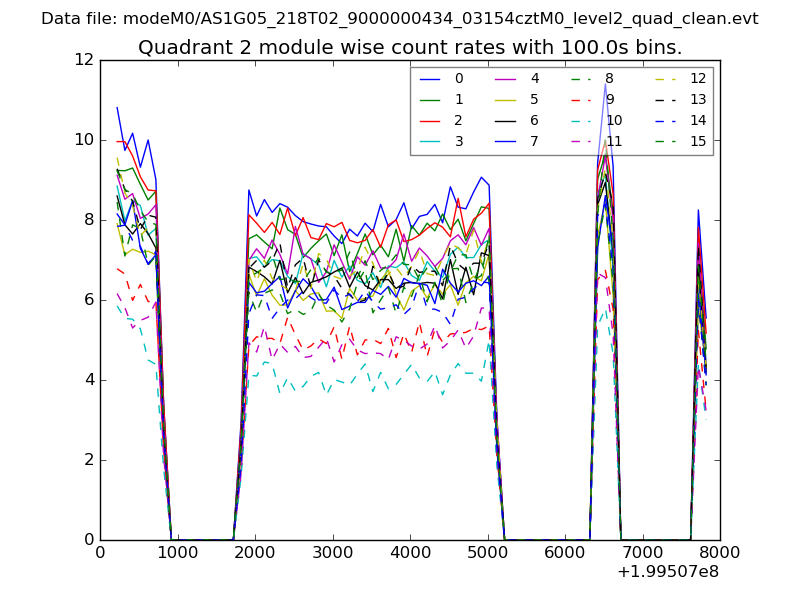 |
 |
| Module-wise count rates for Quadrant D Data is divided into 100 sec bins |
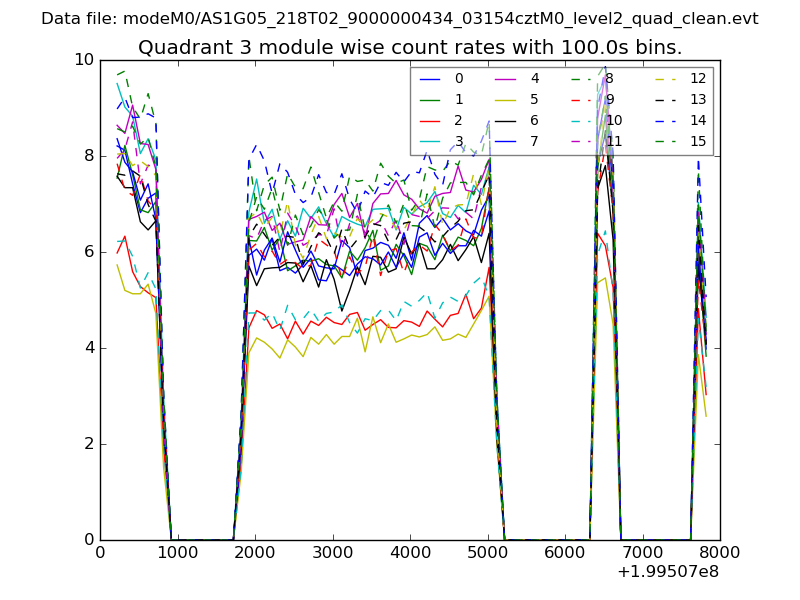 |
 |
| Parameter | Plot |
|---|---|
| CZT HV Monitor | 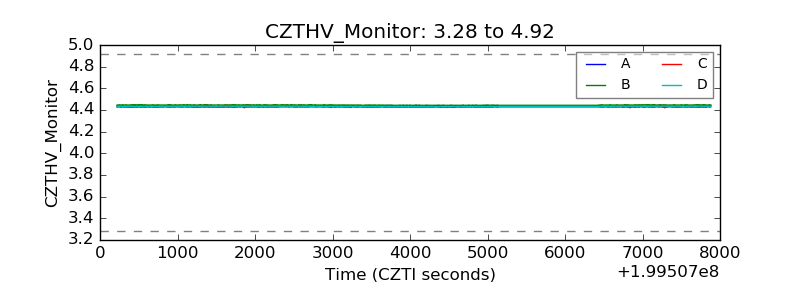 |
| D_VDD | 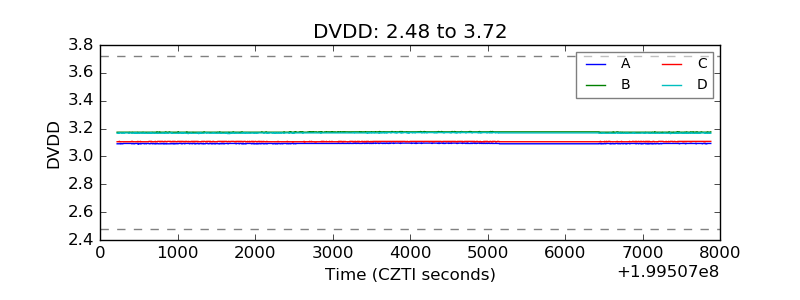 |
| Temperature 1 | 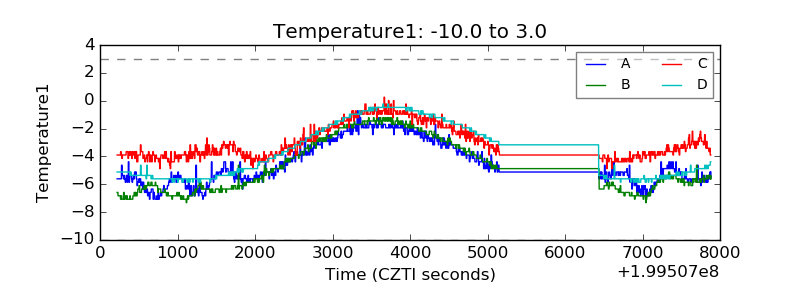 |
| Veto HV Monitor | 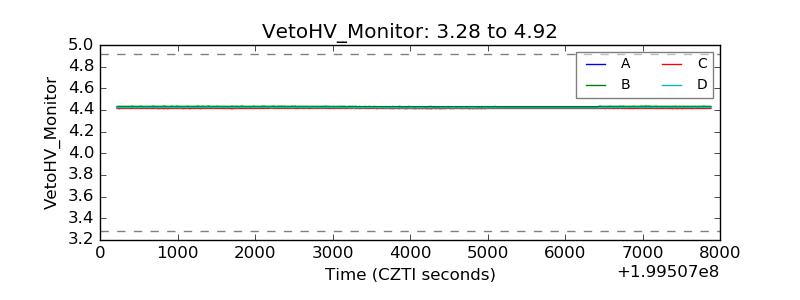 |
| Veto LLD | 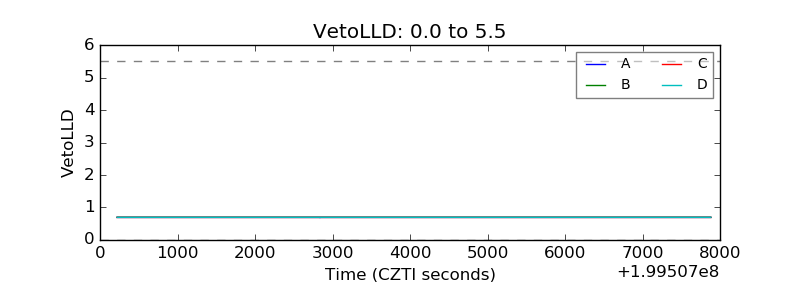 |
| Alpha Counter | 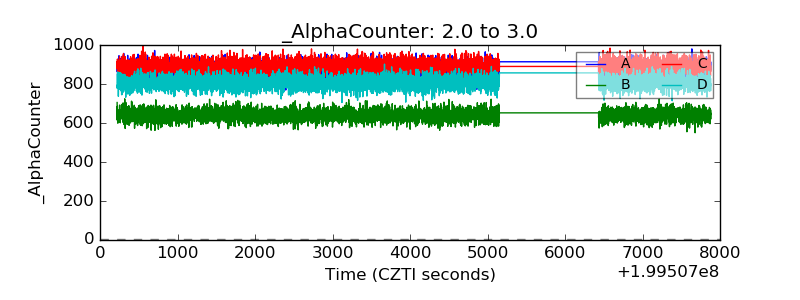 |
| _CPM_Rate | 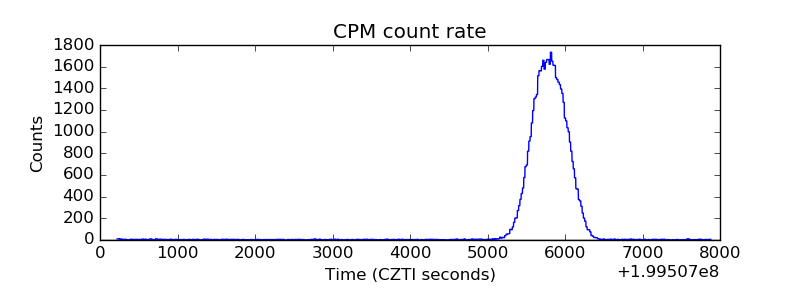 |
| CZT Counter |  |
| +2.5 Volts monitor |  |
| +5 Volts monitor |  |
| _ROLL_ROT | 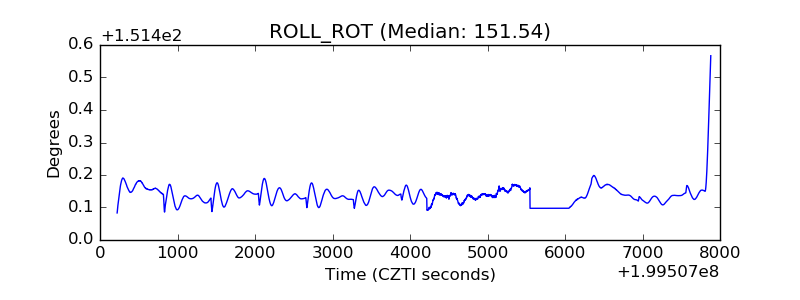 |
| _Roll_DEC | 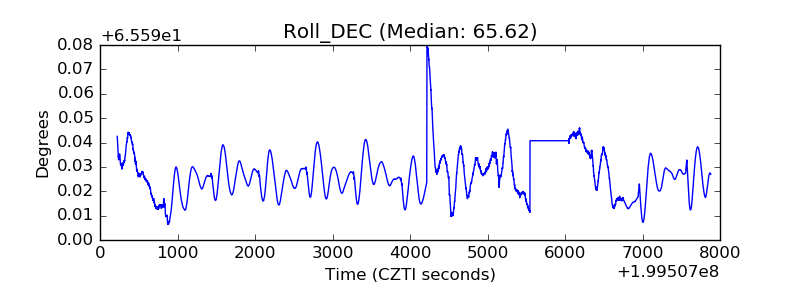 |
| _Roll_RA | 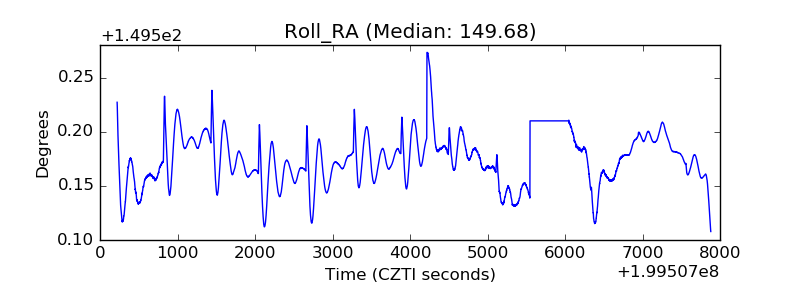 |
| Veto Counter | 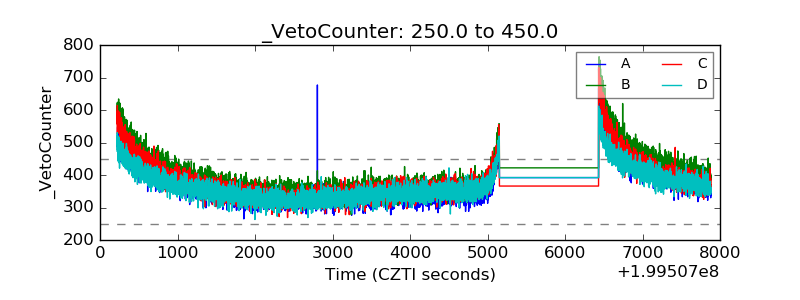 |