| Param | Original file | Final file |
|---|---|---|
| Filename | modeM0/AS1G05_218T02_9000000434_03155cztM0_level2.evt | modeM0/AS1G05_218T02_9000000434_03155cztM0_level2_quad_clean.evt |
| Size (bytes) | 483,125,760 | 75,346,560 |
| Size | 460.7 MB | 71.9 MB |
| Events in quadrant A | 4,539,721 | 436,839 |
| Events in quadrant B | 3,247,062 | 488,441 |
| Events in quadrant C | 3,252,669 | 468,209 |
| Events in quadrant D | 3,168,709 | 452,813 |
| Mode SS | |||
|---|---|---|---|
| Quadrant | BADHDUFLAG | Total packets | Discarded packets |
| A | 0 | 126 | 0 |
| B | 0 | 126 | 0 |
| C | 0 | 126 | 0 |
| D | 0 | 126 | 0 |
| Mode M0 | |||
|---|---|---|---|
| Quadrant | BADHDUFLAG | Total packets | Discarded packets |
| A | 0 | 17699 | 3 |
| B | 0 | 13706 | 2 |
| C | 0 | 13914 | 2 |
| D | 0 | 13797 | 2 |
| Mode M9 | |||
|---|---|---|---|
| Quadrant | BADHDUFLAG | Total packets | Discarded packets |
| A | 0 | 16 | 0 |
| B | 0 | 16 | 0 |
| C | 0 | 16 | 0 |
| D | 0 | 17 | 0 |
| Quadrant | Total seconds | Saturated seconds | Saturation percentage |
|---|---|---|---|
| A | 6235 | 613 | 9.831596% |
| B | 6235 | 104 | 1.668003% |
| C | 6235 | 134 | 2.149158% |
| D | 6235 | 74 | 1.186848% |
Noise dominated data is calculated using 1-second bins in cleaned event files. If a bin has >2000 counts, and if more than 50% of those come from <1% of pixels, then it is considered to be noise-dominated and hence unusable.
| Quadrant | # 1 sec bins | Bins with >0 counts | Bins with >2000 counts | High rate bins dominated by noise | Noise dominated (total time) | Noise dominated (detector-on time) | Marked lightcurve |
|---|---|---|---|---|---|---|---|
| A | 7535 | 6235 | 467 | 467 | 6.20% | 7.49% | 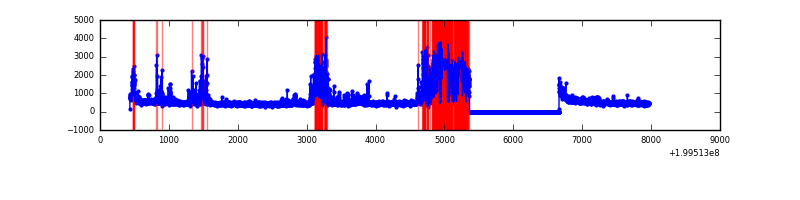 |
| B | 7535 | 6236 | 24 | 24 | 0.32% | 0.38% | 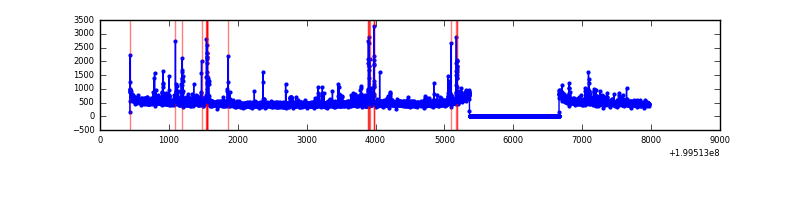 |
| C | 7535 | 6236 | 70 | 70 | 0.93% | 1.12% | 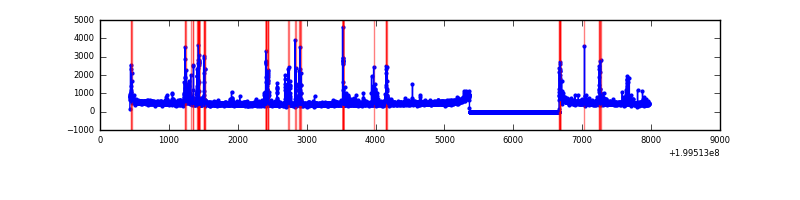 |
| D | 7535 | 6236 | 34 | 34 | 0.45% | 0.55% | 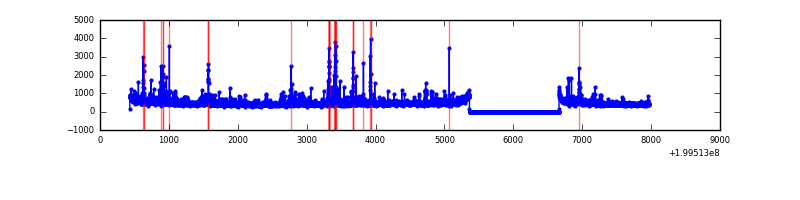 |
Top three noisy pixels from each quadrant. If the there are fewer than three noisy pixels in the level2.evt file, extra rows are filled as -1
| Pixel properties | Quadrant properties | ||||||
|---|---|---|---|---|---|---|---|
| Quadrant | DetID | PixID | Counts | Sigma | Mean | Median | Sigma |
| A | 14 | 249 | 1592503 | 11249.28 | 705 | 691 | 141.5 |
| A | 14 | 238 | 108853 | 764.38 | 705 | 691 | 141.5 |
| A | 3 | 1 | 92430 | 648.32 | 705 | 691 | 141.5 |
| B | 4 | 81 | 108957 | 749.32 | 763 | 745 | 144.4 |
| B | 2 | 249 | 91996 | 631.87 | 763 | 745 | 144.4 |
| B | 15 | 85 | 54085 | 369.36 | 763 | 745 | 144.4 |
| C | 14 | 223 | 386697 | 2347.17 | 714 | 715 | 164.4 |
| C | 6 | 80 | 30850 | 183.25 | 714 | 715 | 164.4 |
| C | 14 | 234 | 21464 | 126.18 | 714 | 715 | 164.4 |
| D | 13 | 223 | 77257 | 449.42 | 715 | 693 | 170.4 |
| D | 13 | 120 | 58933 | 341.86 | 715 | 693 | 170.4 |
| D | 12 | 233 | 54754 | 317.33 | 715 | 693 | 170.4 |
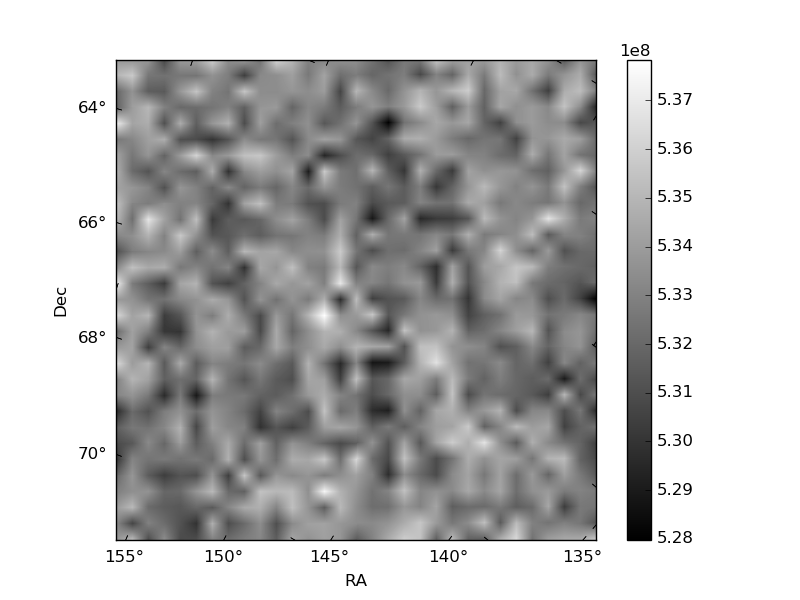
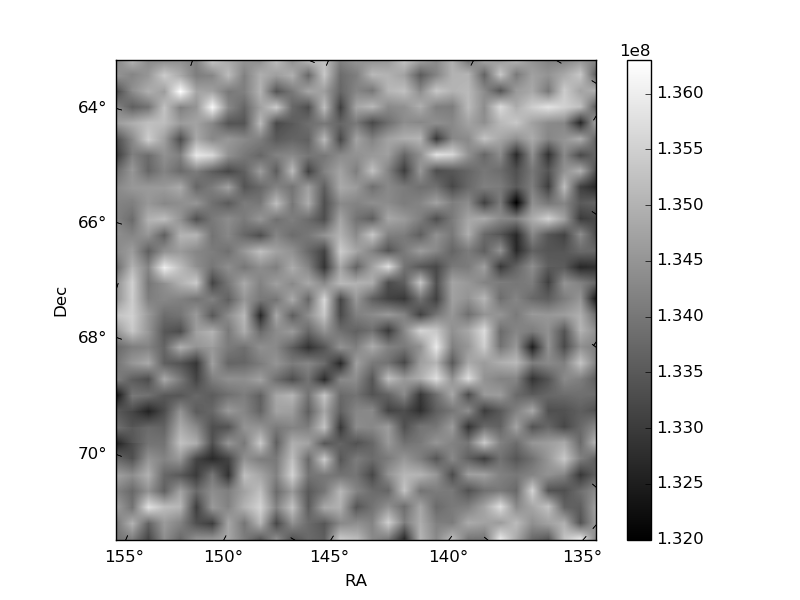
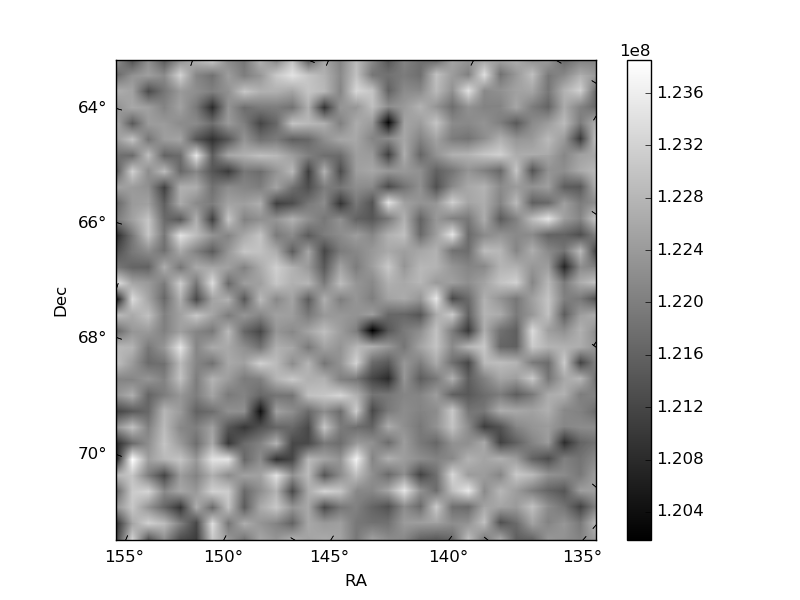
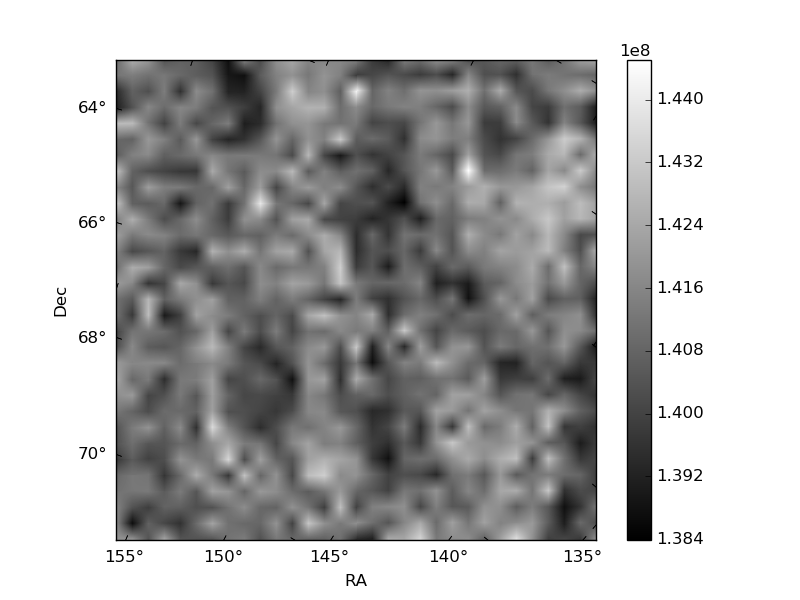
Histogram calculated using DETX and DETY for each event in the final _common_clean file
| Quadrant A | 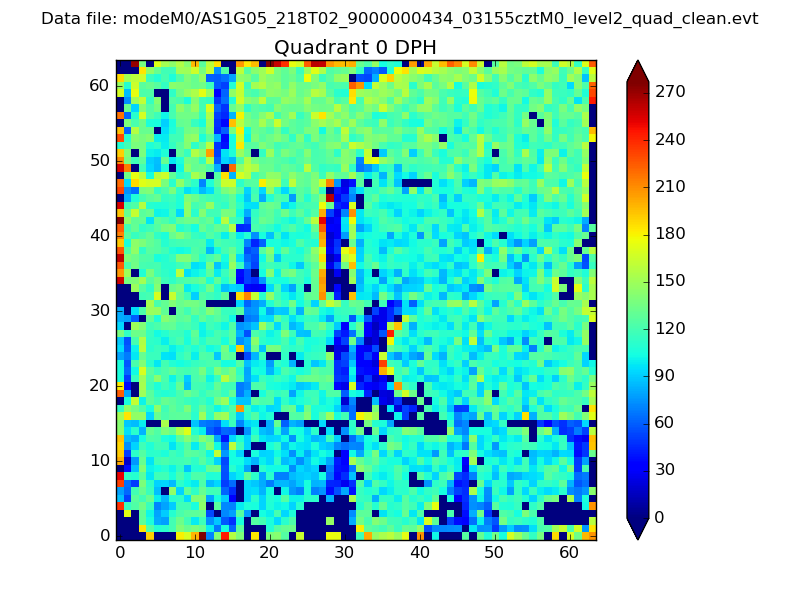 |
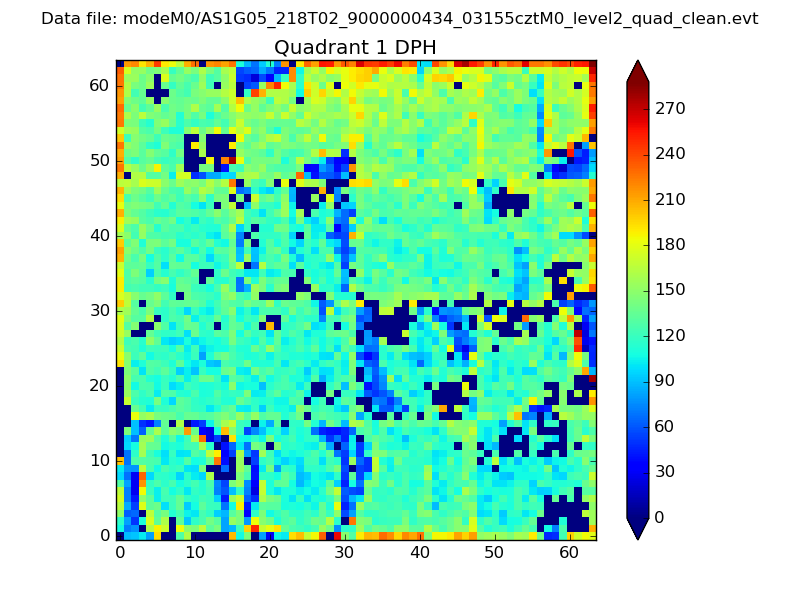 |
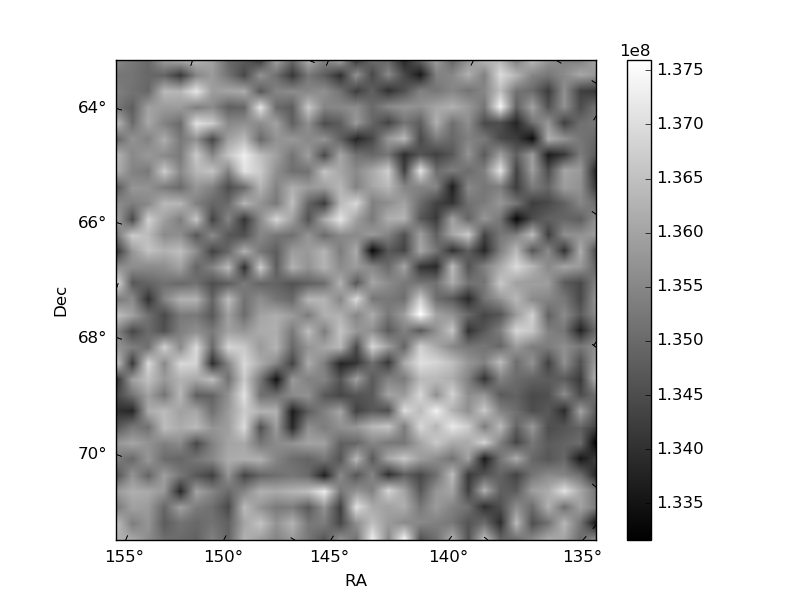
Quadrant B |
|---|---|---|---|
| Quadrant D | 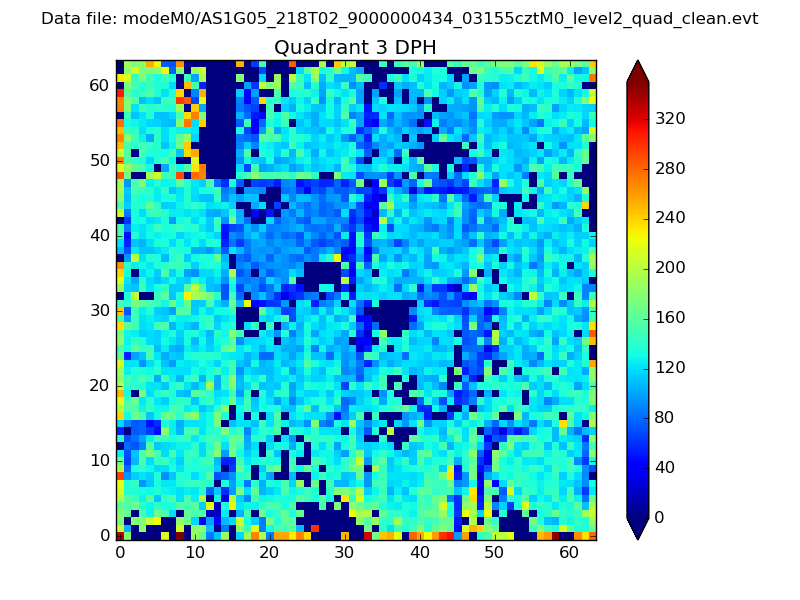 |
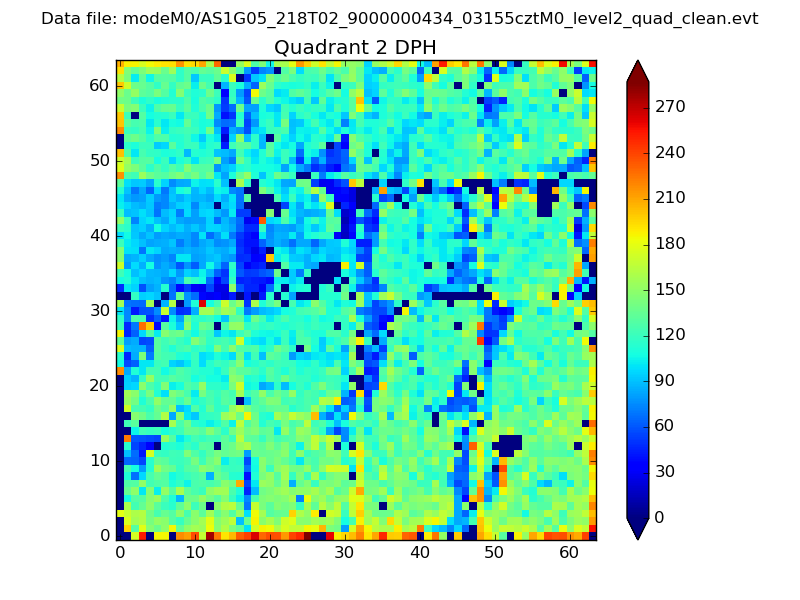 |
Quadrant C |
| Plot type | Count rate plots | Images |
|---|---|---|
| Comparison with Poisson distribution Blue bars denote a histogram of data divided into 1 sec bins. Red curve is a Poisson curve with rate = median count rate of data. |
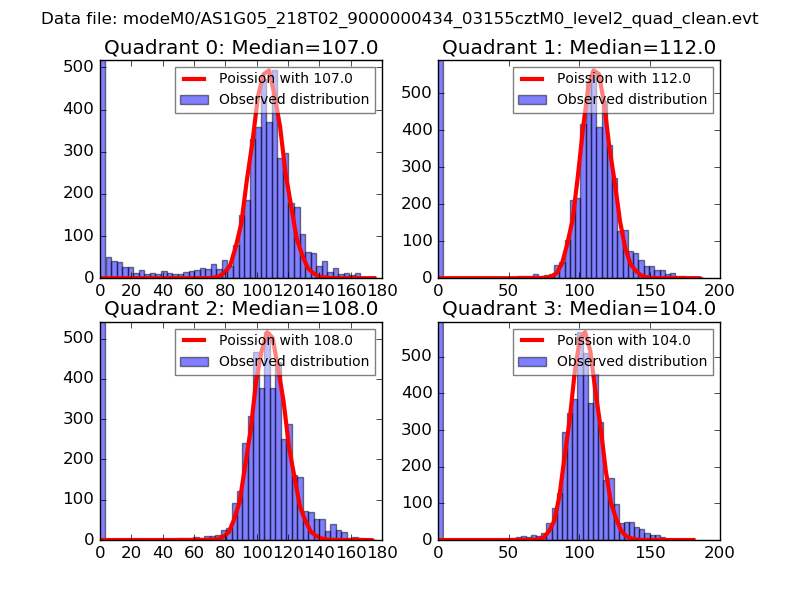 |
 |
| Quadrant-wise count rates Data is divided into 100 sec bins |
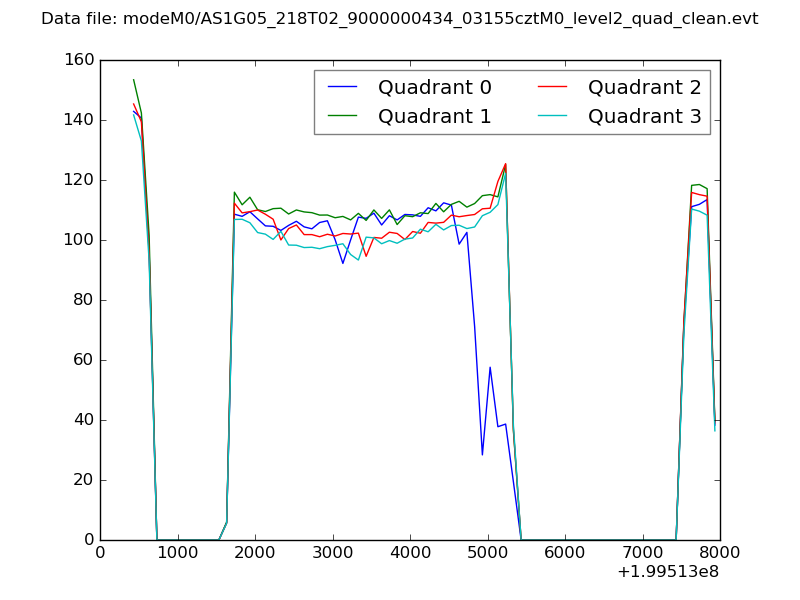 |
|
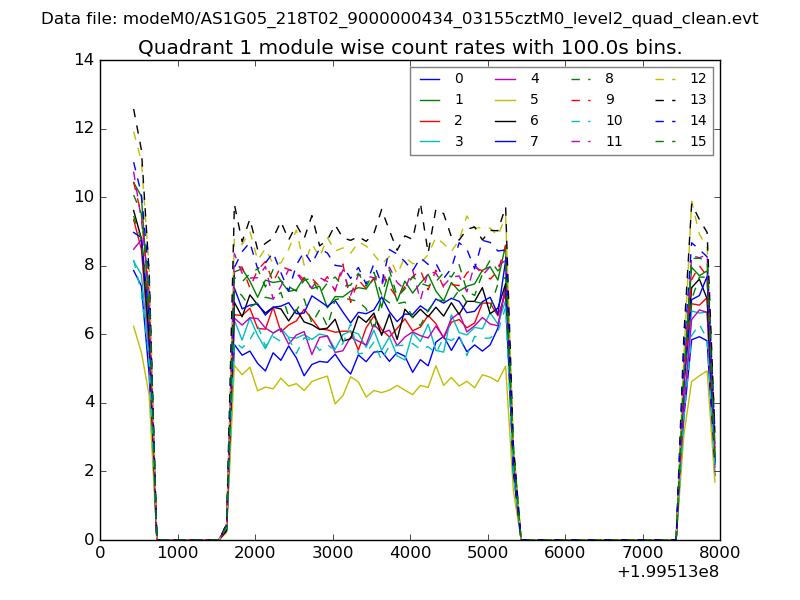
| Module-wise count rates for Quadrant A Data is divided into 100 sec bins |
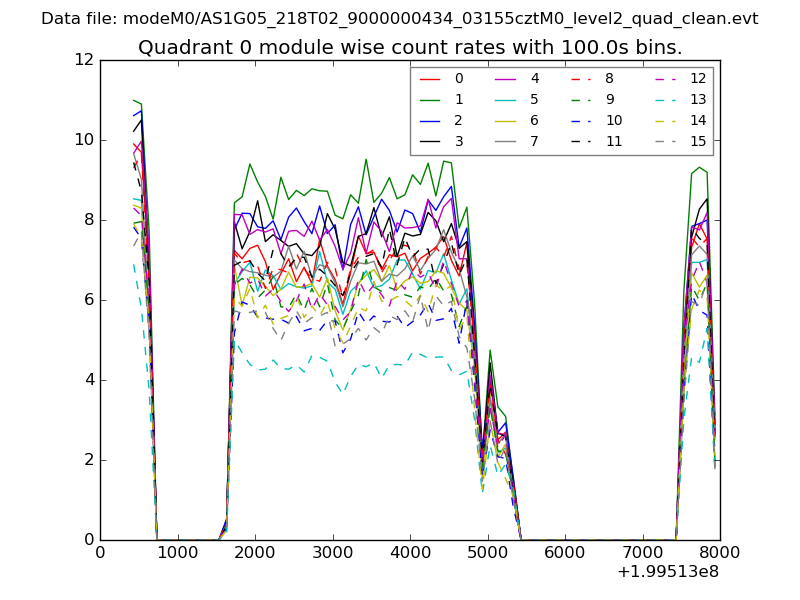 |
 |
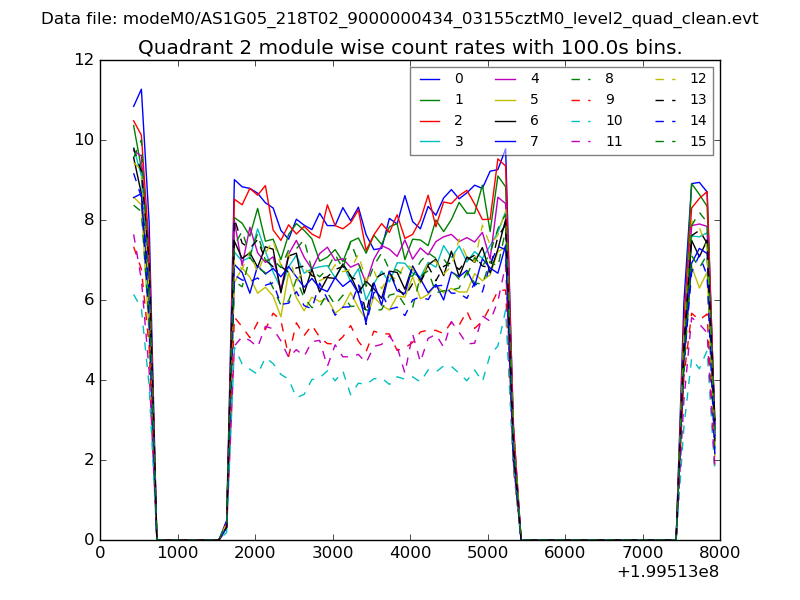
| Module-wise count rates for Quadrant B Data is divided into 100 sec bins |
 |
 |
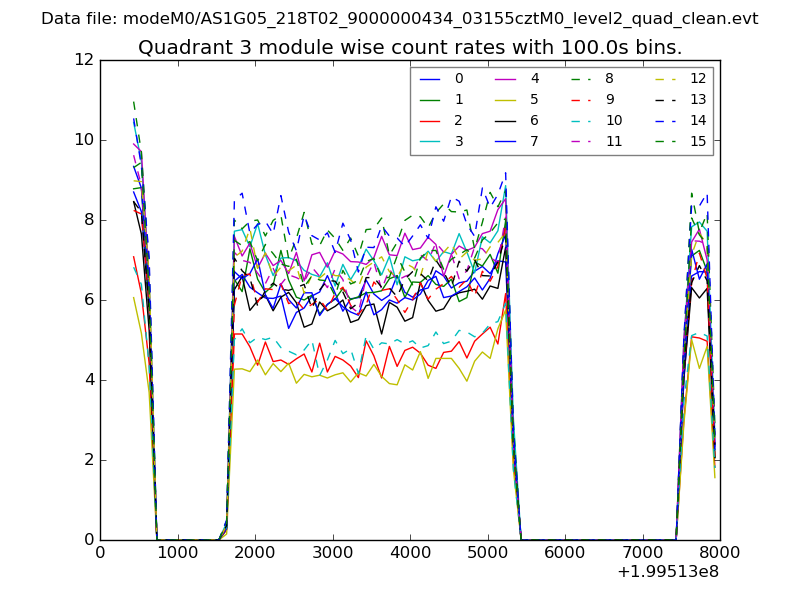
| Module-wise count rates for Quadrant C Data is divided into 100 sec bins |
 |
 |
| Module-wise count rates for Quadrant D Data is divided into 100 sec bins |
 |
 |
| Parameter | Plot |
|---|---|
| CZT HV Monitor | 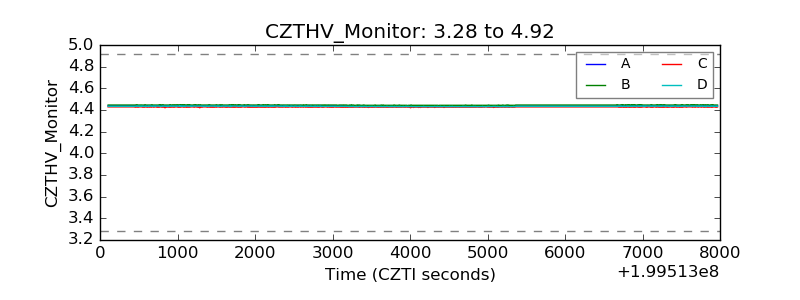 |
| D_VDD | 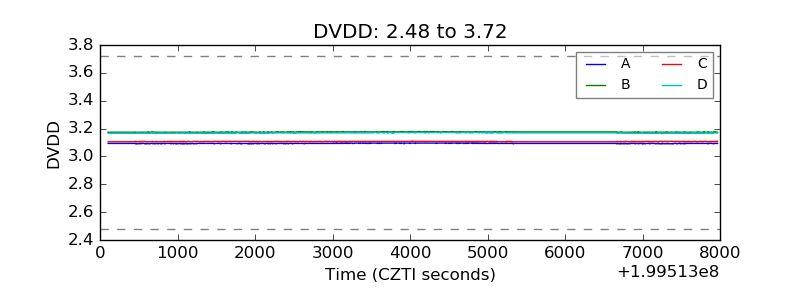 |
| Temperature 1 | 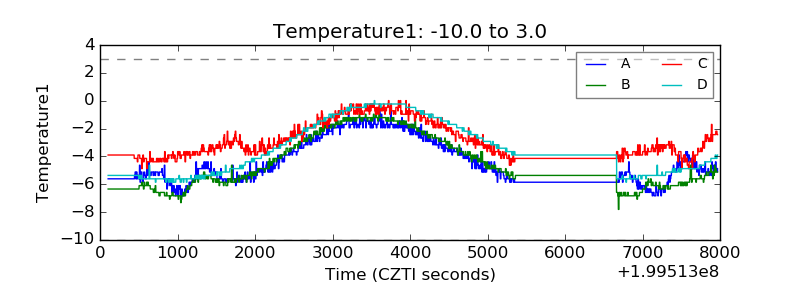 |
| Veto HV Monitor | 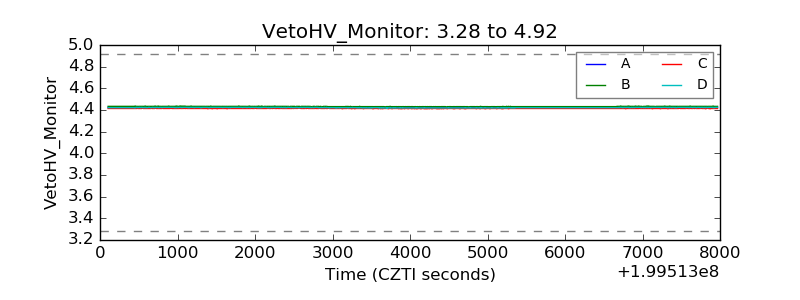 |
| Veto LLD | 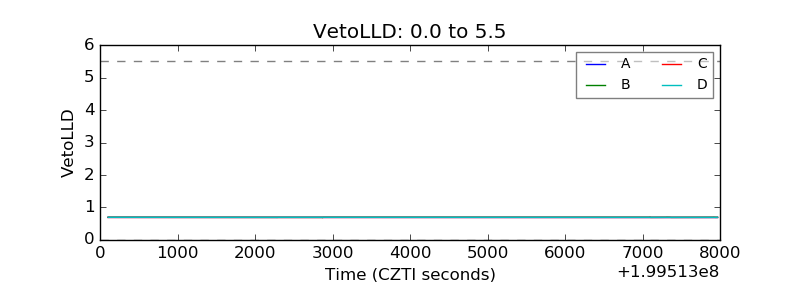 |
| Alpha Counter | 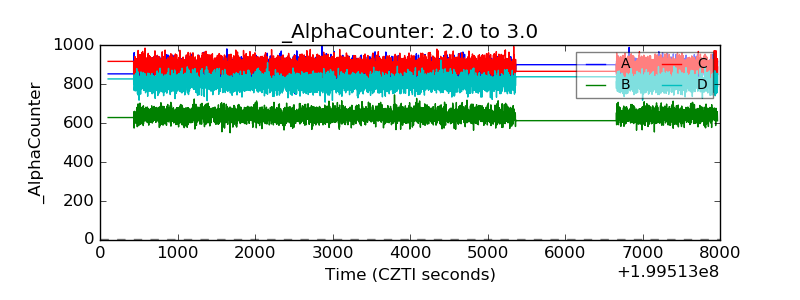 |
| _CPM_Rate | 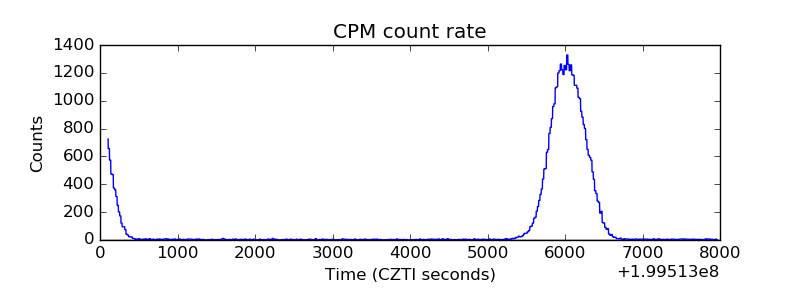 |
| CZT Counter | 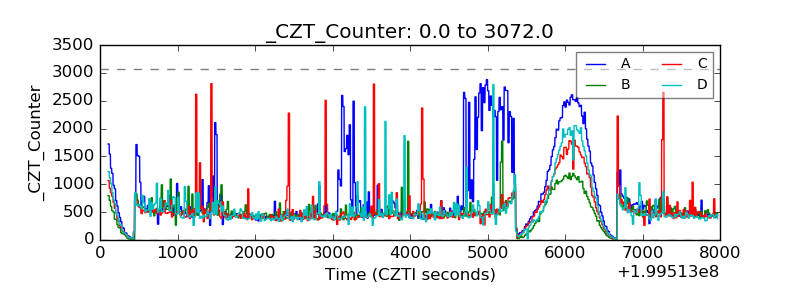 |
| +2.5 Volts monitor |  |
| +5 Volts monitor | 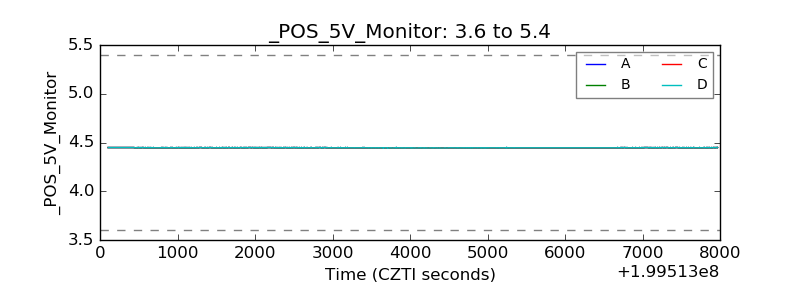 |
| _ROLL_ROT | 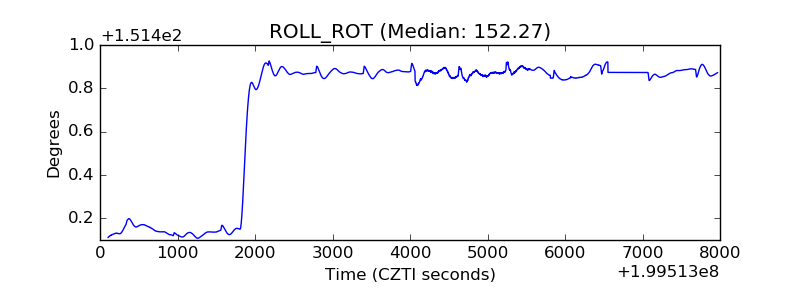 |
| _Roll_DEC | 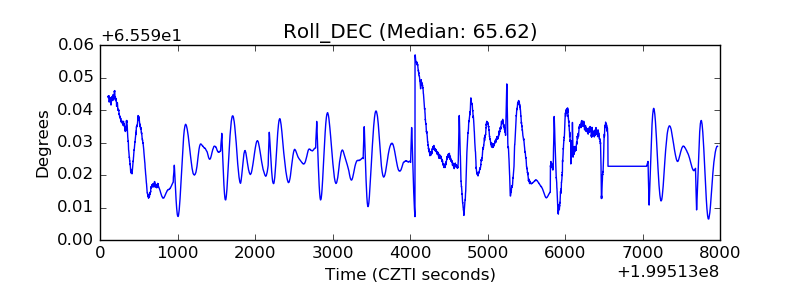 |
| _Roll_RA | 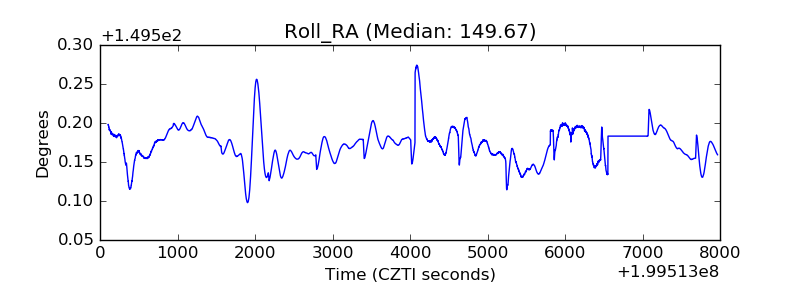 |
| Veto Counter | 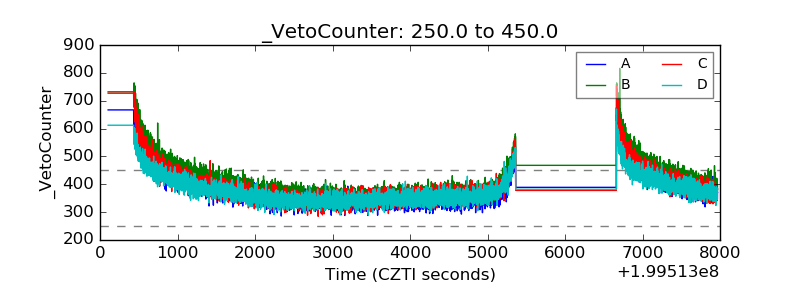 |