| Param | Original file | Final file |
|---|---|---|
| Filename | modeM0/AS1G05_218T02_9000000434_03156cztM0_level2.evt | modeM0/AS1G05_218T02_9000000434_03156cztM0_level2_quad_clean.evt |
| Size (bytes) | 425,854,080 | 84,314,880 |
| Size | 406.1 MB | 80.4 MB |
| Events in quadrant A | 2,900,108 | 542,292 |
| Events in quadrant B | 3,187,131 | 551,728 |
| Events in quadrant C | 3,158,646 | 527,572 |
| Events in quadrant D | 3,245,669 | 515,115 |
| Mode SS | |||
|---|---|---|---|
| Quadrant | BADHDUFLAG | Total packets | Discarded packets |
| A | 0 | 120 | 0 |
| B | 0 | 120 | 0 |
| C | 0 | 120 | 0 |
| D | 0 | 120 | 0 |
| Mode M0 | |||
|---|---|---|---|
| Quadrant | BADHDUFLAG | Total packets | Discarded packets |
| A | 0 | 12563 | 2 |
| B | 0 | 13382 | 1 |
| C | 0 | 13508 | 1 |
| D | 0 | 13878 | 1 |
| Mode M9 | |||
|---|---|---|---|
| Quadrant | BADHDUFLAG | Total packets | Discarded packets |
| A | 0 | 13 | 0 |
| B | 0 | 13 | 0 |
| C | 0 | 13 | 0 |
| D | 0 | 13 | 0 |
| Quadrant | Total seconds | Saturated seconds | Saturation percentage |
|---|---|---|---|
| A | 5966 | 94 | 1.575595% |
| B | 5966 | 119 | 1.994636% |
| C | 5966 | 167 | 2.799195% |
| D | 5966 | 233 | 3.905464% |
Noise dominated data is calculated using 1-second bins in cleaned event files. If a bin has >2000 counts, and if more than 50% of those come from <1% of pixels, then it is considered to be noise-dominated and hence unusable.
| Quadrant | # 1 sec bins | Bins with >0 counts | Bins with >2000 counts | High rate bins dominated by noise | Noise dominated (total time) | Noise dominated (detector-on time) | Marked lightcurve |
|---|---|---|---|---|---|---|---|
| A | 7221 | 5966 | 1 | 1 | 0.01% | 0.02% | 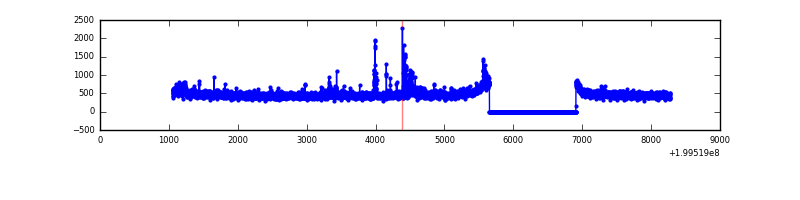 |
| B | 7221 | 5967 | 15 | 15 | 0.21% | 0.25% | 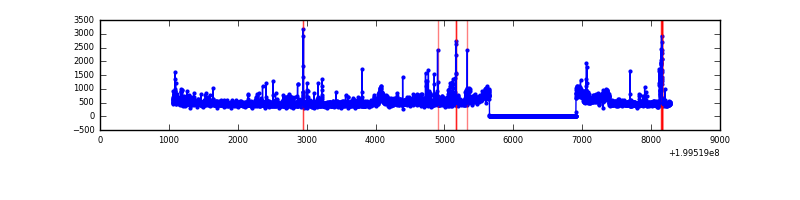 |
| C | 7221 | 5967 | 98 | 98 | 1.36% | 1.64% | 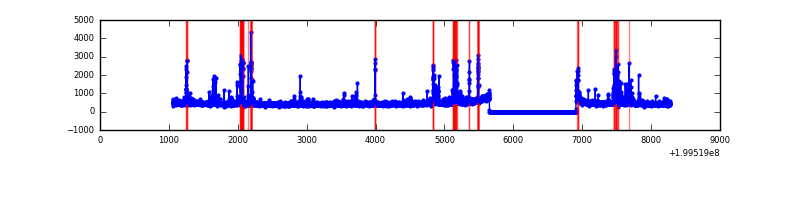 |
| D | 7221 | 5967 | 134 | 134 | 1.86% | 2.25% | 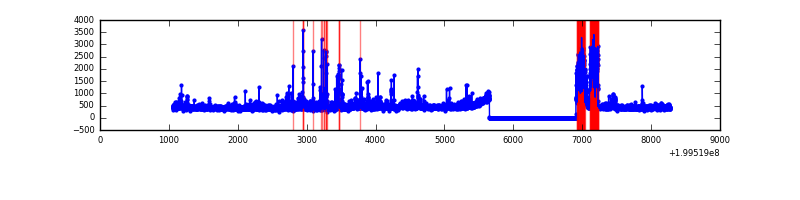 |
Top three noisy pixels from each quadrant. If the there are fewer than three noisy pixels in the level2.evt file, extra rows are filled as -1
| Pixel properties | Quadrant properties | ||||||
|---|---|---|---|---|---|---|---|
| Quadrant | DetID | PixID | Counts | Sigma | Mean | Median | Sigma |
| A | 12 | 247 | 80306 | 557.48 | 706 | 691 | 142.8 |
| A | 3 | 1 | 25885 | 176.41 | 706 | 691 | 142.8 |
| A | 14 | 249 | 25006 | 170.26 | 706 | 691 | 142.8 |
| B | 4 | 81 | 127662 | 936.86 | 714 | 699 | 135.5 |
| B | 15 | 85 | 102591 | 751.86 | 714 | 699 | 135.5 |
| B | 5 | 175 | 90152 | 660.07 | 714 | 699 | 135.5 |
| C | 14 | 223 | 356563 | 2292.13 | 670 | 672 | 155.3 |
| C | 12 | 4 | 44646 | 283.22 | 670 | 672 | 155.3 |
| C | 14 | 234 | 41091 | 260.32 | 670 | 672 | 155.3 |
| D | 2 | 136 | 432970 | 2681.39 | 671 | 649 | 161.2 |
| D | 13 | 223 | 54188 | 332.07 | 671 | 649 | 161.2 |
| D | 13 | 114 | 45050 | 275.39 | 671 | 649 | 161.2 |
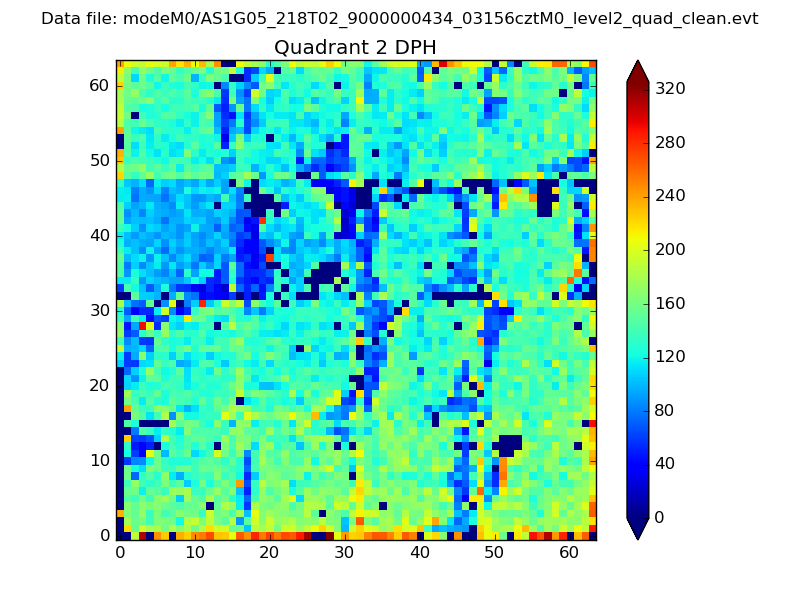
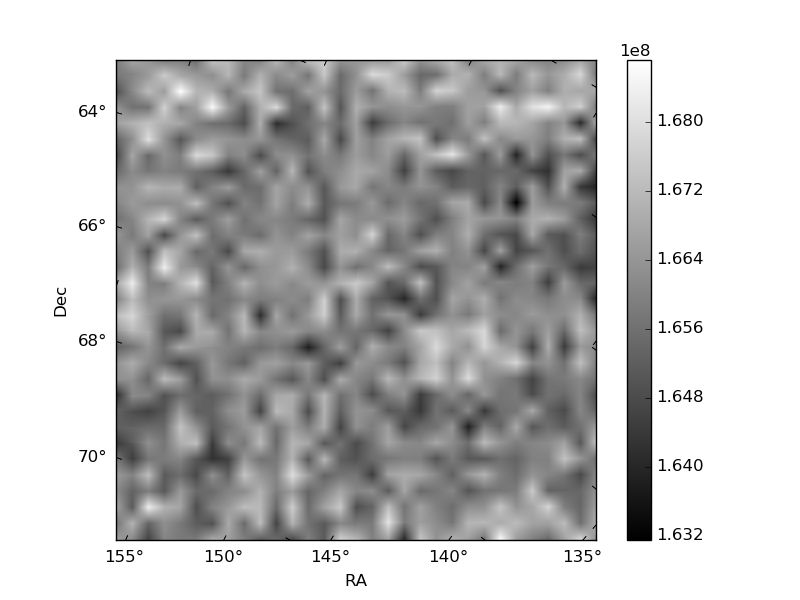
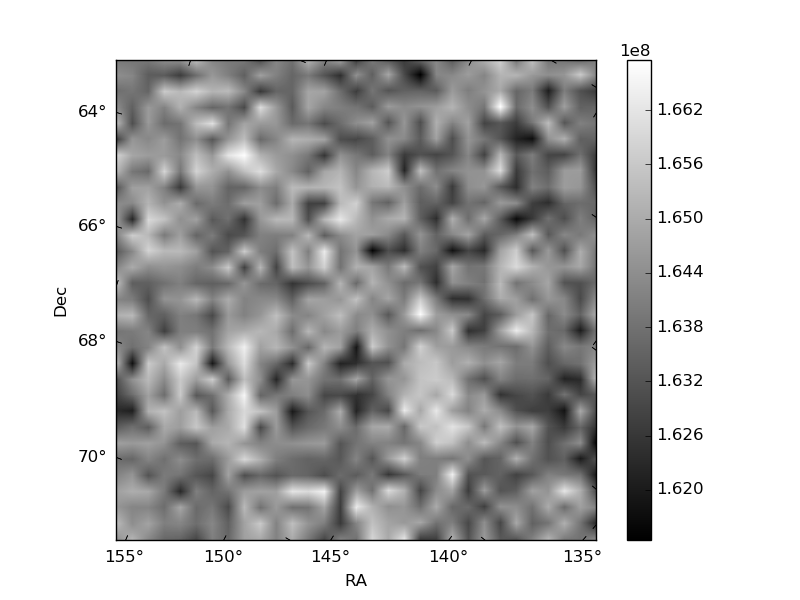
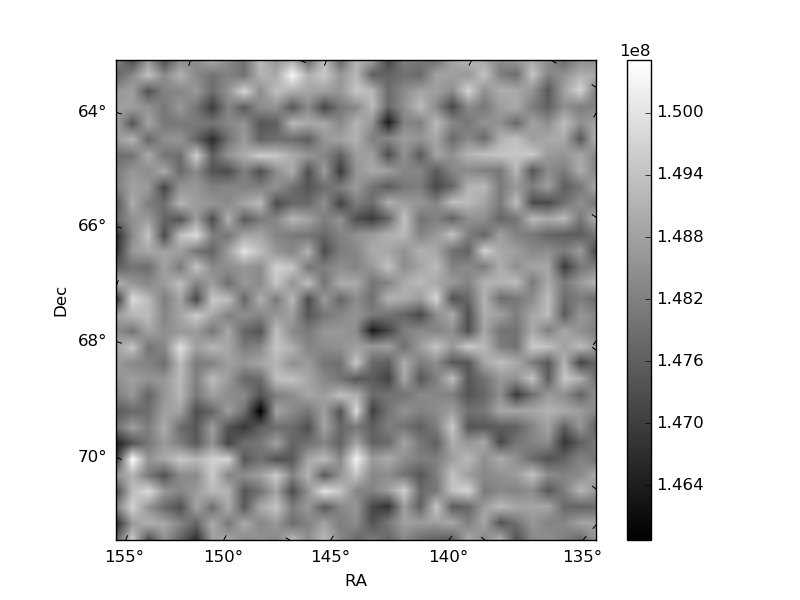
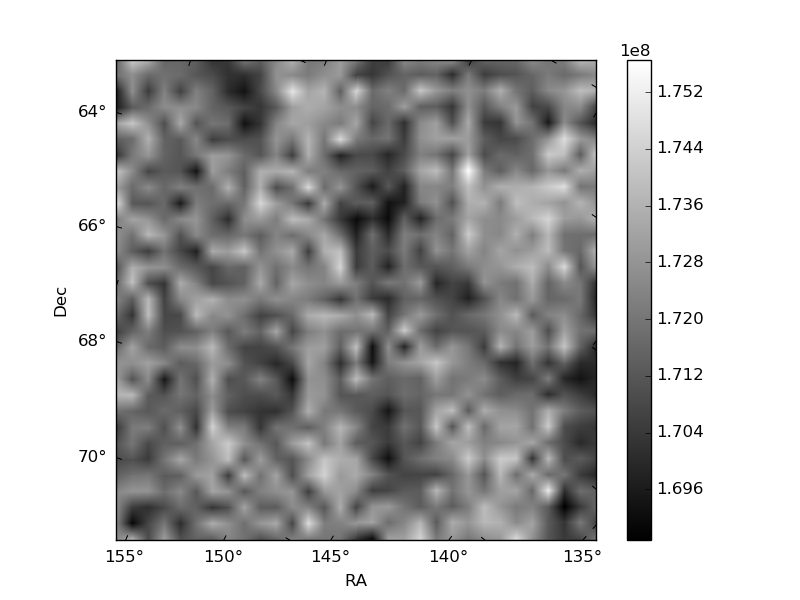
Histogram calculated using DETX and DETY for each event in the final _common_clean file
| Quadrant A | 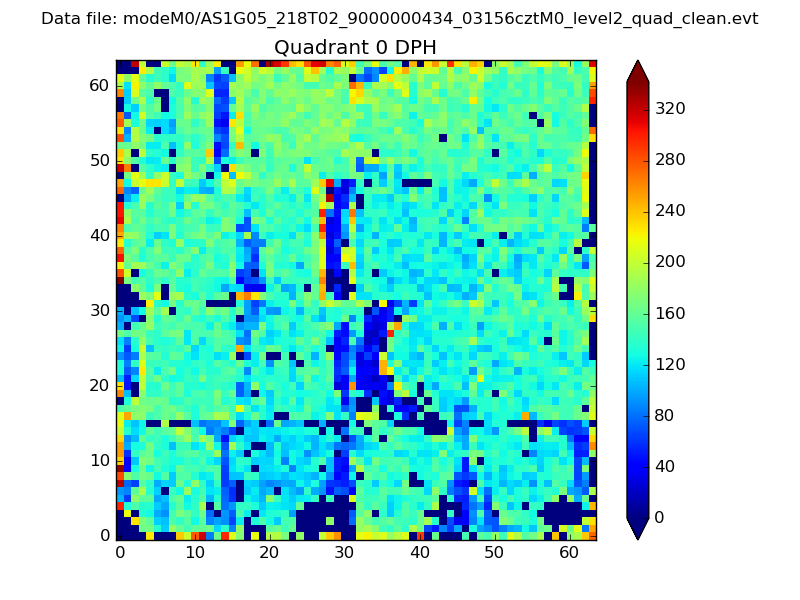 |
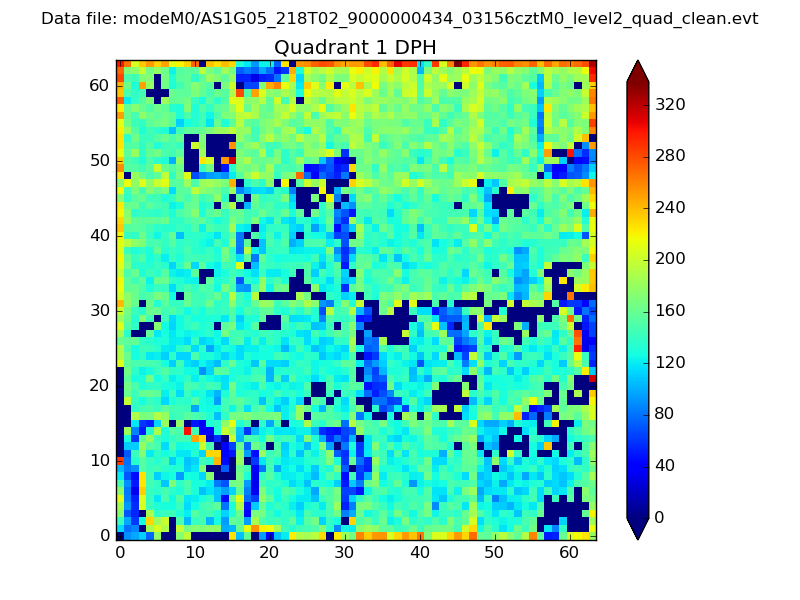 |
Quadrant B |
|---|---|---|---|
| Quadrant D | 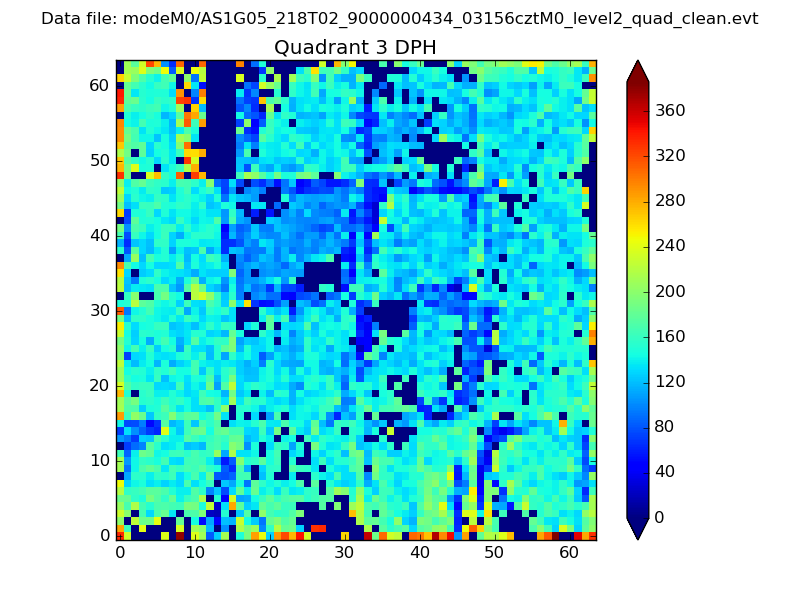 |
 |
Quadrant C |
| Plot type | Count rate plots | Images |
|---|---|---|
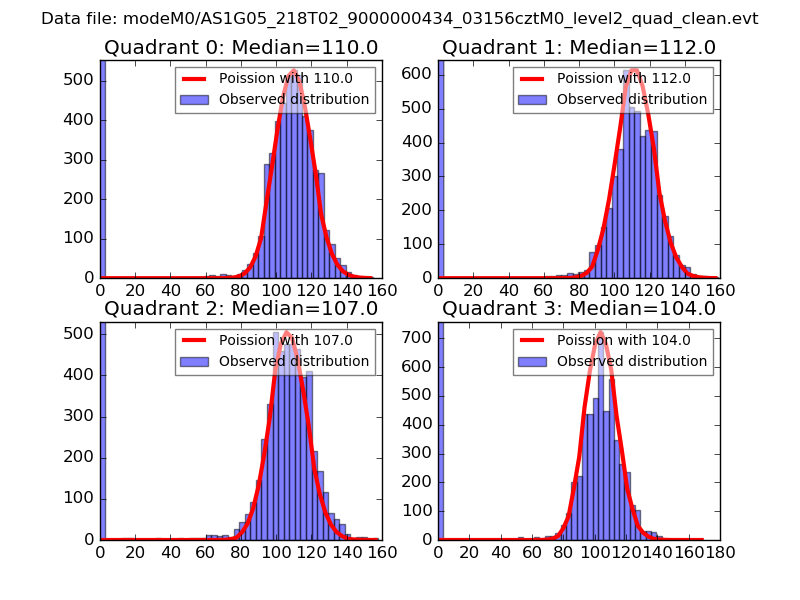
| Comparison with Poisson distribution Blue bars denote a histogram of data divided into 1 sec bins. Red curve is a Poisson curve with rate = median count rate of data. |
 |
 |
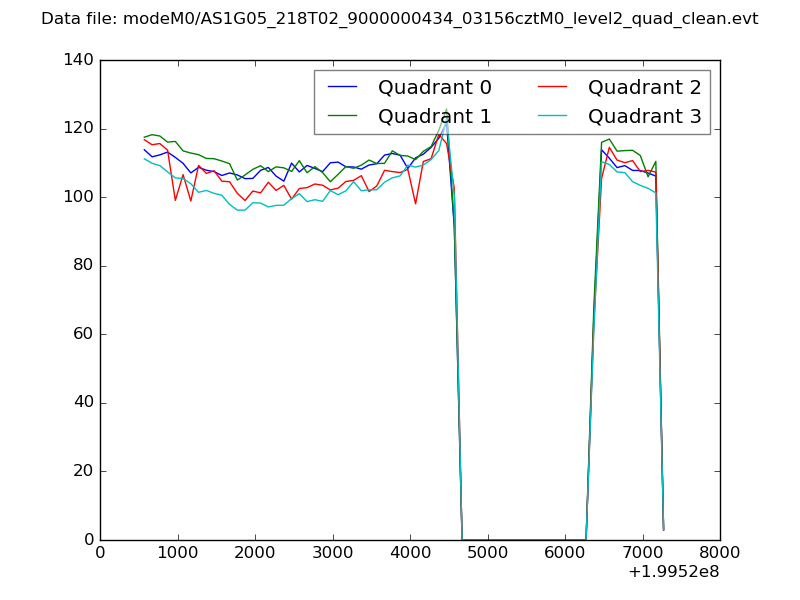
| Quadrant-wise count rates Data is divided into 100 sec bins |
 |
|
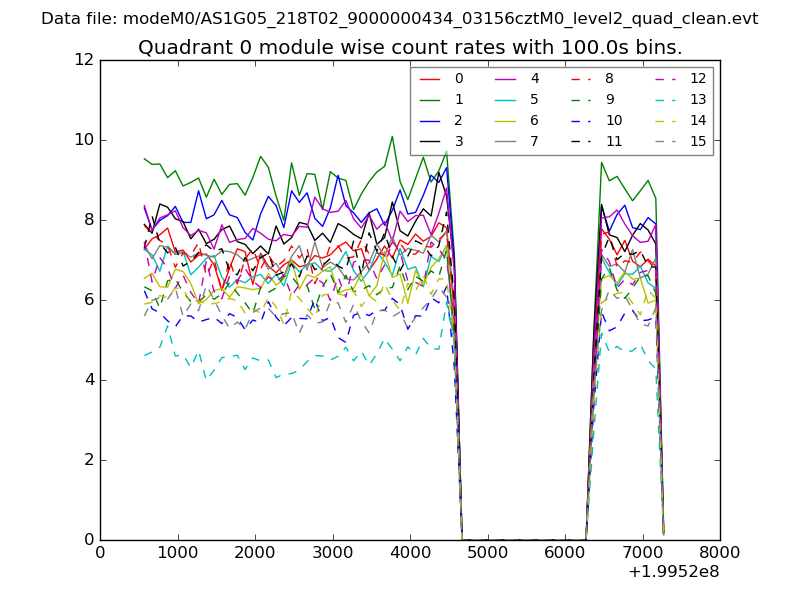
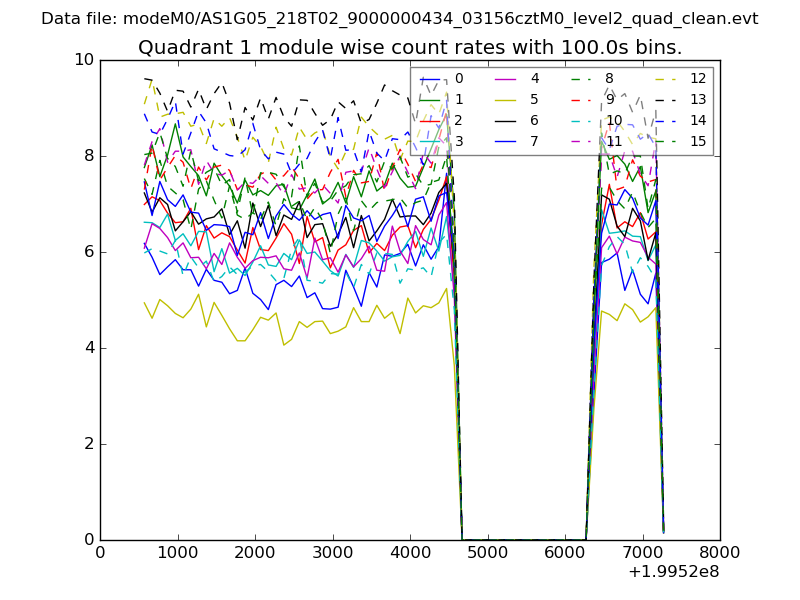
| Module-wise count rates for Quadrant A Data is divided into 100 sec bins |
 |
 |
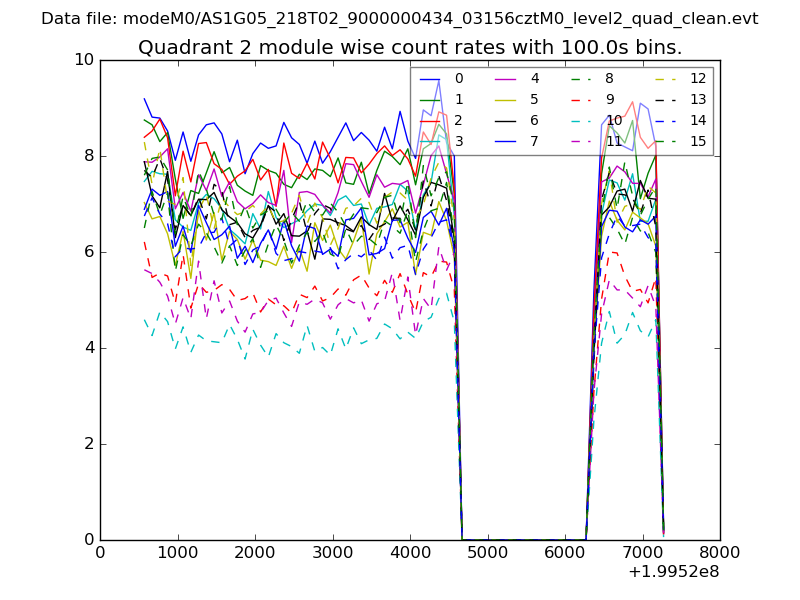
| Module-wise count rates for Quadrant B Data is divided into 100 sec bins |
 |
 |
| Module-wise count rates for Quadrant C Data is divided into 100 sec bins |
 |
 |
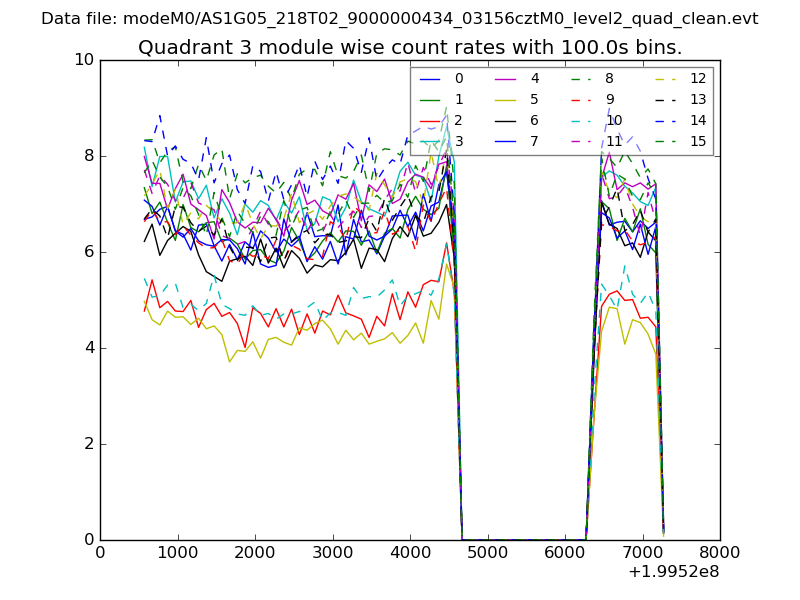
| Module-wise count rates for Quadrant D Data is divided into 100 sec bins |
 |
 |
| Parameter | Plot |
|---|---|
| CZT HV Monitor |  |
| D_VDD | 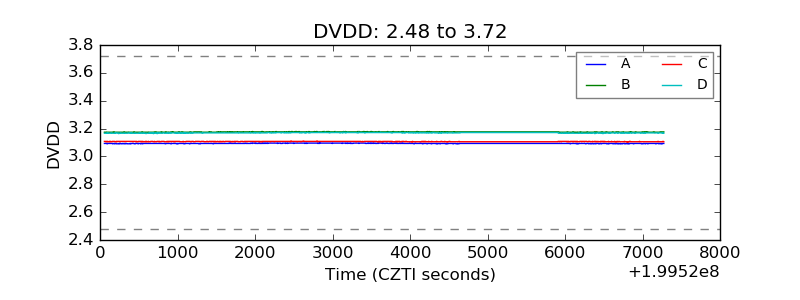 |
| Temperature 1 | 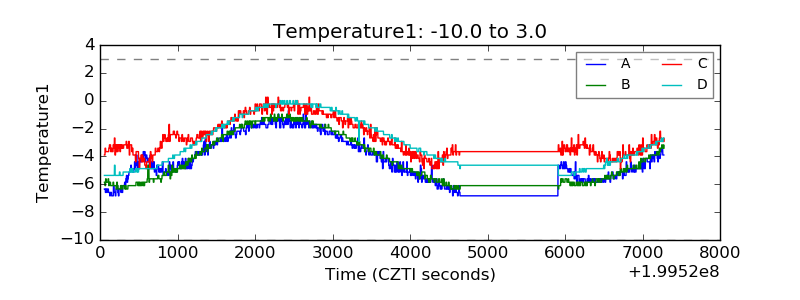 |
| Veto HV Monitor | 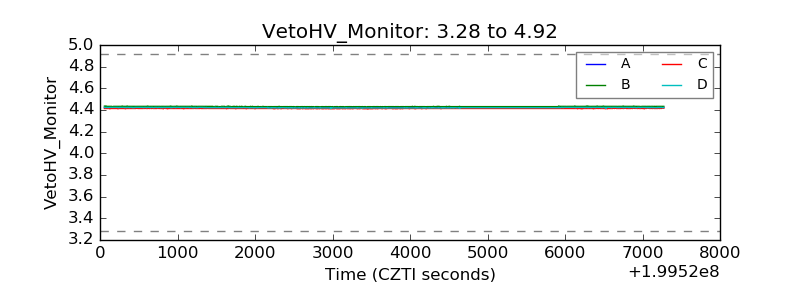 |
| Veto LLD | 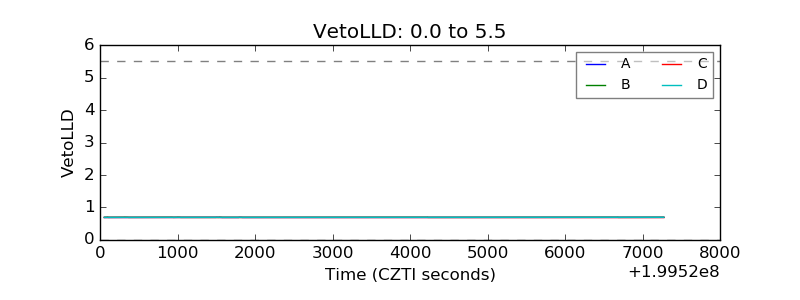 |
| Alpha Counter | 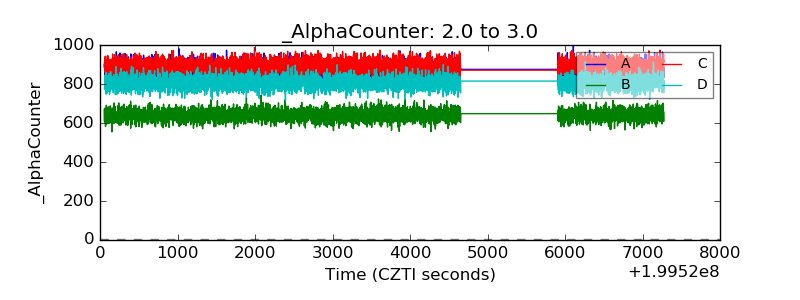 |
| _CPM_Rate | 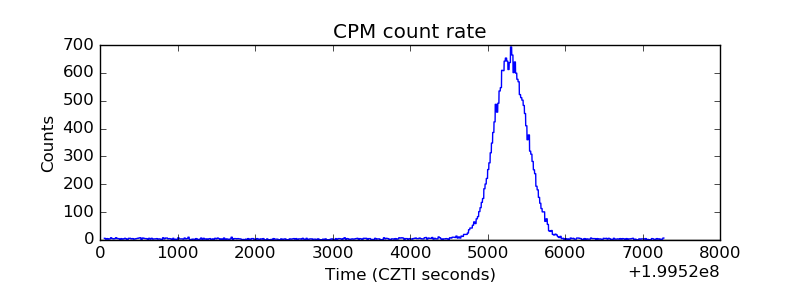 |
| CZT Counter | 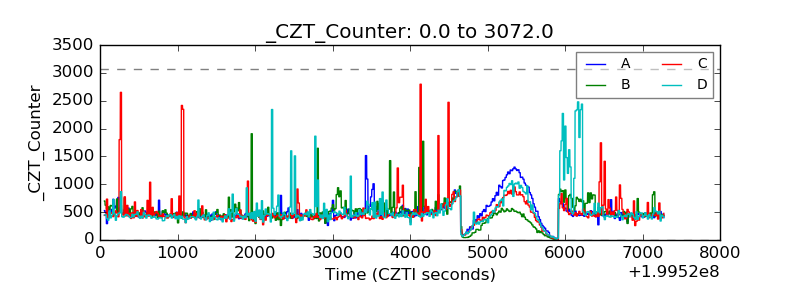 |
| +2.5 Volts monitor |  |
| +5 Volts monitor |  |
| _ROLL_ROT | 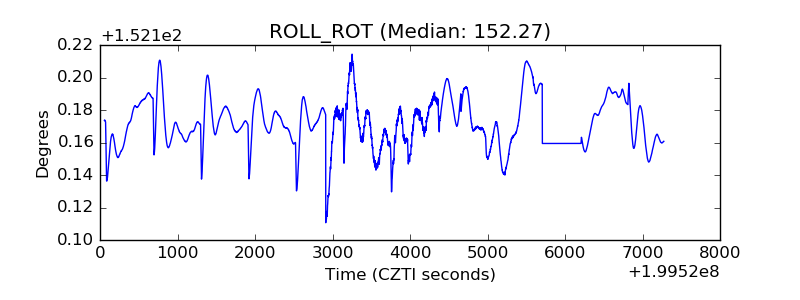 |
| _Roll_DEC | 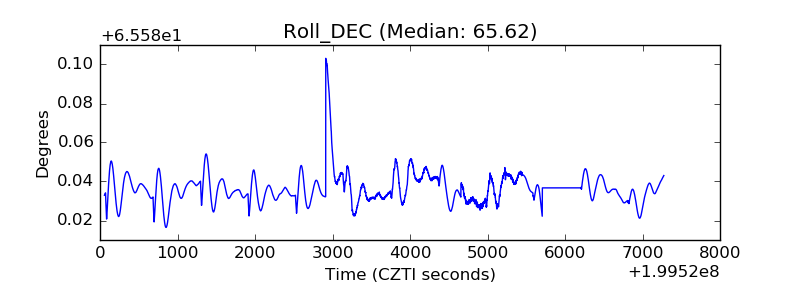 |
| _Roll_RA | 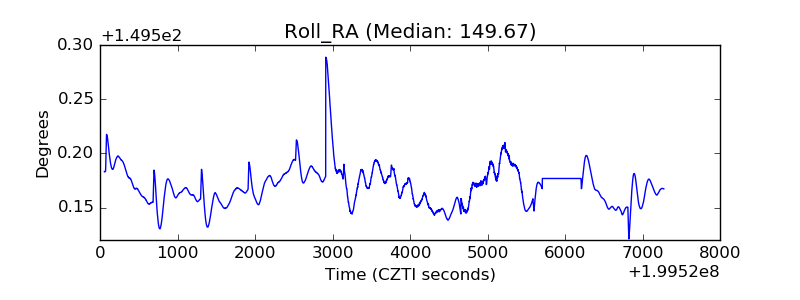 |
| Veto Counter | 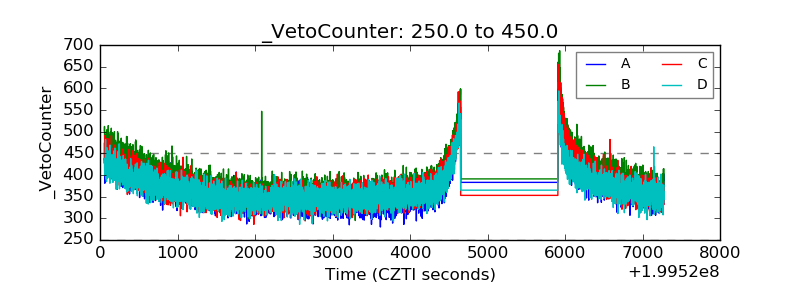 |