| Param | Original file | Final file |
|---|---|---|
| Filename | modeM0/AS1G05_218T02_9000000434_03158cztM0_level2.evt | modeM0/AS1G05_218T02_9000000434_03158cztM0_level2_quad_clean.evt |
| Size (bytes) | 536,227,200 | 96,370,560 |
| Size | 511.4 MB | 91.9 MB |
| Events in quadrant A | 3,110,983 | 630,168 |
| Events in quadrant B | 3,126,710 | 639,041 |
| Events in quadrant C | 6,084,144 | 580,950 |
| Events in quadrant D | 3,459,402 | 597,531 |
| Mode SS | |||
|---|---|---|---|
| Quadrant | BADHDUFLAG | Total packets | Discarded packets |
| A | 0 | 138 | 0 |
| B | 0 | 138 | 0 |
| C | 0 | 138 | 0 |
| D | 0 | 138 | 0 |
| Mode M0 | |||
|---|---|---|---|
| Quadrant | BADHDUFLAG | Total packets | Discarded packets |
| A | 0 | 14039 | 2 |
| B | 0 | 13994 | 1 |
| C | 0 | 22798 | 1 |
| D | 0 | 15231 | 1 |
| Mode M9 | |||
|---|---|---|---|
| Quadrant | BADHDUFLAG | Total packets | Discarded packets |
| A | 0 | 6 | 0 |
| B | 0 | 6 | 0 |
| C | 0 | 6 | 0 |
| D | 0 | 6 | 0 |
| Quadrant | Total seconds | Saturated seconds | Saturation percentage |
|---|---|---|---|
| A | 6748 | 159 | 2.356254% |
| B | 6748 | 130 | 1.926497% |
| C | 6748 | 881 | 13.055720% |
| D | 6748 | 195 | 2.889745% |
Noise dominated data is calculated using 1-second bins in cleaned event files. If a bin has >2000 counts, and if more than 50% of those come from <1% of pixels, then it is considered to be noise-dominated and hence unusable.
| Quadrant | # 1 sec bins | Bins with >0 counts | Bins with >2000 counts | High rate bins dominated by noise | Noise dominated (total time) | Noise dominated (detector-on time) | Marked lightcurve |
|---|---|---|---|---|---|---|---|
| A | 7348 | 6748 | 1 | 1 | 0.01% | 0.01% | 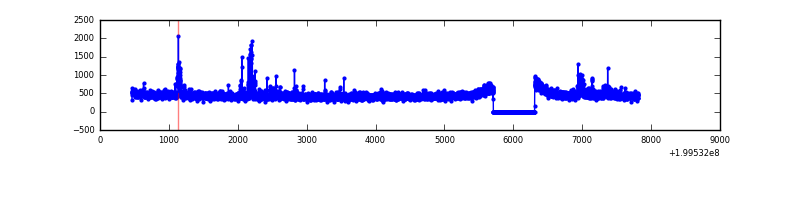 |
| B | 7348 | 6748 | 3 | 3 | 0.04% | 0.04% | 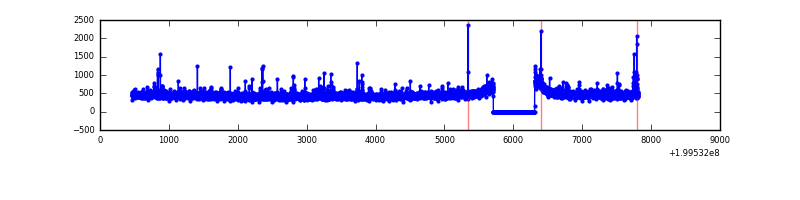 |
| C | 7348 | 6749 | 624 | 624 | 8.49% | 9.25% | 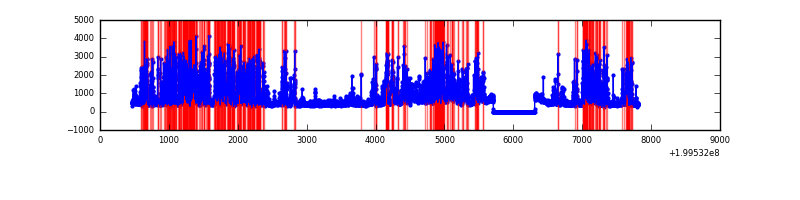 |
| D | 7348 | 6748 | 65 | 65 | 0.88% | 0.96% | 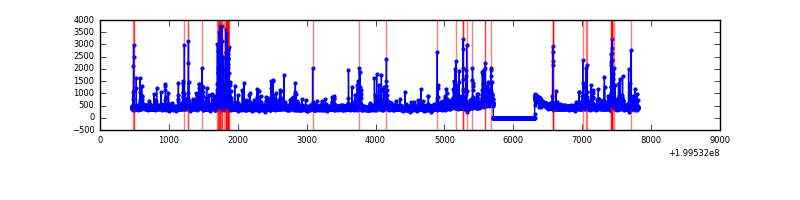 |
Top three noisy pixels from each quadrant. If the there are fewer than three noisy pixels in the level2.evt file, extra rows are filled as -1
| Pixel properties | Quadrant properties | ||||||
|---|---|---|---|---|---|---|---|
| Quadrant | DetID | PixID | Counts | Sigma | Mean | Median | Sigma |
| A | 14 | 238 | 46061 | 290.29 | 762 | 744 | 156.1 |
| A | 0 | 199 | 38172 | 239.75 | 762 | 744 | 156.1 |
| A | 12 | 247 | 28275 | 176.35 | 762 | 744 | 156.1 |
| B | 4 | 81 | 29874 | 197.46 | 772 | 753 | 147.5 |
| B | 2 | 249 | 22496 | 147.43 | 772 | 753 | 147.5 |
| B | 0 | 183 | 18964 | 123.49 | 772 | 753 | 147.5 |
| C | 14 | 223 | 3187419 | 19544.67 | 703 | 703 | 163.0 |
| C | 6 | 80 | 38141 | 229.61 | 703 | 703 | 163.0 |
| C | 1 | 16 | 35837 | 215.48 | 703 | 703 | 163.0 |
| D | 2 | 136 | 363534 | 2048.01 | 732 | 709 | 177.2 |
| D | 5 | 233 | 62212 | 347.16 | 732 | 709 | 177.2 |
| D | 13 | 120 | 59327 | 330.88 | 732 | 709 | 177.2 |
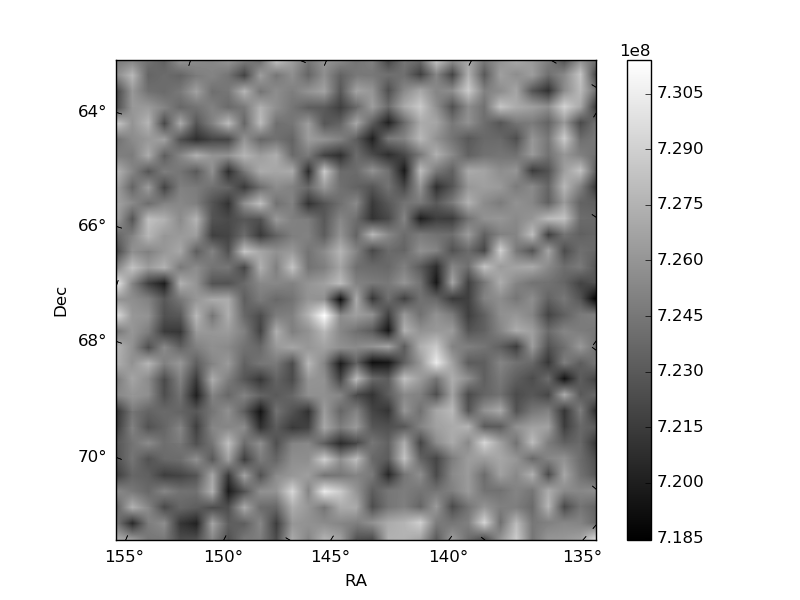
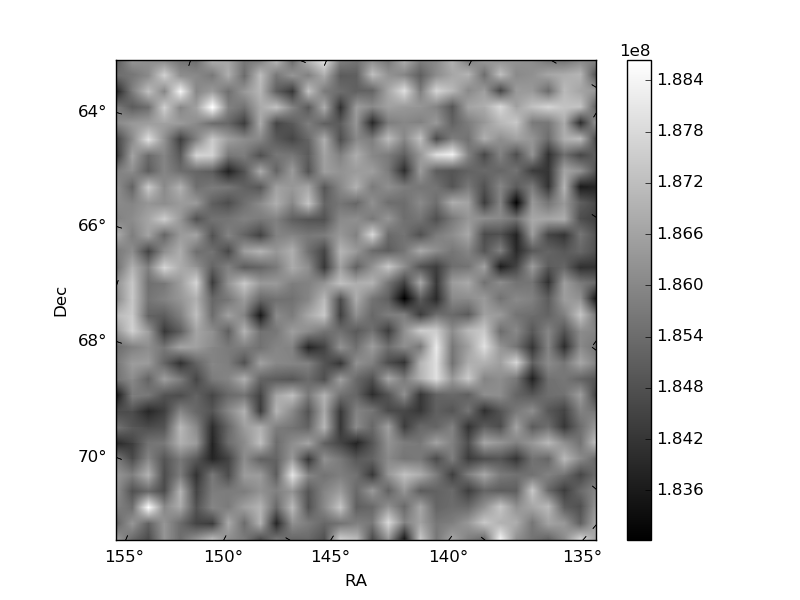
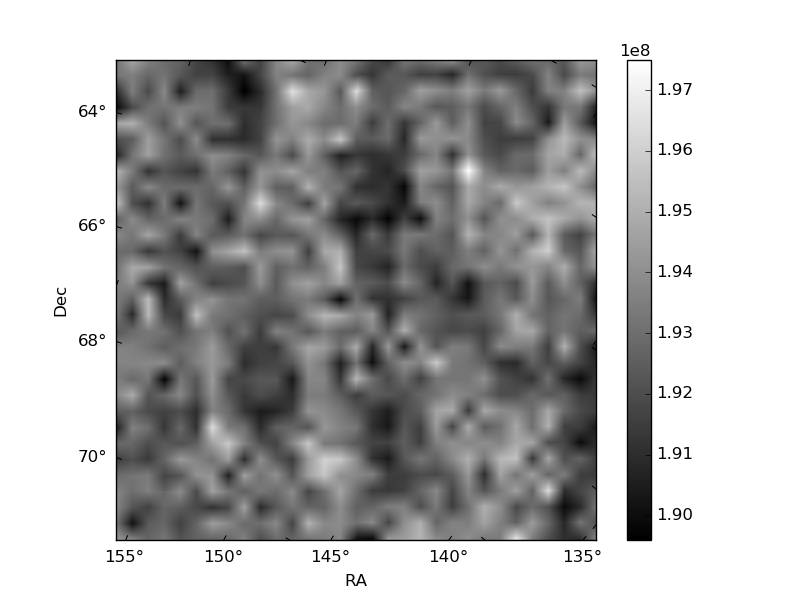
Histogram calculated using DETX and DETY for each event in the final _common_clean file
| Quadrant A | 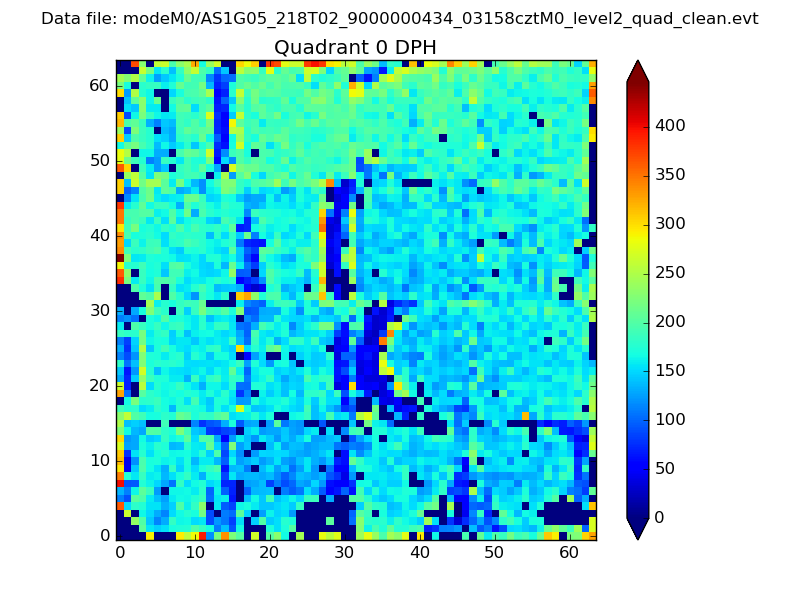 |
 |
Quadrant B |
|---|---|---|---|
| Quadrant D | 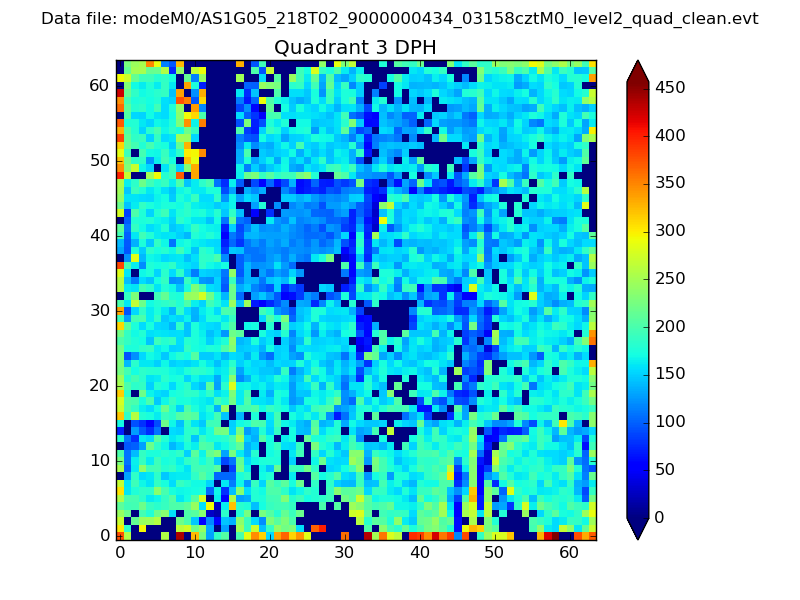 |
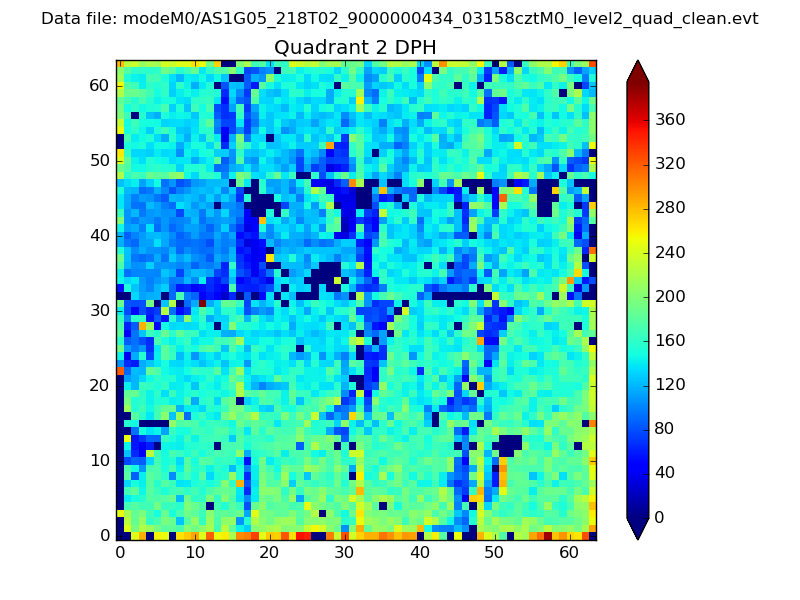 |
Quadrant C |
| Plot type | Count rate plots | Images |
|---|---|---|
| Comparison with Poisson distribution Blue bars denote a histogram of data divided into 1 sec bins. Red curve is a Poisson curve with rate = median count rate of data. |
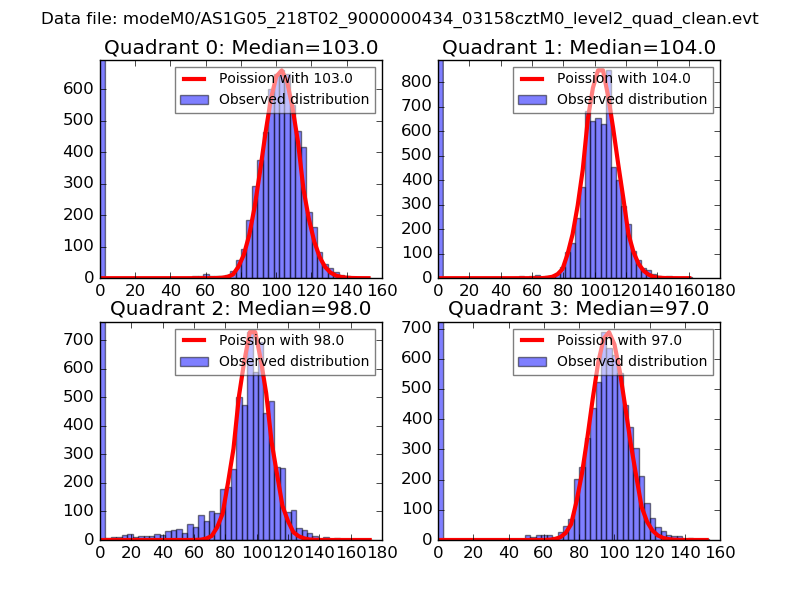 |
 |
| Quadrant-wise count rates Data is divided into 100 sec bins |
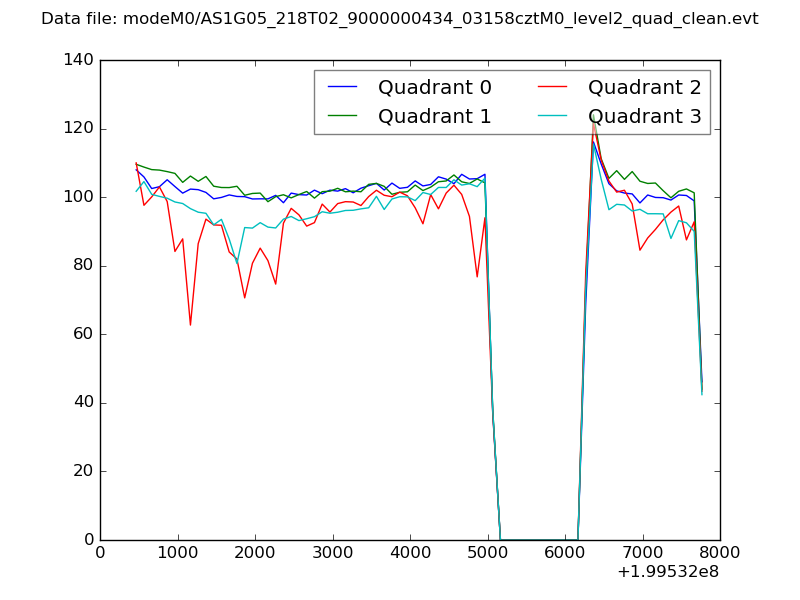 |
|
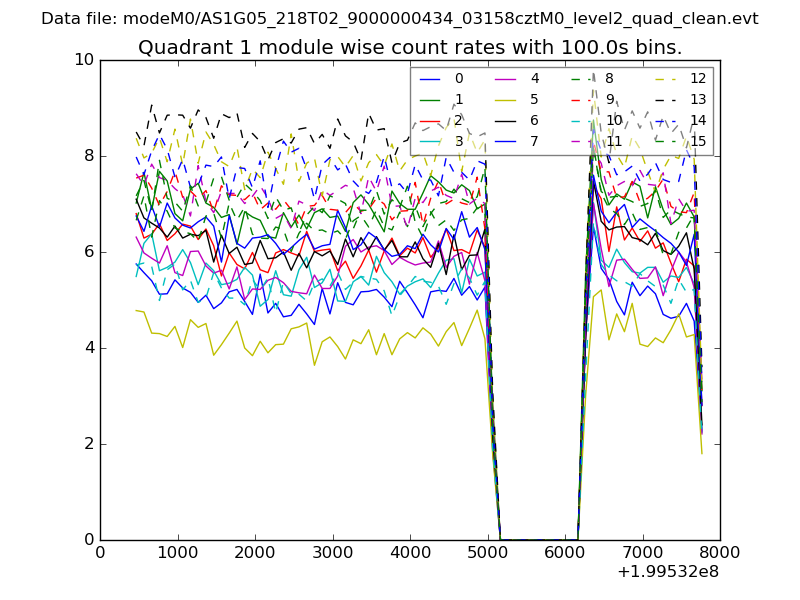
| Module-wise count rates for Quadrant A Data is divided into 100 sec bins |
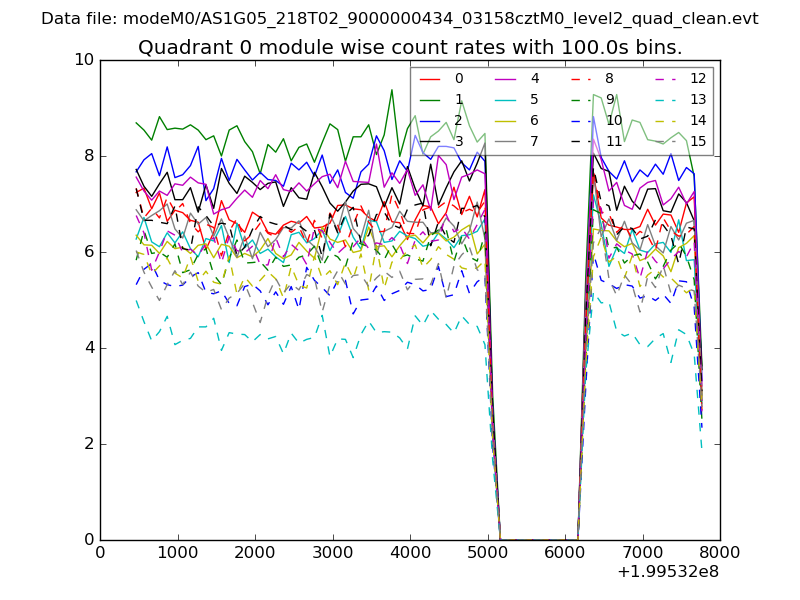 |
 |
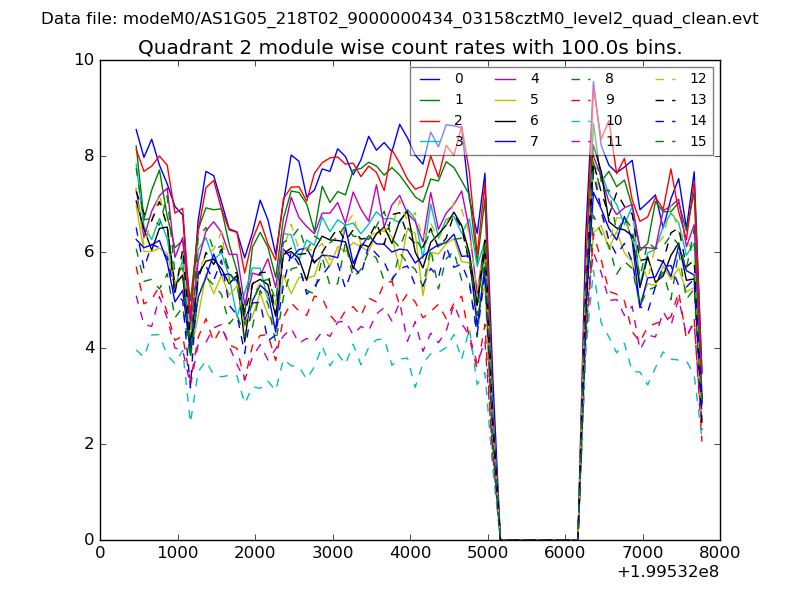
| Module-wise count rates for Quadrant B Data is divided into 100 sec bins |
 |
 |
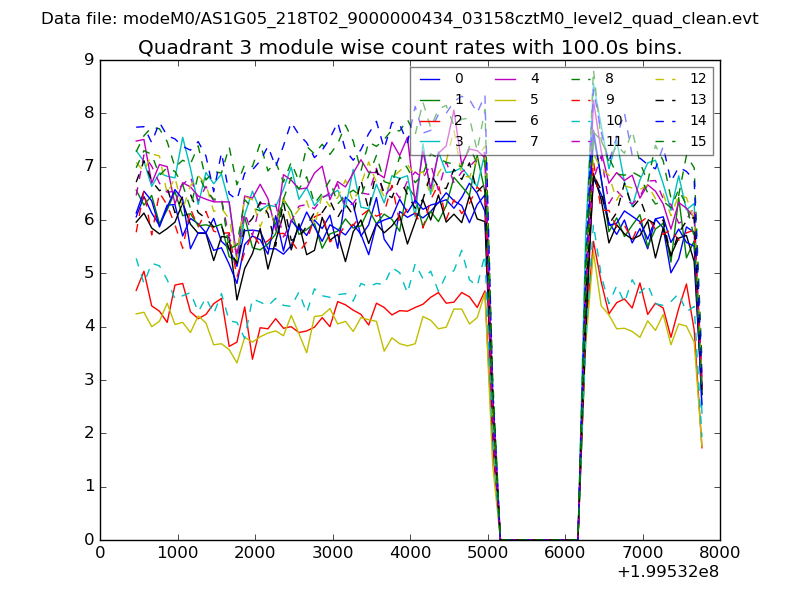
| Module-wise count rates for Quadrant C Data is divided into 100 sec bins |
 |
 |
| Module-wise count rates for Quadrant D Data is divided into 100 sec bins |
 |
 |
| Parameter | Plot |
|---|---|
| CZT HV Monitor | 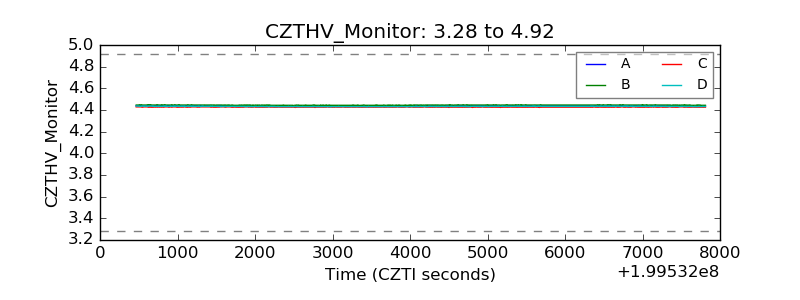 |
| D_VDD | 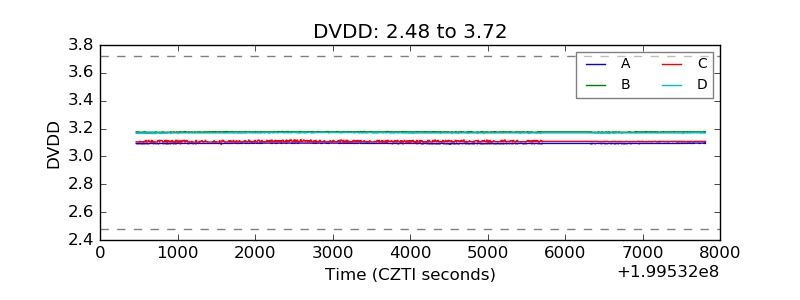 |
| Temperature 1 | 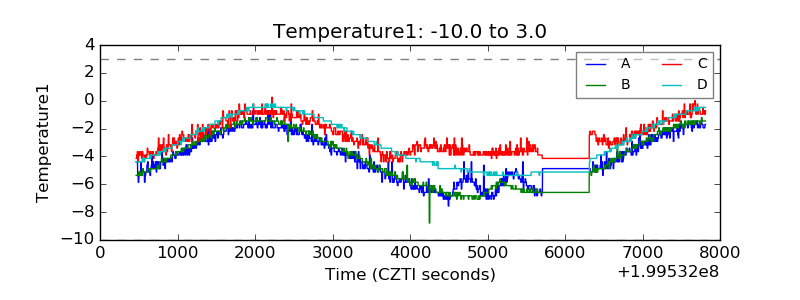 |
| Veto HV Monitor | 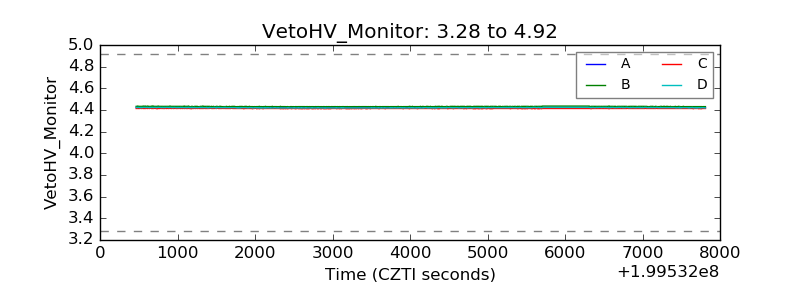 |
| Veto LLD | 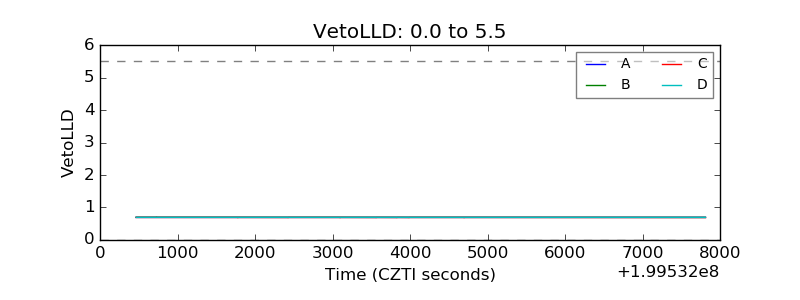 |
| Alpha Counter | 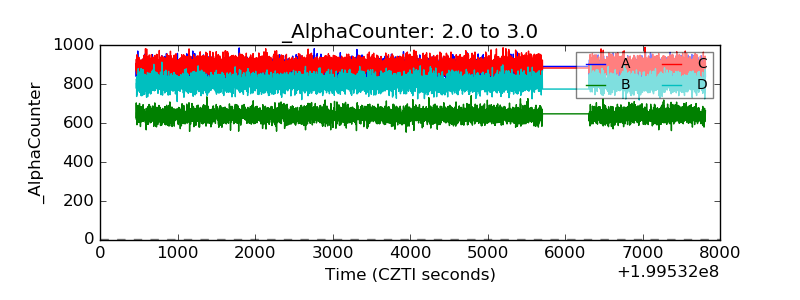 |
| _CPM_Rate | 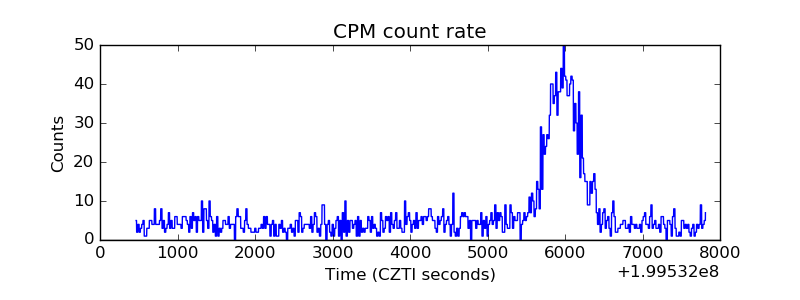 |
| CZT Counter | 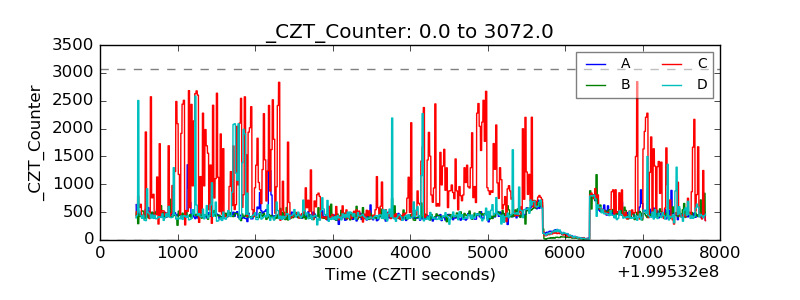 |
| +2.5 Volts monitor |  |
| +5 Volts monitor |  |
| _ROLL_ROT | 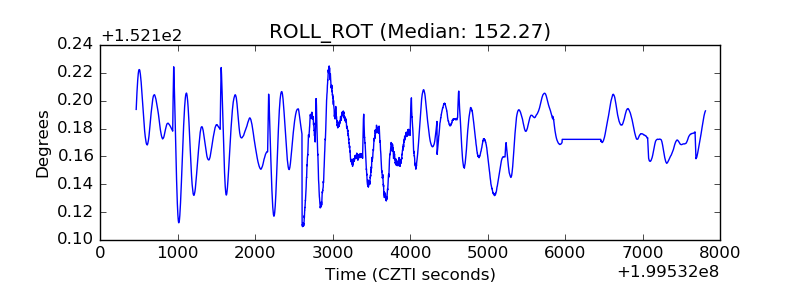 |
| _Roll_DEC | 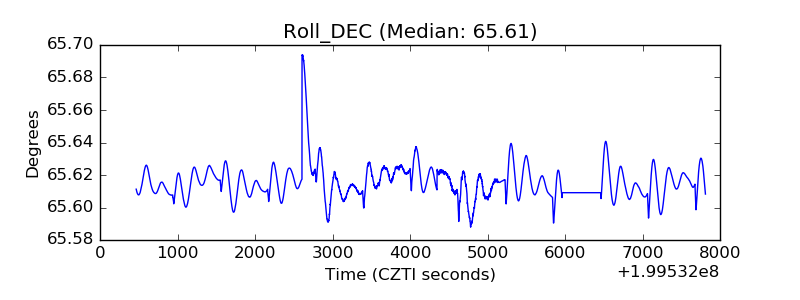 |
| _Roll_RA | 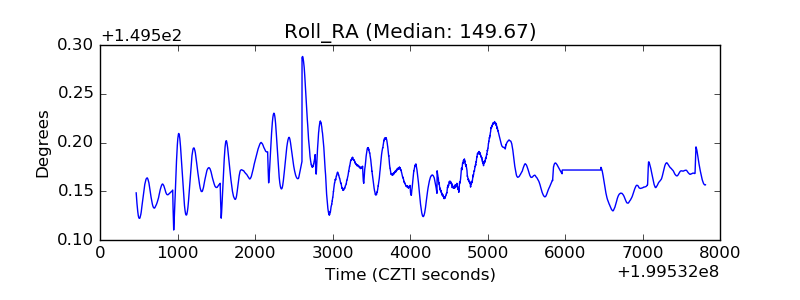 |
| Veto Counter | 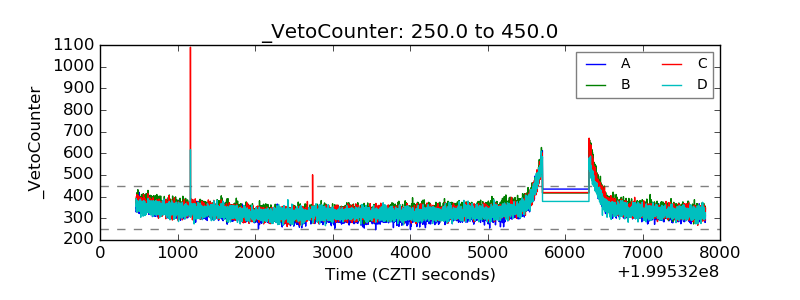 |