| Param | Original file | Final file |
|---|---|---|
| Filename | modeM0/AS1G05_218T02_9000000434_03159cztM0_level2.evt | modeM0/AS1G05_218T02_9000000434_03159cztM0_level2_quad_clean.evt |
| Size (bytes) | 539,714,880 | 108,302,400 |
| Size | 514.7 MB | 103.3 MB |
| Events in quadrant A | 3,603,262 | 693,881 |
| Events in quadrant B | 3,853,360 | 703,682 |
| Events in quadrant C | 4,207,066 | 677,638 |
| Events in quadrant D | 4,151,249 | 661,630 |
| Mode SS | |||
|---|---|---|---|
| Quadrant | BADHDUFLAG | Total packets | Discarded packets |
| A | 0 | 156 | 0 |
| B | 0 | 156 | 0 |
| C | 0 | 156 | 0 |
| D | 0 | 156 | 0 |
| Mode M0 | |||
|---|---|---|---|
| Quadrant | BADHDUFLAG | Total packets | Discarded packets |
| A | 0 | 16410 | 2 |
| B | 0 | 16819 | 1 |
| C | 0 | 18178 | 1 |
| D | 0 | 18080 | 1 |
| Mode M9 | |||
|---|---|---|---|
| Quadrant | BADHDUFLAG | Total packets | Discarded packets |
| A | 0 | 1 | 0 |
| B | 0 | 1 | 0 |
| C | 0 | 1 | 0 |
| D | 0 | 1 | 0 |
| Quadrant | Total seconds | Saturated seconds | Saturation percentage |
|---|---|---|---|
| A | 7812 | 271 | 3.469022% |
| B | 7812 | 214 | 2.739375% |
| C | 7812 | 331 | 4.237071% |
| D | 7812 | 320 | 4.096262% |
Noise dominated data is calculated using 1-second bins in cleaned event files. If a bin has >2000 counts, and if more than 50% of those come from <1% of pixels, then it is considered to be noise-dominated and hence unusable.
| Quadrant | # 1 sec bins | Bins with >0 counts | Bins with >2000 counts | High rate bins dominated by noise | Noise dominated (total time) | Noise dominated (detector-on time) | Marked lightcurve |
|---|---|---|---|---|---|---|---|
| A | 7832 | 7813 | 7 | 7 | 0.09% | 0.09% | 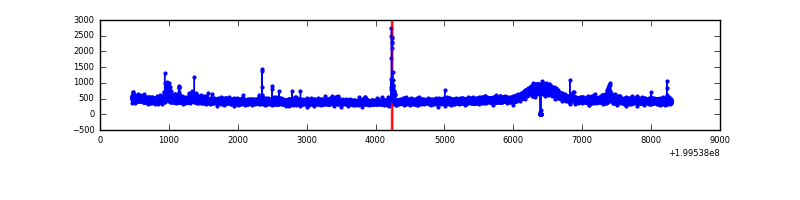 |
| B | 7832 | 7813 | 9 | 9 | 0.11% | 0.12% | 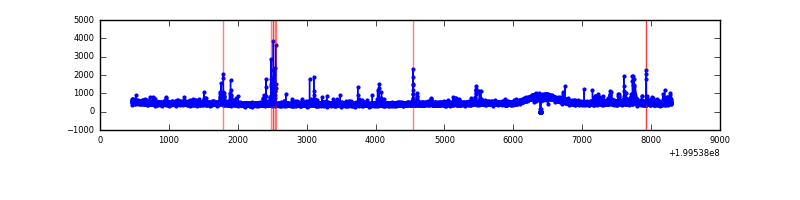 |
| C | 7832 | 7813 | 124 | 124 | 1.58% | 1.59% | 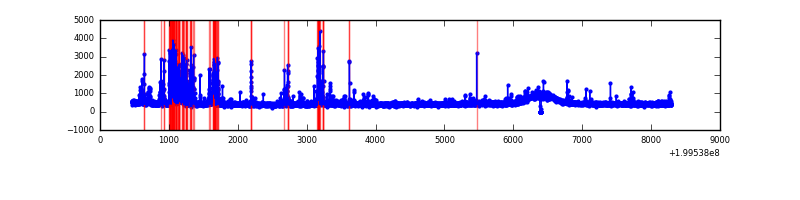 |
| D | 7832 | 7813 | 104 | 104 | 1.33% | 1.33% |  |
Top three noisy pixels from each quadrant. If the there are fewer than three noisy pixels in the level2.evt file, extra rows are filled as -1
| Pixel properties | Quadrant properties | ||||||
|---|---|---|---|---|---|---|---|
| Quadrant | DetID | PixID | Counts | Sigma | Mean | Median | Sigma |
| A | 0 | 149 | 37896 | 198.76 | 905 | 881 | 186.2 |
| A | 14 | 238 | 36253 | 189.93 | 905 | 881 | 186.2 |
| A | 0 | 199 | 16611 | 84.46 | 905 | 881 | 186.2 |
| B | 4 | 81 | 97888 | 545.6 | 918 | 895 | 177.8 |
| B | 14 | 167 | 56254 | 311.4 | 918 | 895 | 177.8 |
| B | 0 | 219 | 45719 | 252.14 | 918 | 895 | 177.8 |
| C | 14 | 223 | 624068 | 3057.74 | 875 | 873 | 203.8 |
| C | 15 | 208 | 68597 | 332.29 | 875 | 873 | 203.8 |
| C | 6 | 80 | 43943 | 211.33 | 875 | 873 | 203.8 |
| D | 2 | 136 | 297246 | 1379.85 | 879 | 849 | 214.8 |
| D | 13 | 239 | 261110 | 1211.62 | 879 | 849 | 214.8 |
| D | 5 | 233 | 58283 | 267.38 | 879 | 849 | 214.8 |
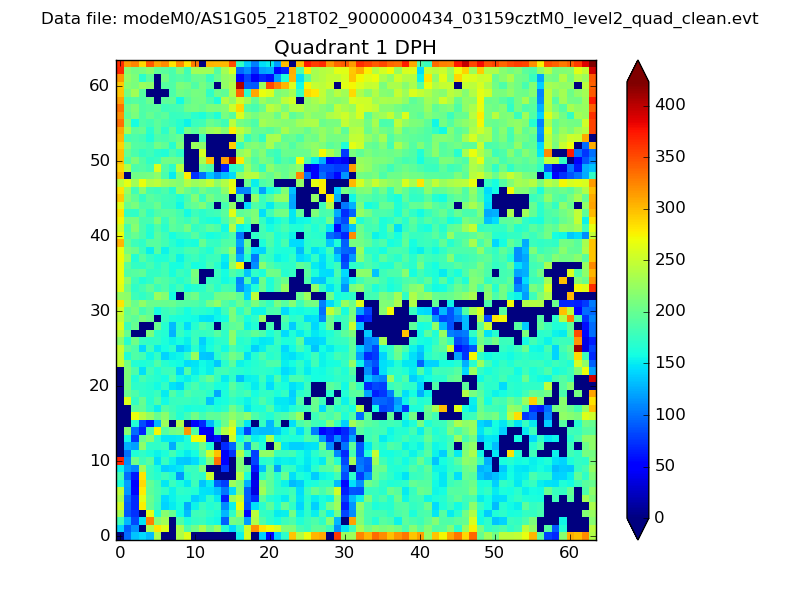
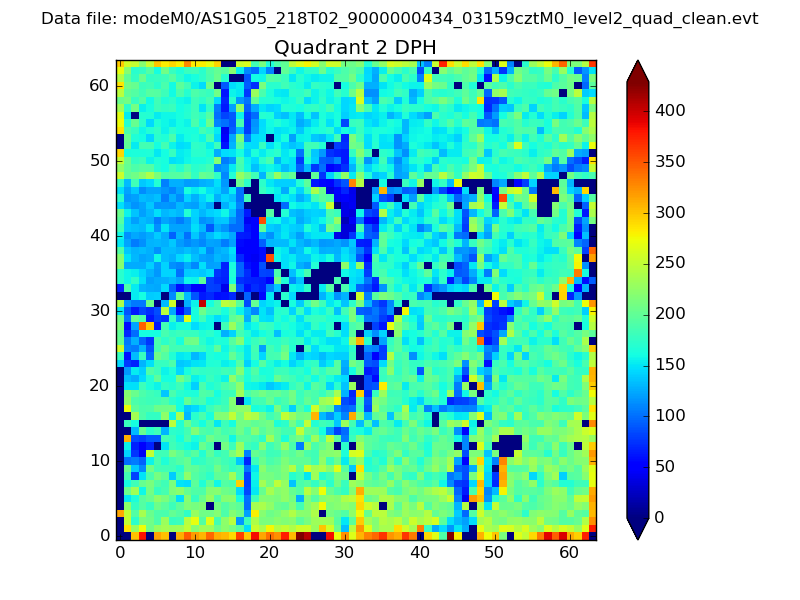
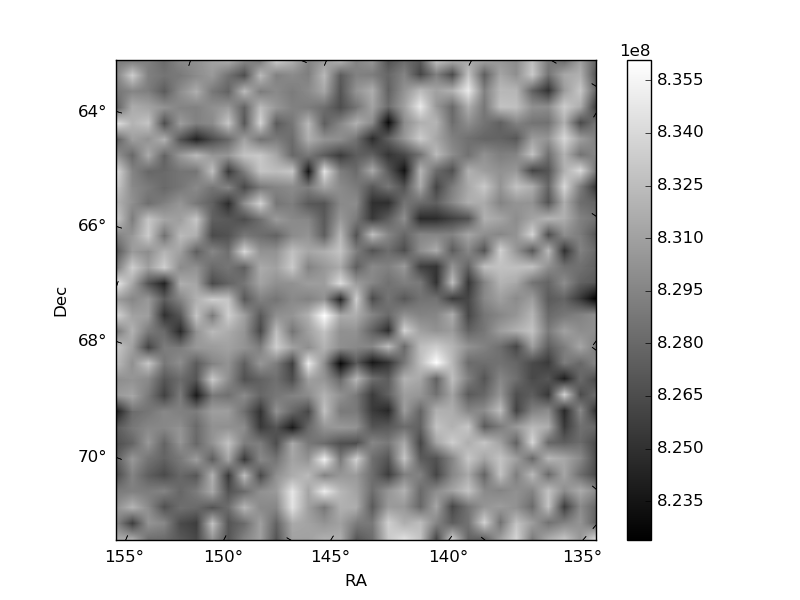
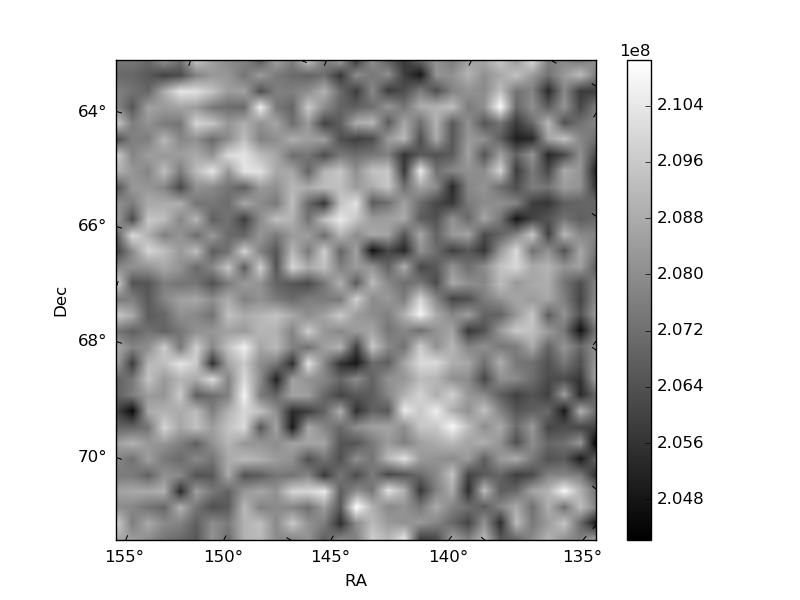
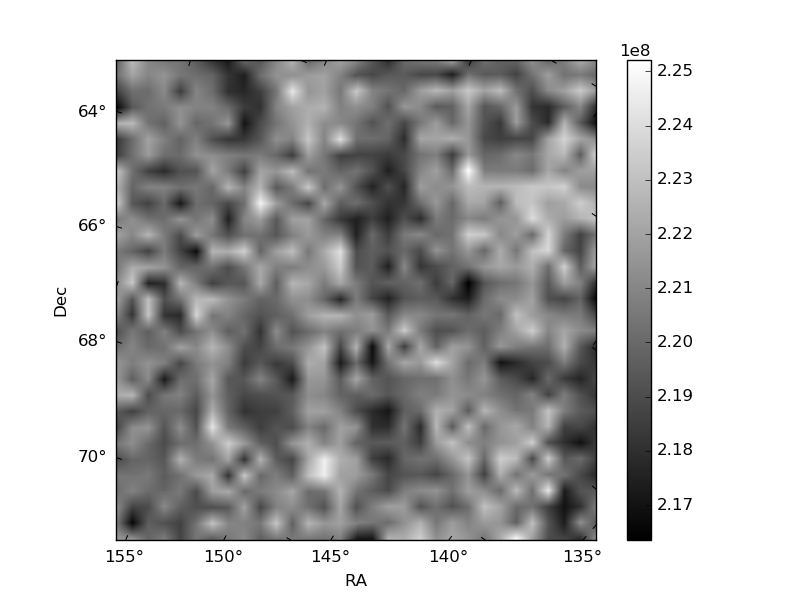
Histogram calculated using DETX and DETY for each event in the final _common_clean file
| Quadrant A | 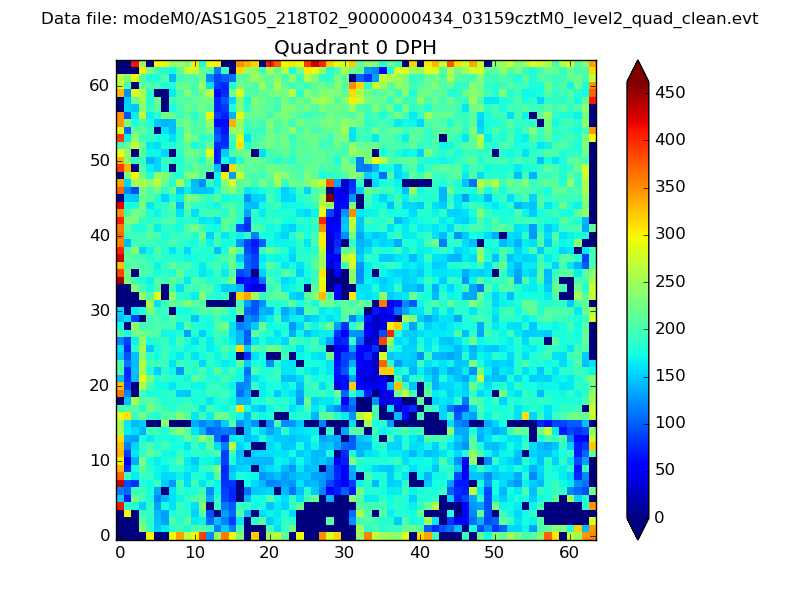 |
 |
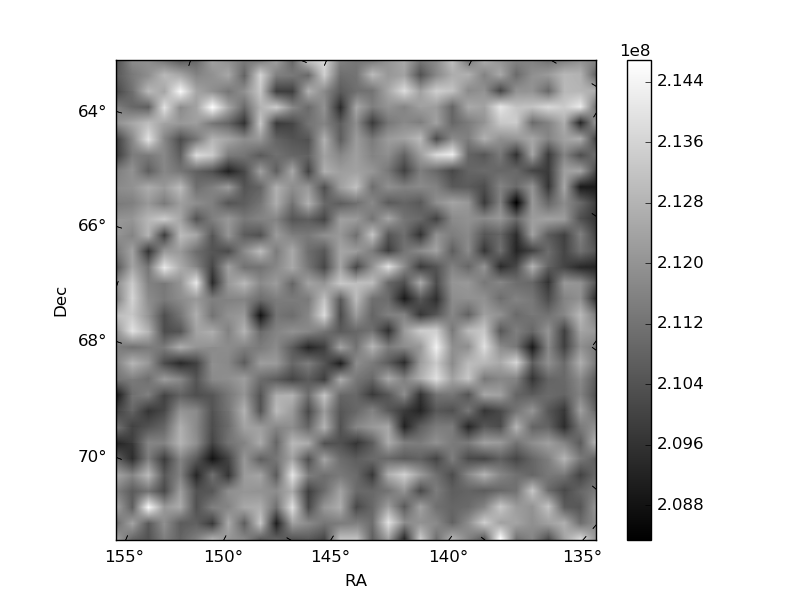
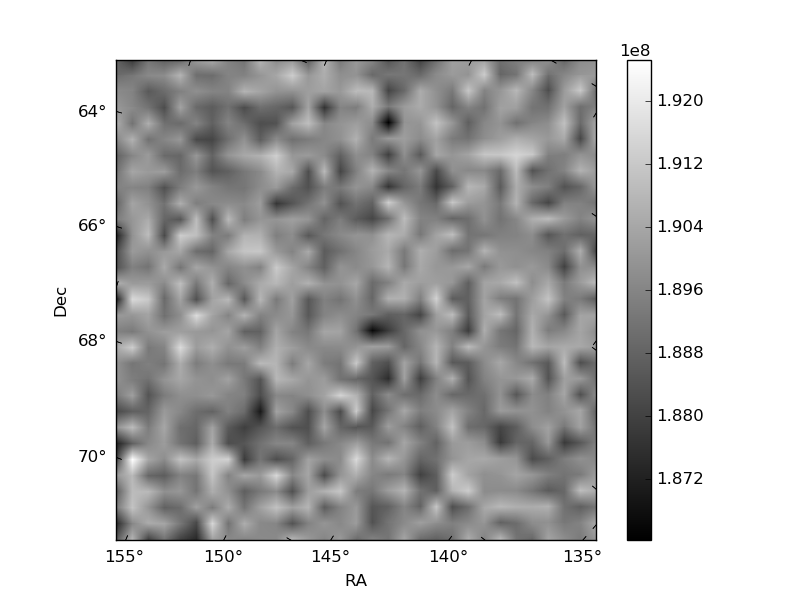
Quadrant B |
|---|---|---|---|
| Quadrant D | 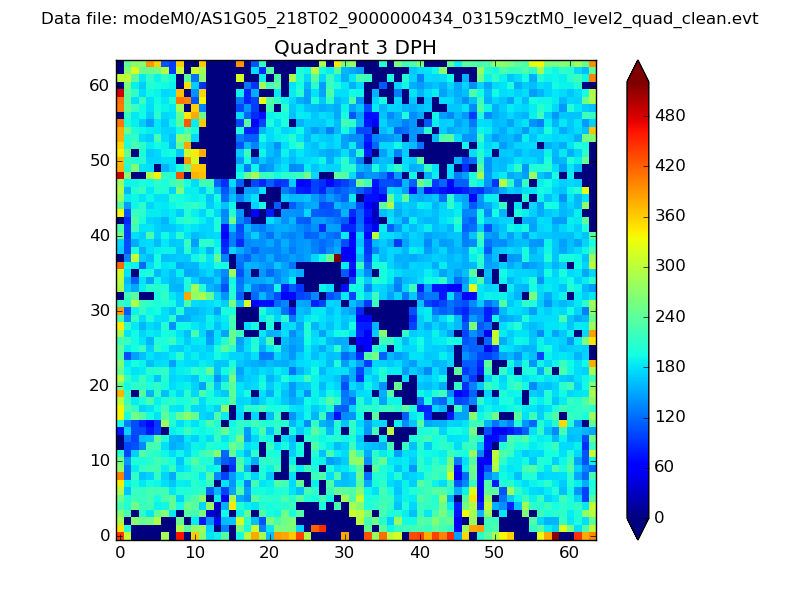 |
 |
Quadrant C |
| Plot type | Count rate plots | Images |
|---|---|---|
| Comparison with Poisson distribution Blue bars denote a histogram of data divided into 1 sec bins. Red curve is a Poisson curve with rate = median count rate of data. |
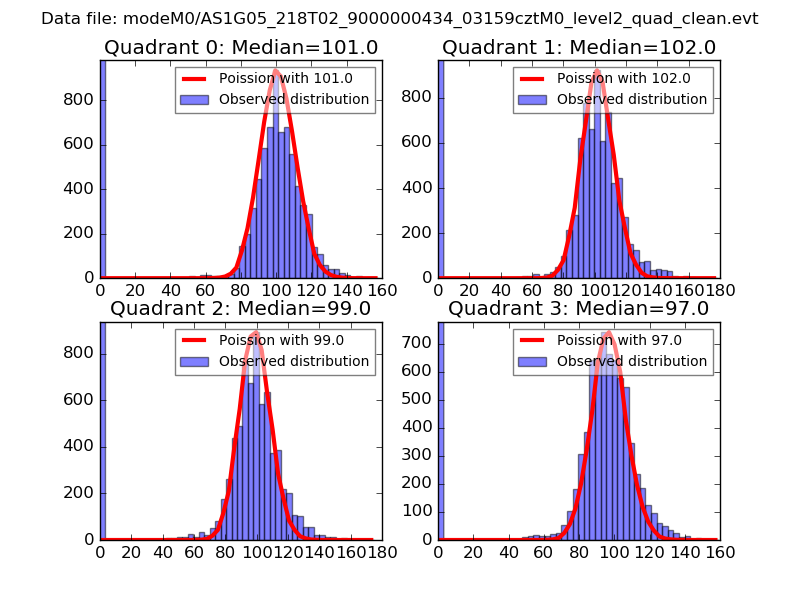 |
 |
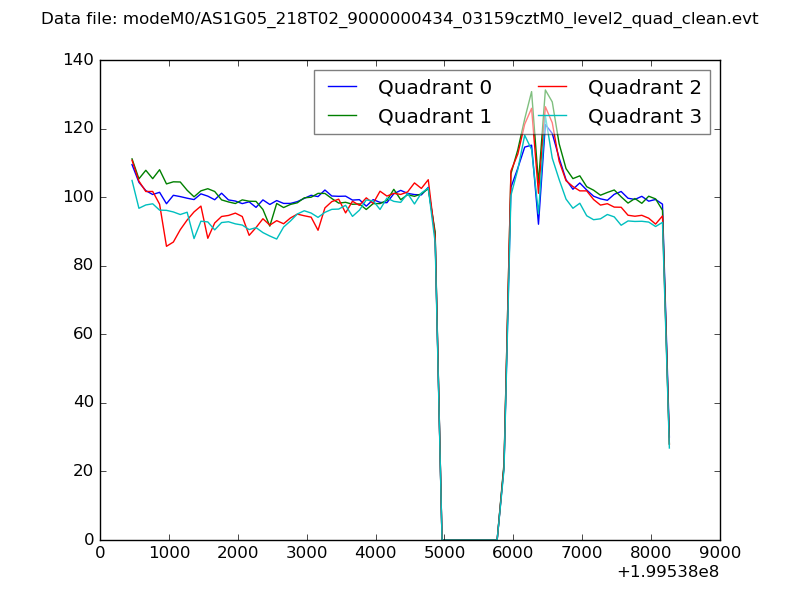
| Quadrant-wise count rates Data is divided into 100 sec bins |
 |
|
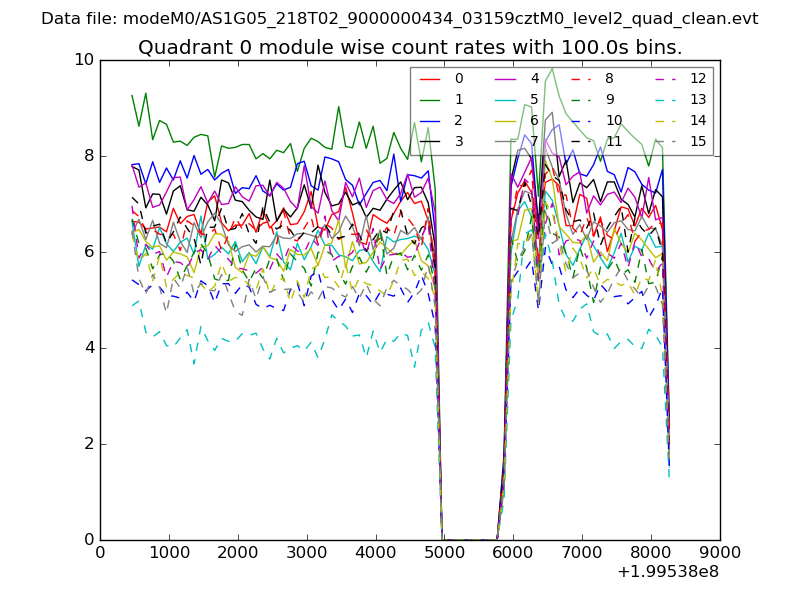
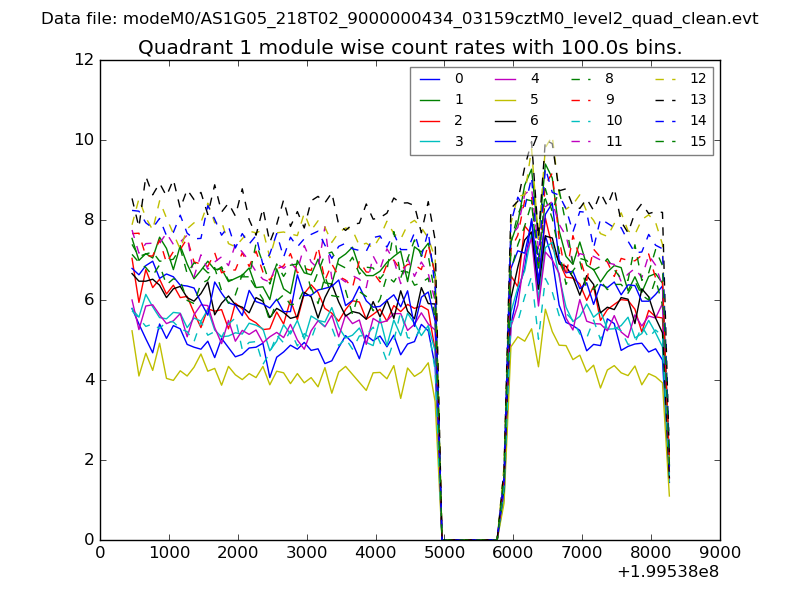
| Module-wise count rates for Quadrant A Data is divided into 100 sec bins |
 |
 |
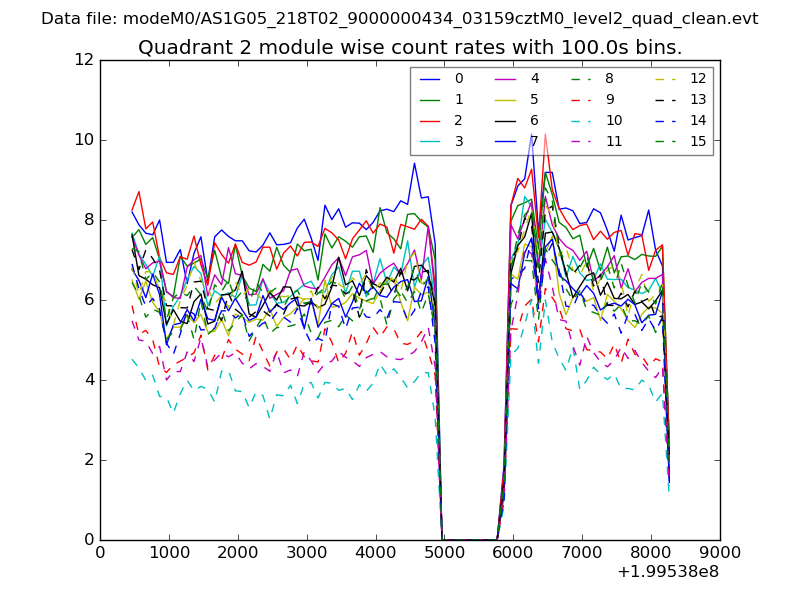
| Module-wise count rates for Quadrant B Data is divided into 100 sec bins |
 |
 |
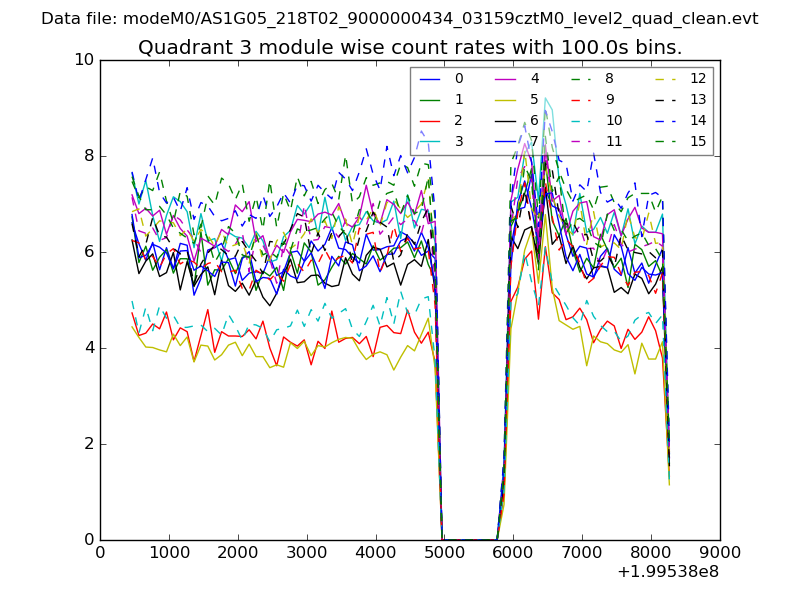
| Module-wise count rates for Quadrant C Data is divided into 100 sec bins |
 |
 |
| Module-wise count rates for Quadrant D Data is divided into 100 sec bins |
 |
 |
| Parameter | Plot |
|---|---|
| CZT HV Monitor | 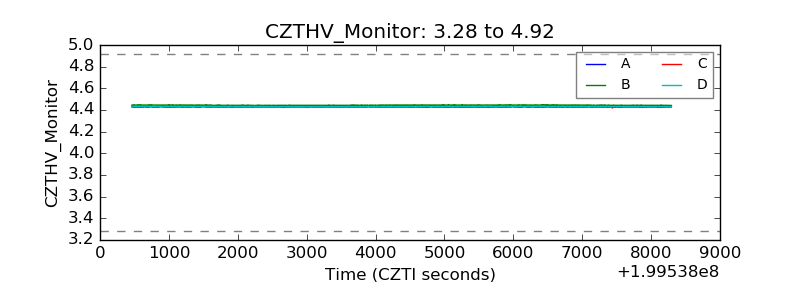 |
| D_VDD | 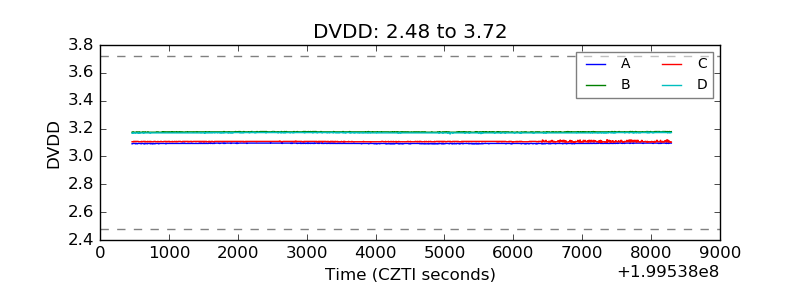 |
| Temperature 1 | 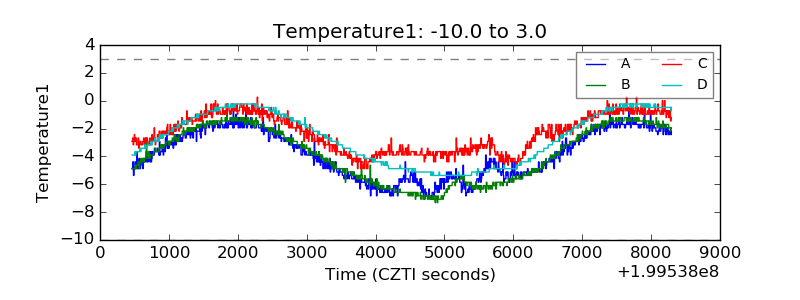 |
| Veto HV Monitor |  |
| Veto LLD | 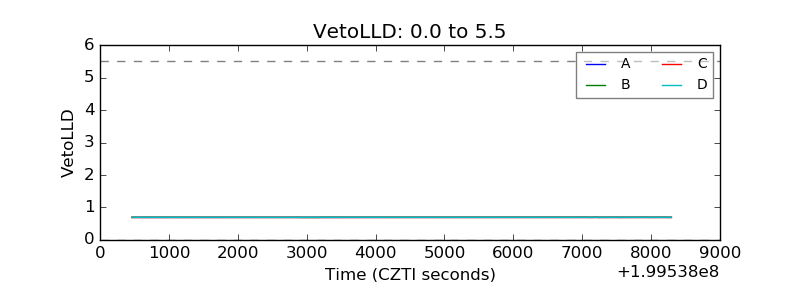 |
| Alpha Counter | 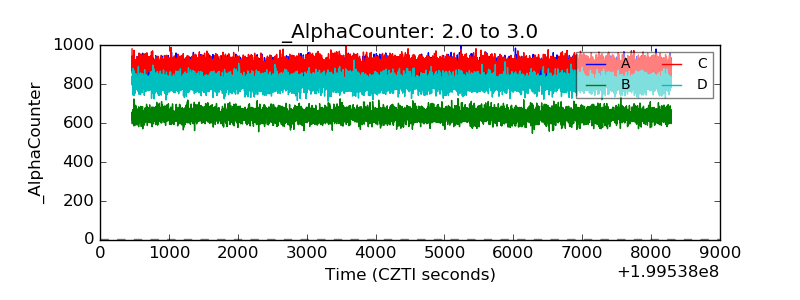 |
| _CPM_Rate | 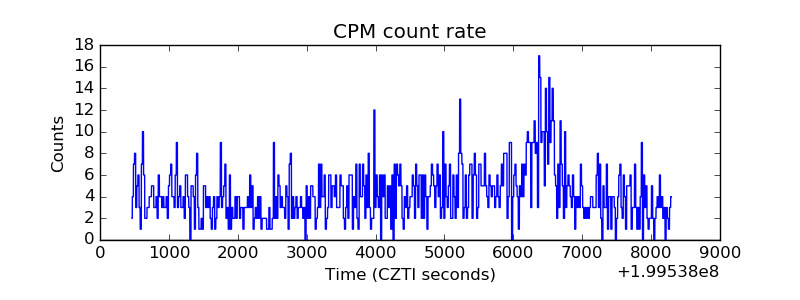 |
| CZT Counter | 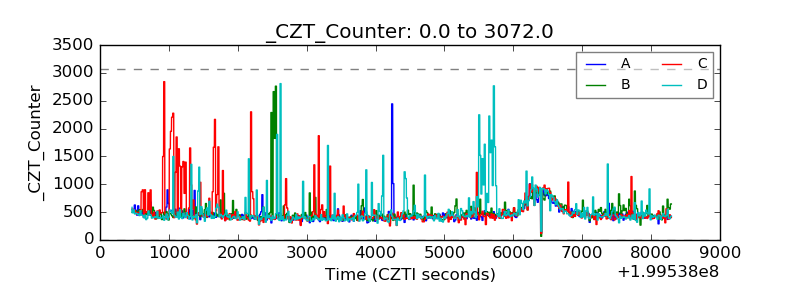 |
| +2.5 Volts monitor |  |
| +5 Volts monitor |  |
| _ROLL_ROT | 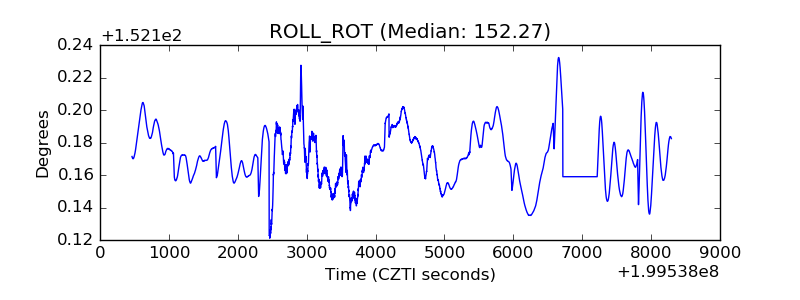 |
| _Roll_DEC | 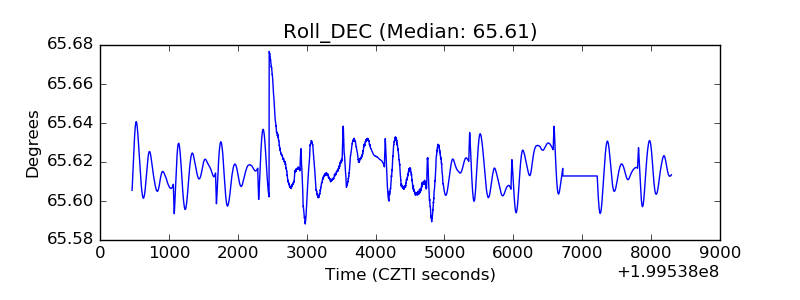 |
| _Roll_RA | 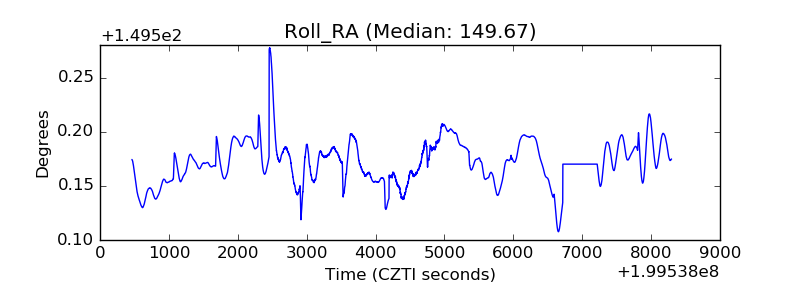 |
| Veto Counter | 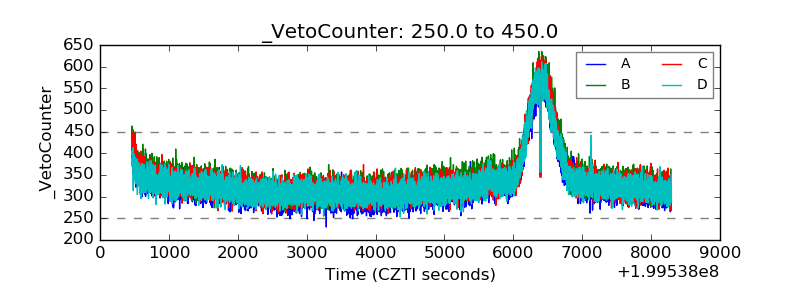 |