| Param | Original file | Final file |
|---|---|---|
| Filename | modeM0/AS1G05_218T02_9000000434_03160cztM0_level2.evt | modeM0/AS1G05_218T02_9000000434_03160cztM0_level2_quad_clean.evt |
| Size (bytes) | 504,627,840 | 97,629,120 |
| Size | 481.3 MB | 93.1 MB |
| Events in quadrant A | 3,522,319 | 625,293 |
| Events in quadrant B | 3,618,822 | 629,698 |
| Events in quadrant C | 3,756,644 | 608,211 |
| Events in quadrant D | 3,896,104 | 592,071 |
| Mode SS | |||
|---|---|---|---|
| Quadrant | BADHDUFLAG | Total packets | Discarded packets |
| A | 0 | 144 | 0 |
| B | 0 | 144 | 0 |
| C | 0 | 144 | 0 |
| D | 0 | 144 | 0 |
| Mode M0 | |||
|---|---|---|---|
| Quadrant | BADHDUFLAG | Total packets | Discarded packets |
| A | 0 | 15624 | 1 |
| B | 0 | 15776 | 0 |
| C | 0 | 16381 | 0 |
| D | 0 | 16823 | 0 |
| Quadrant | Total seconds | Saturated seconds | Saturation percentage |
|---|---|---|---|
| A | 7197 | 88 | 1.222732% |
| B | 7197 | 103 | 1.431152% |
| C | 7197 | 226 | 3.140197% |
| D | 7197 | 182 | 2.528831% |
Noise dominated data is calculated using 1-second bins in cleaned event files. If a bin has >2000 counts, and if more than 50% of those come from <1% of pixels, then it is considered to be noise-dominated and hence unusable.
| Quadrant | # 1 sec bins | Bins with >0 counts | Bins with >2000 counts | High rate bins dominated by noise | Noise dominated (total time) | Noise dominated (detector-on time) | Marked lightcurve |
|---|---|---|---|---|---|---|---|
| A | 7197 | 7197 | 21 | 21 | 0.29% | 0.29% | 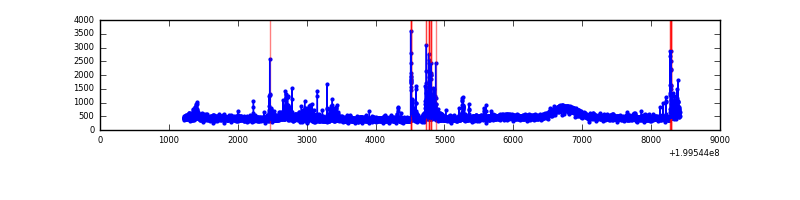 |
| B | 7197 | 7197 | 20 | 20 | 0.28% | 0.28% |  |
| C | 7196 | 7196 | 160 | 160 | 2.22% | 2.22% | 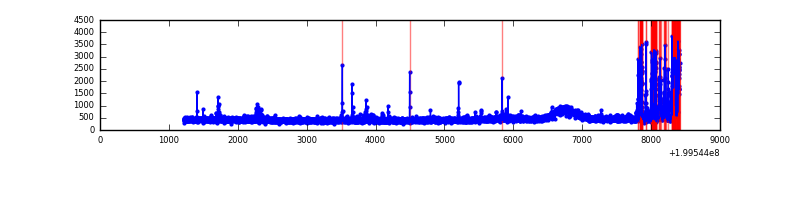 |
| D | 7197 | 7197 | 120 | 120 | 1.67% | 1.67% |  |
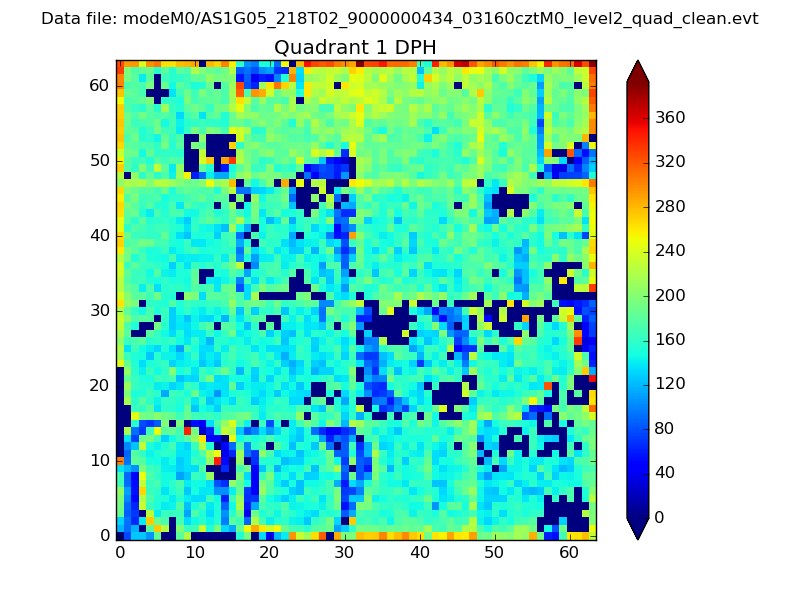
Top three noisy pixels from each quadrant. If the there are fewer than three noisy pixels in the level2.evt file, extra rows are filled as -1
| Pixel properties | Quadrant properties | ||||||
|---|---|---|---|---|---|---|---|
| Quadrant | DetID | PixID | Counts | Sigma | Mean | Median | Sigma |
| A | 0 | 149 | 138443 | 809.49 | 821 | 800 | 170.0 |
| A | 12 | 247 | 126067 | 736.71 | 821 | 800 | 170.0 |
| A | 14 | 249 | 44606 | 257.63 | 821 | 800 | 170.0 |
| B | 4 | 81 | 146707 | 908.35 | 832 | 812 | 160.6 |
| B | 2 | 249 | 74600 | 459.41 | 832 | 812 | 160.6 |
| B | 0 | 219 | 46162 | 282.35 | 832 | 812 | 160.6 |
| C | 1 | 192 | 529007 | 2848.59 | 793 | 794 | 185.4 |
| C | 14 | 223 | 45647 | 241.89 | 793 | 794 | 185.4 |
| C | 6 | 80 | 32136 | 169.02 | 793 | 794 | 185.4 |
| D | 2 | 136 | 320088 | 1640.74 | 796 | 771 | 194.6 |
| D | 13 | 223 | 183904 | 940.99 | 796 | 771 | 194.6 |
| D | 9 | 65 | 101870 | 519.47 | 796 | 771 | 194.6 |
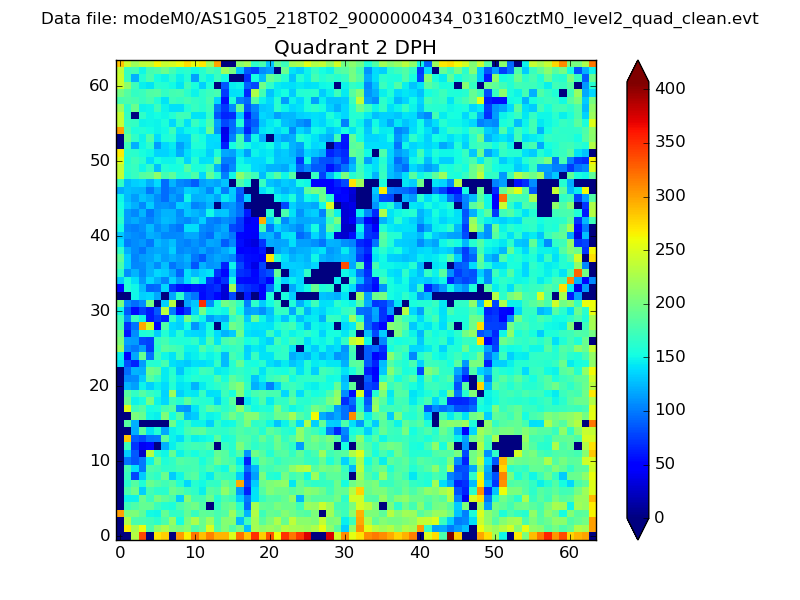
Histogram calculated using DETX and DETY for each event in the final _common_clean file
| Quadrant A | 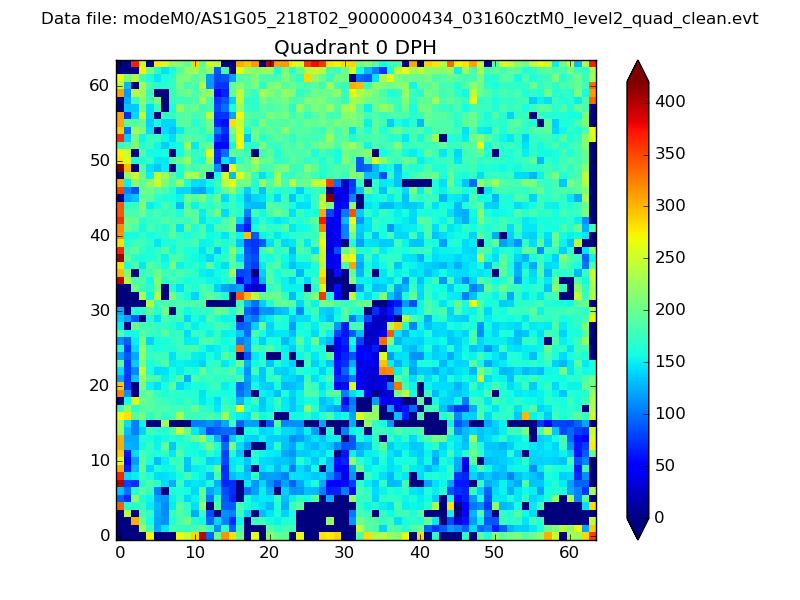 |
 |
Quadrant B |
|---|---|---|---|
| Quadrant D | 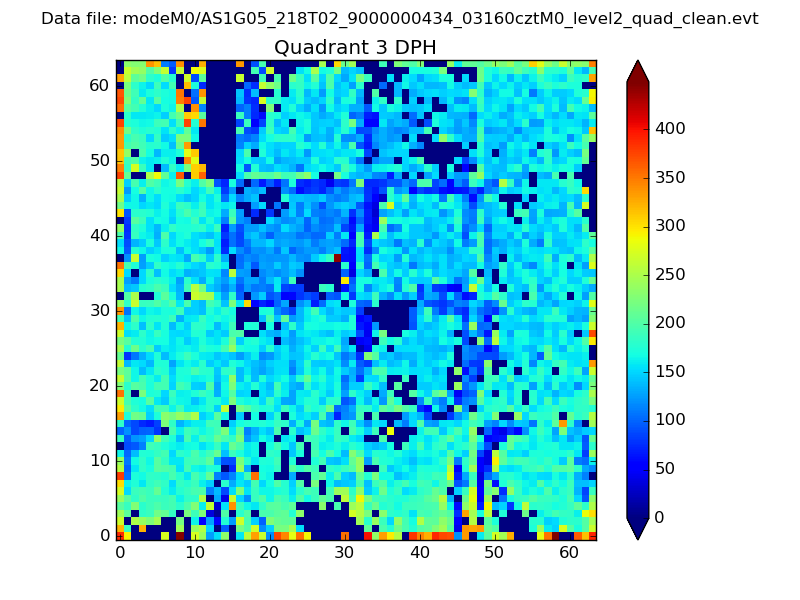 |
 |
Quadrant C |
| Plot type | Count rate plots | Images |
|---|---|---|
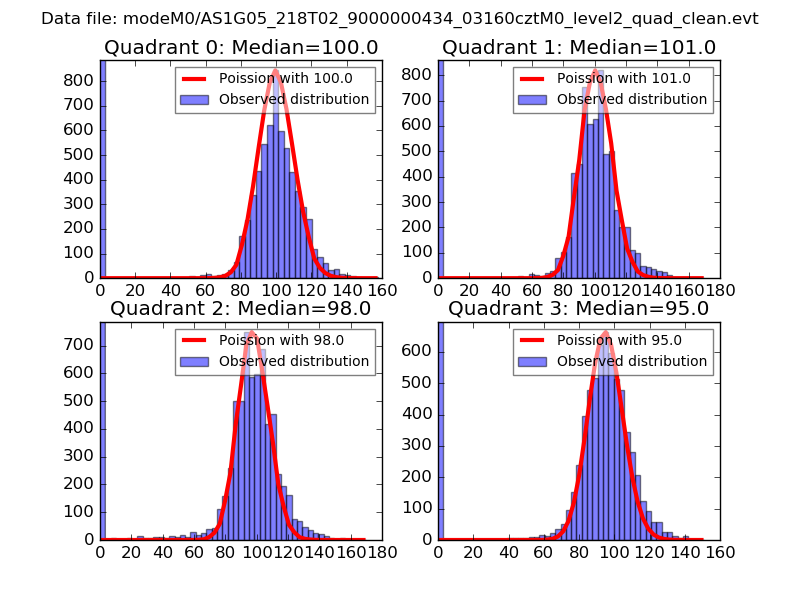
| Comparison with Poisson distribution Blue bars denote a histogram of data divided into 1 sec bins. Red curve is a Poisson curve with rate = median count rate of data. |
 |
 |
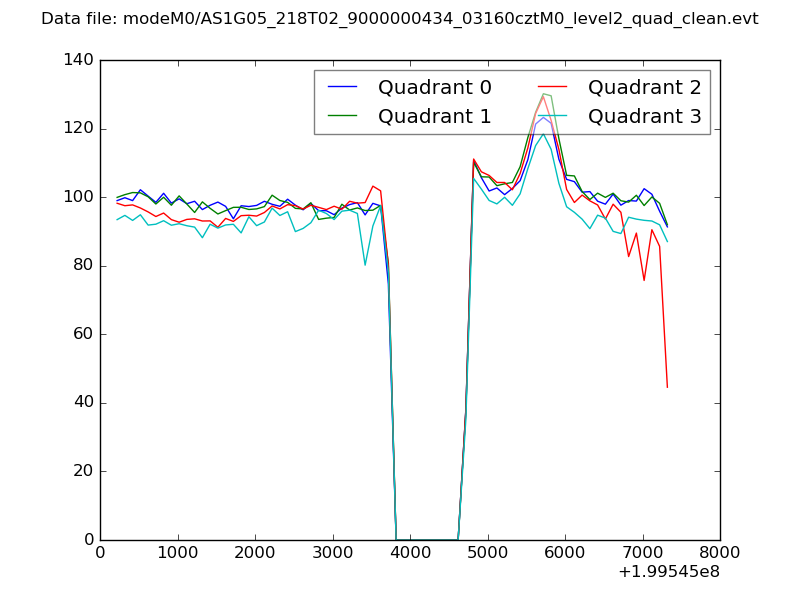
| Quadrant-wise count rates Data is divided into 100 sec bins |
 |
|
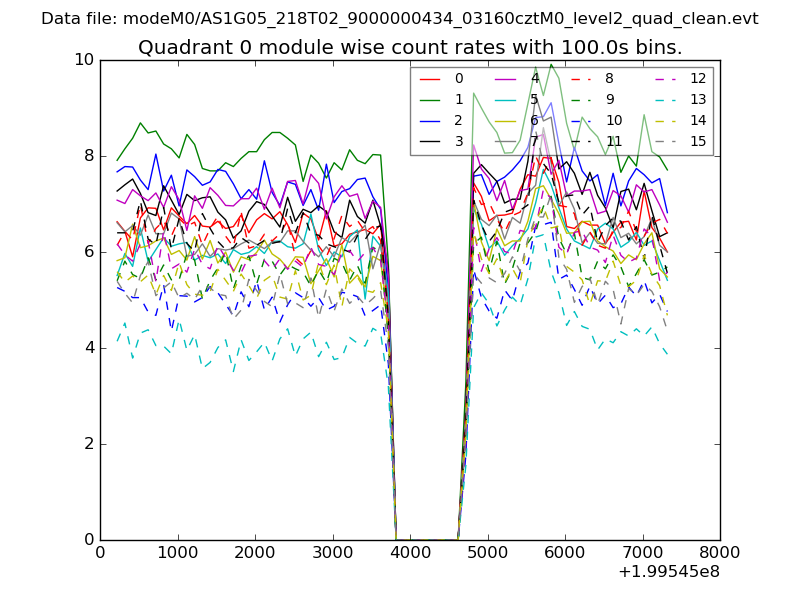
| Module-wise count rates for Quadrant A Data is divided into 100 sec bins |
 |
 |
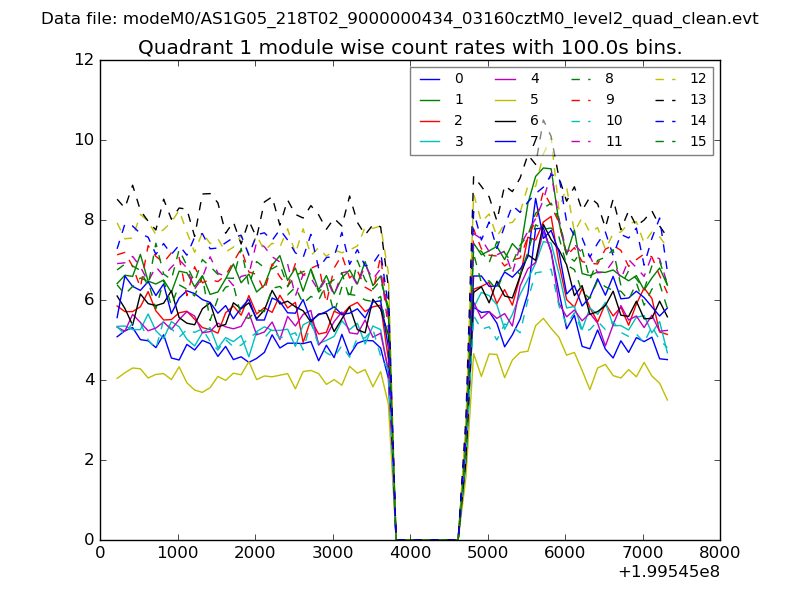
| Module-wise count rates for Quadrant B Data is divided into 100 sec bins |
 |
 |
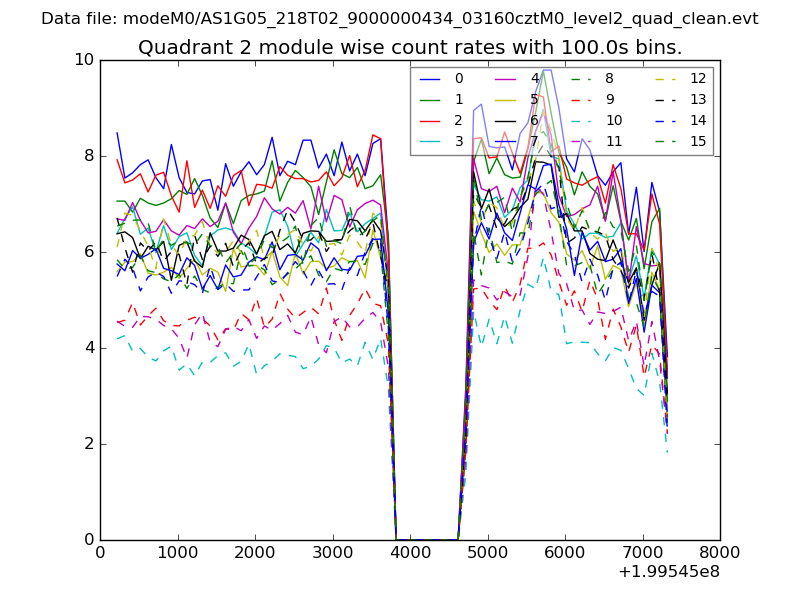
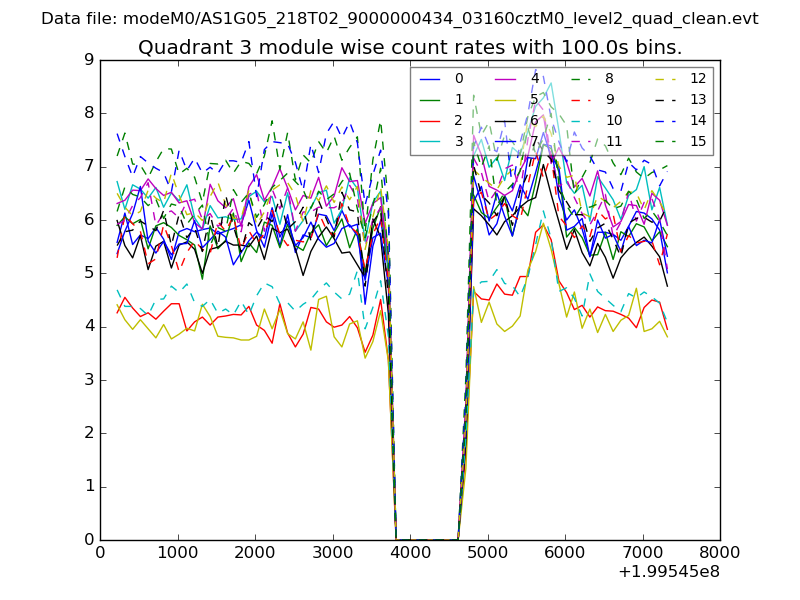
| Module-wise count rates for Quadrant C Data is divided into 100 sec bins |
 |
 |
| Module-wise count rates for Quadrant D Data is divided into 100 sec bins |
 |
 |
| Parameter | Plot |
|---|---|
| CZT HV Monitor | 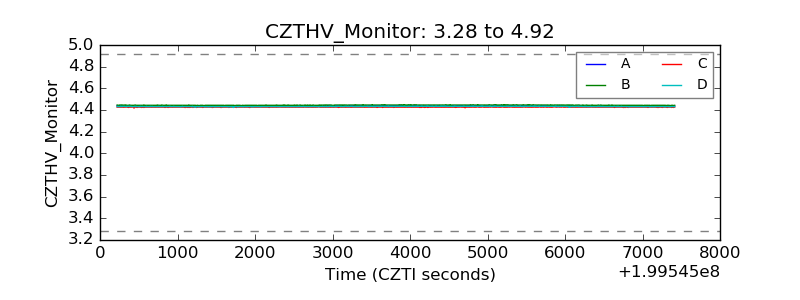 |
| D_VDD | 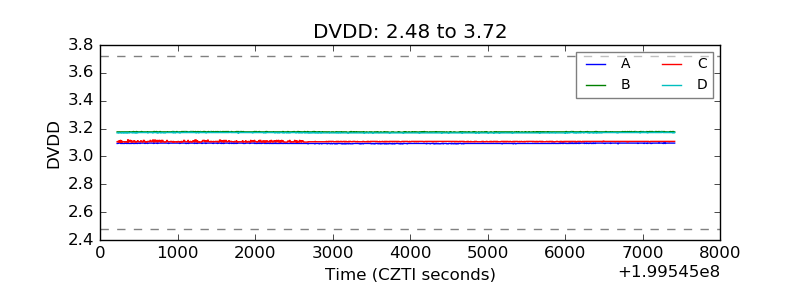 |
| Temperature 1 |  |
| Veto HV Monitor | 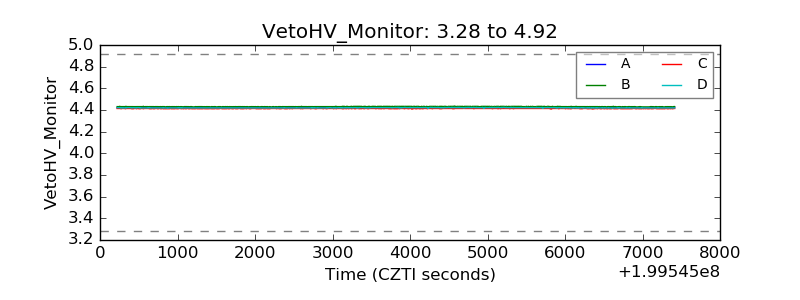 |
| Veto LLD | 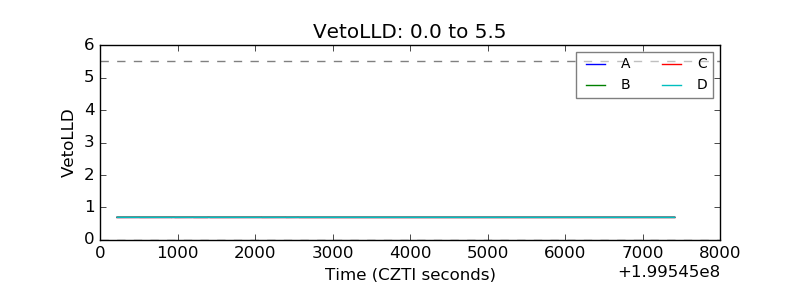 |
| Alpha Counter | 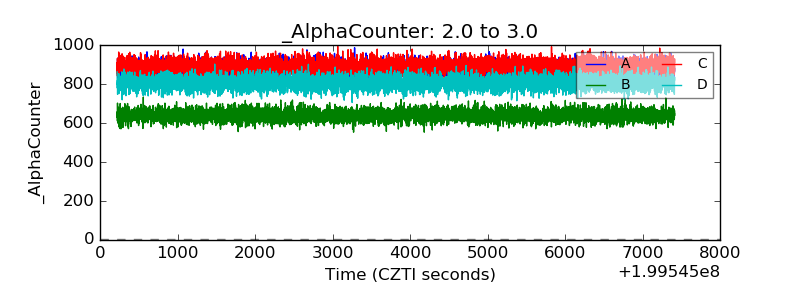 |
| _CPM_Rate | 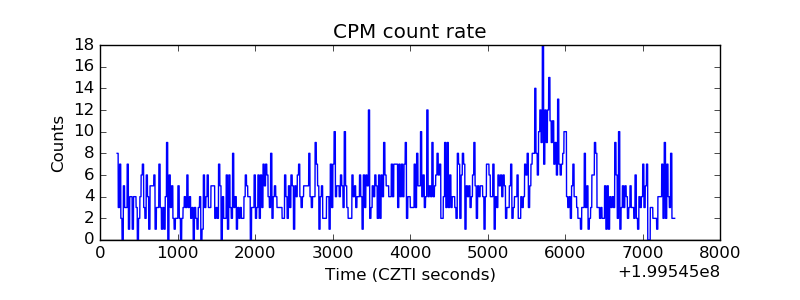 |
| CZT Counter | 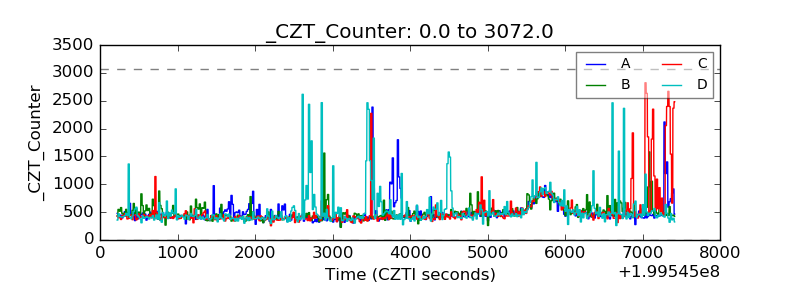 |
| +2.5 Volts monitor |  |
| +5 Volts monitor |  |
| _ROLL_ROT | 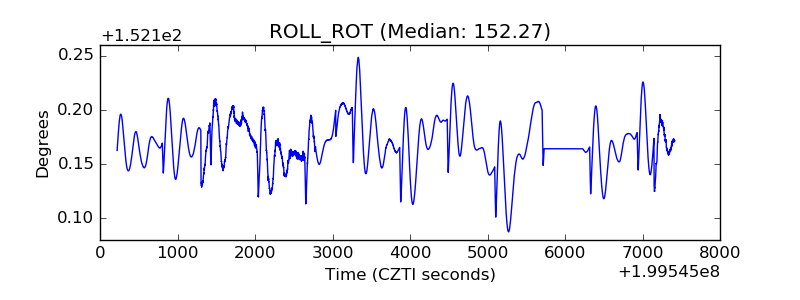 |
| _Roll_DEC | 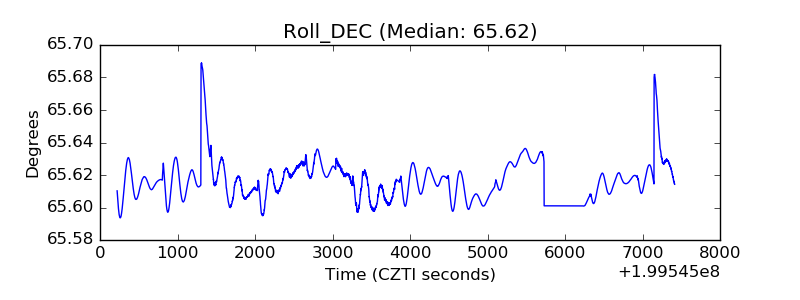 |
| _Roll_RA | 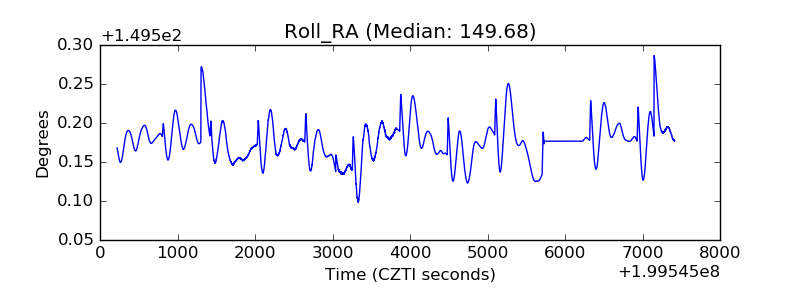 |
| Veto Counter | 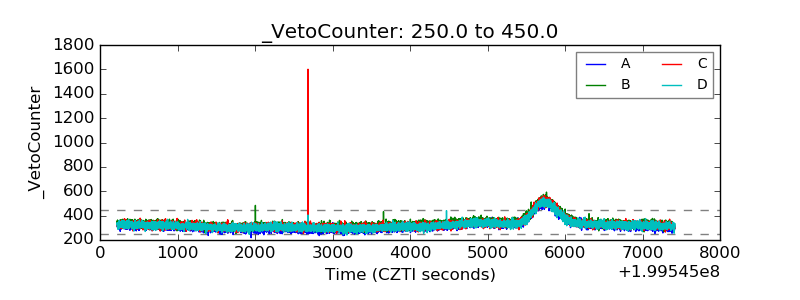 |