| Param | Original file | Final file |
|---|---|---|
| Filename | modeM0/AS1G05_218T02_9000000434_03161cztM0_level2.evt | modeM0/AS1G05_218T02_9000000434_03161cztM0_level2_quad_clean.evt |
| Size (bytes) | 565,289,280 | 98,081,280 |
| Size | 539.1 MB | 93.5 MB |
| Events in quadrant A | 3,515,086 | 632,192 |
| Events in quadrant B | 3,647,745 | 641,561 |
| Events in quadrant C | 5,409,407 | 581,845 |
| Events in quadrant D | 4,049,496 | 603,565 |
| Mode SS | |||
|---|---|---|---|
| Quadrant | BADHDUFLAG | Total packets | Discarded packets |
| A | 0 | 148 | 0 |
| B | 0 | 148 | 0 |
| C | 0 | 148 | 0 |
| D | 0 | 148 | 0 |
| Mode M0 | |||
|---|---|---|---|
| Quadrant | BADHDUFLAG | Total packets | Discarded packets |
| A | 0 | 15818 | 2 |
| B | 0 | 15945 | 1 |
| C | 0 | 21215 | 1 |
| D | 0 | 17219 | 1 |
| Mode M9 | |||
|---|---|---|---|
| Quadrant | BADHDUFLAG | Total packets | Discarded packets |
| A | 0 | 3 | 0 |
| B | 0 | 3 | 0 |
| C | 0 | 3 | 0 |
| D | 0 | 3 | 0 |
| Quadrant | Total seconds | Saturated seconds | Saturation percentage |
|---|---|---|---|
| A | 7339 | 154 | 2.098379% |
| B | 7339 | 89 | 1.212699% |
| C | 7339 | 833 | 11.350320% |
| D | 7339 | 189 | 2.575283% |
Noise dominated data is calculated using 1-second bins in cleaned event files. If a bin has >2000 counts, and if more than 50% of those come from <1% of pixels, then it is considered to be noise-dominated and hence unusable.
| Quadrant | # 1 sec bins | Bins with >0 counts | Bins with >2000 counts | High rate bins dominated by noise | Noise dominated (total time) | Noise dominated (detector-on time) | Marked lightcurve |
|---|---|---|---|---|---|---|---|
| A | 7574 | 7340 | 33 | 33 | 0.44% | 0.45% | 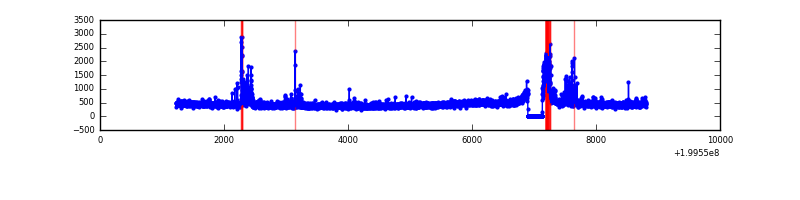 |
| B | 7574 | 7340 | 17 | 17 | 0.22% | 0.23% | 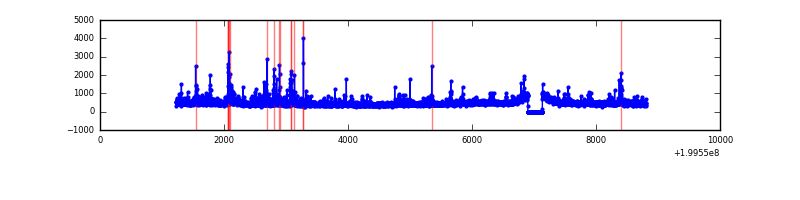 |
| C | 7574 | 7340 | 738 | 738 | 9.74% | 10.05% | 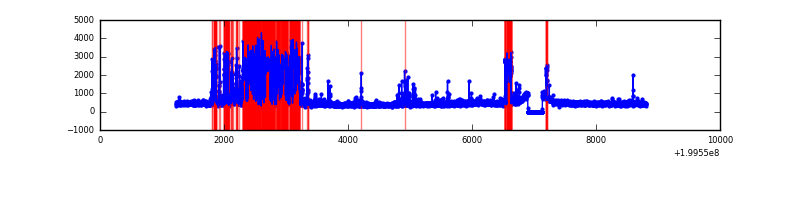 |
| D | 7574 | 7340 | 127 | 127 | 1.68% | 1.73% | 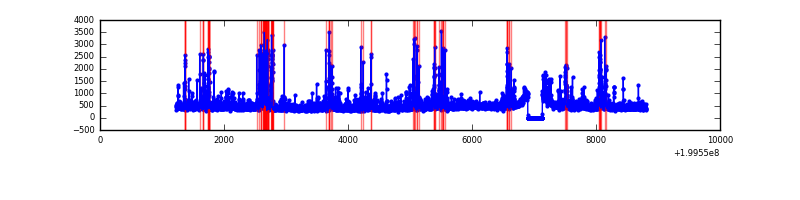 |
Top three noisy pixels from each quadrant. If the there are fewer than three noisy pixels in the level2.evt file, extra rows are filled as -1
| Pixel properties | Quadrant properties | ||||||
|---|---|---|---|---|---|---|---|
| Quadrant | DetID | PixID | Counts | Sigma | Mean | Median | Sigma |
| A | 0 | 199 | 176192 | 1041.1 | 817 | 797 | 168.5 |
| A | 12 | 247 | 116327 | 685.76 | 817 | 797 | 168.5 |
| A | 0 | 226 | 26573 | 153.0 | 817 | 797 | 168.5 |
| B | 4 | 81 | 233813 | 1427.81 | 837 | 816 | 163.2 |
| B | 15 | 85 | 45797 | 275.64 | 837 | 816 | 163.2 |
| B | 0 | 219 | 33433 | 199.88 | 837 | 816 | 163.2 |
| C | 1 | 192 | 1954247 | 10960.23 | 763 | 766 | 178.2 |
| C | 14 | 234 | 185260 | 1035.12 | 763 | 766 | 178.2 |
| C | 14 | 223 | 159735 | 891.91 | 763 | 766 | 178.2 |
| D | 5 | 233 | 302923 | 1549.81 | 801 | 775 | 195.0 |
| D | 2 | 136 | 163417 | 834.24 | 801 | 775 | 195.0 |
| D | 13 | 120 | 123957 | 631.84 | 801 | 775 | 195.0 |
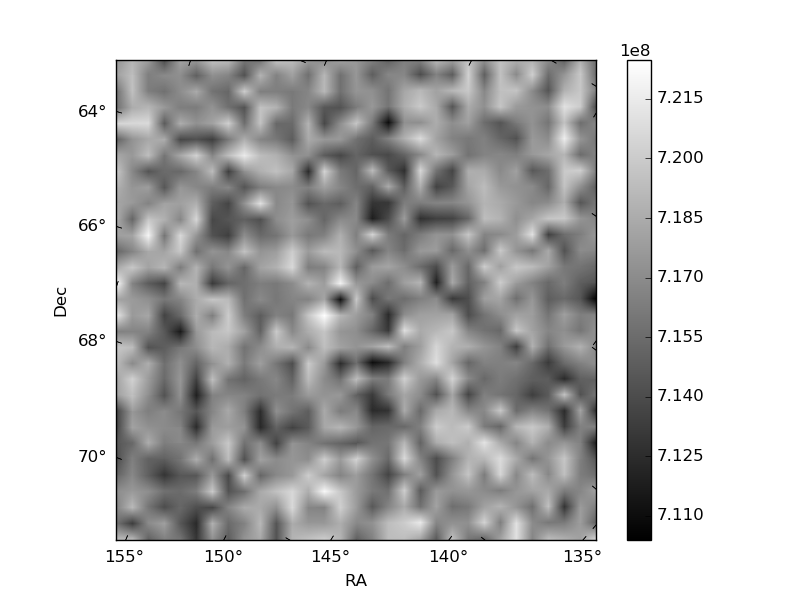
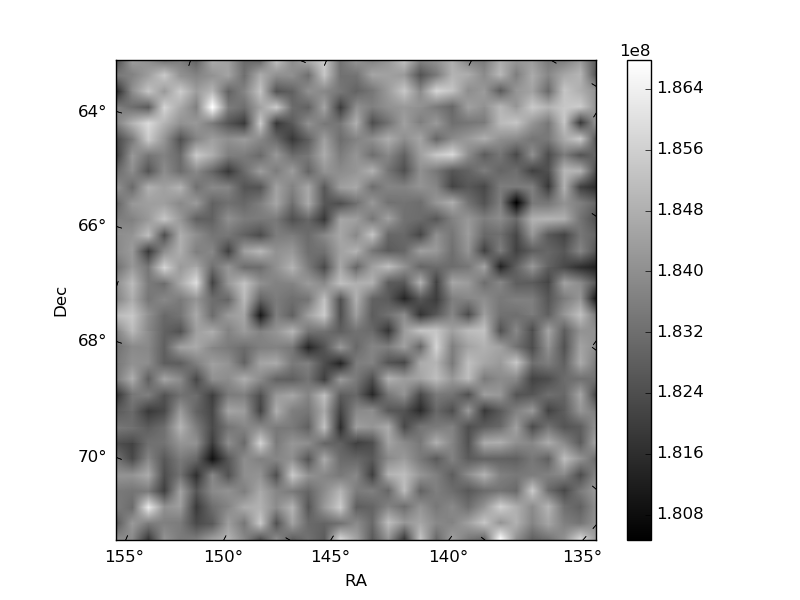
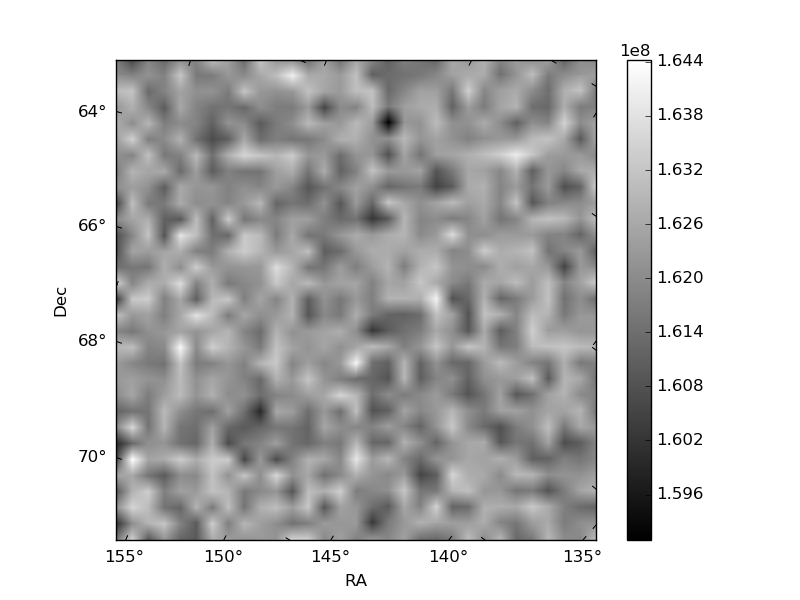
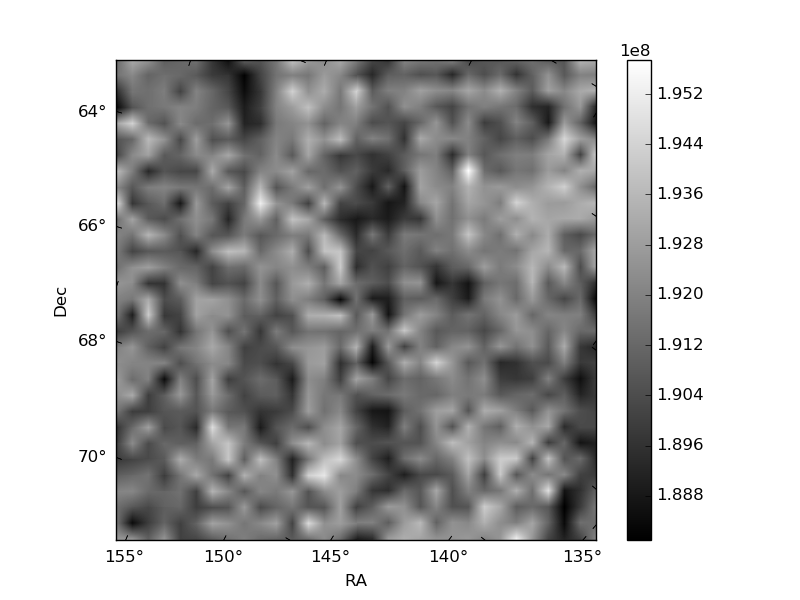
Histogram calculated using DETX and DETY for each event in the final _common_clean file
| Quadrant A | 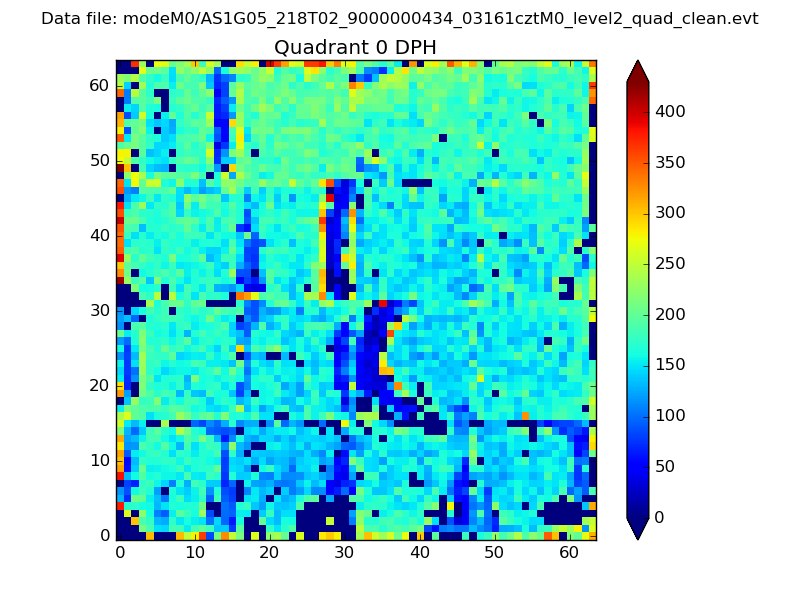 |
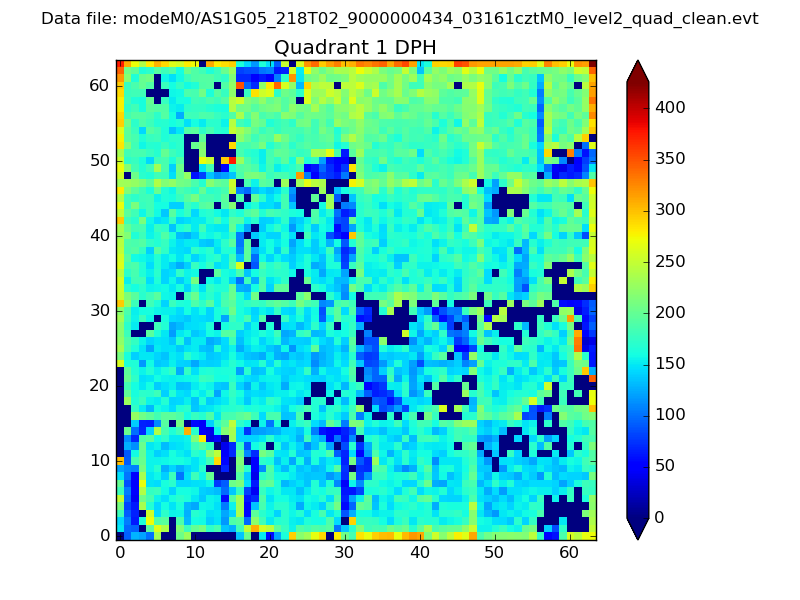 |
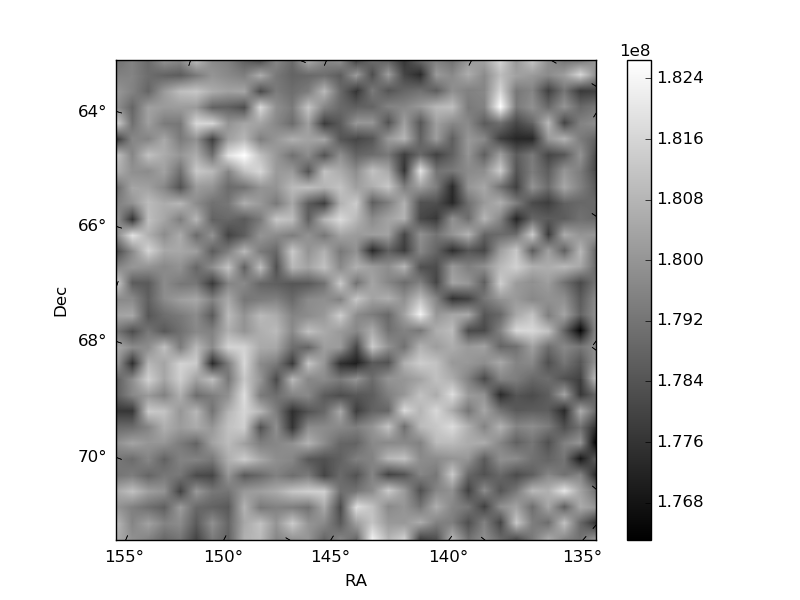
Quadrant B |
|---|---|---|---|
| Quadrant D | 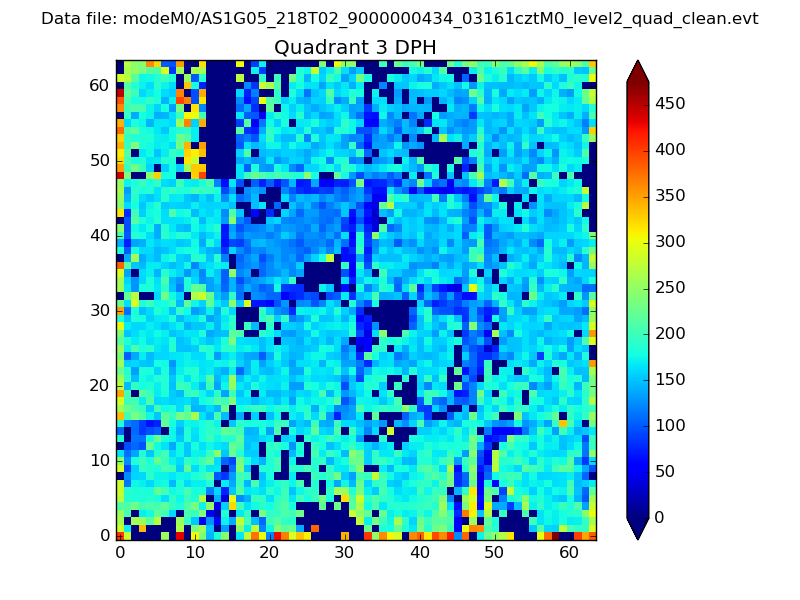 |
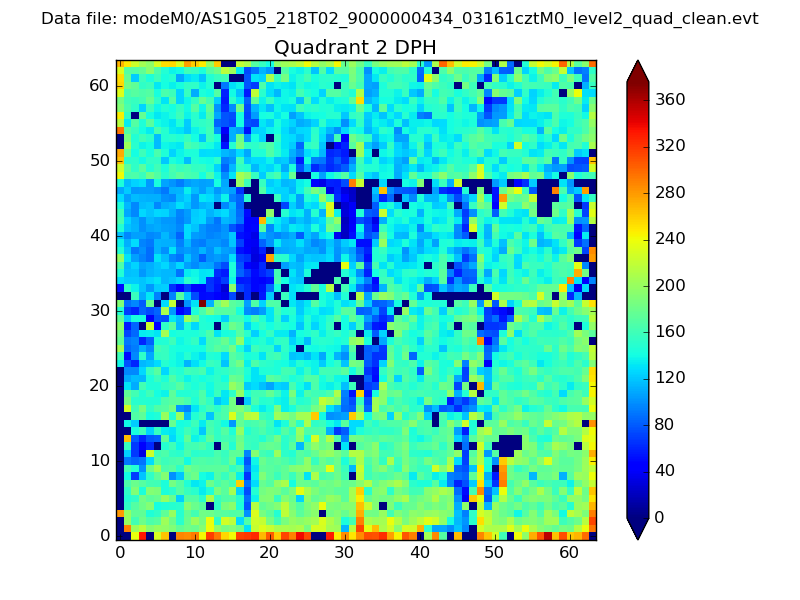 |
Quadrant C |
| Plot type | Count rate plots | Images |
|---|---|---|
| Comparison with Poisson distribution Blue bars denote a histogram of data divided into 1 sec bins. Red curve is a Poisson curve with rate = median count rate of data. |
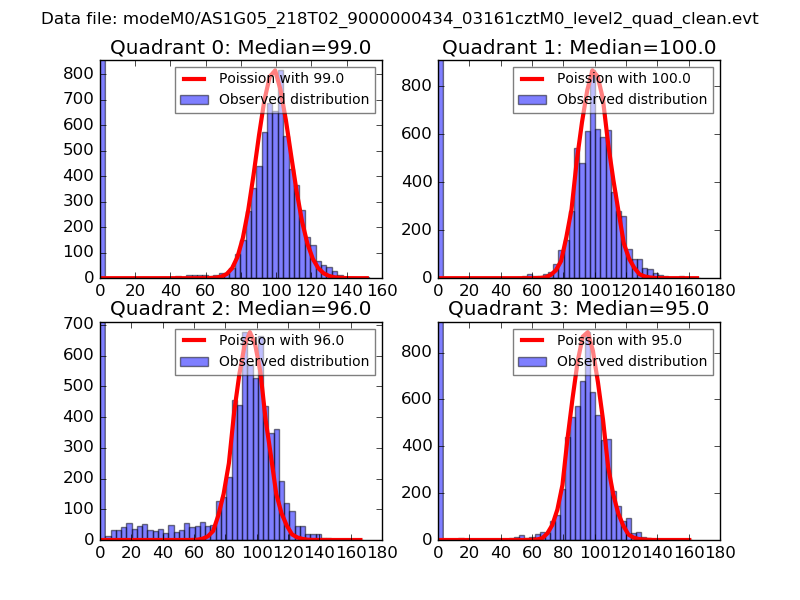 |
 |
| Quadrant-wise count rates Data is divided into 100 sec bins |
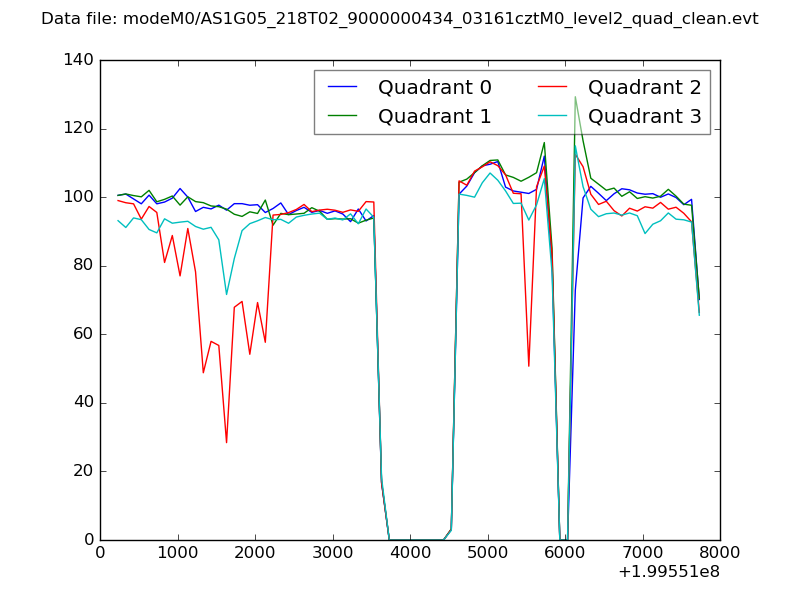 |
|
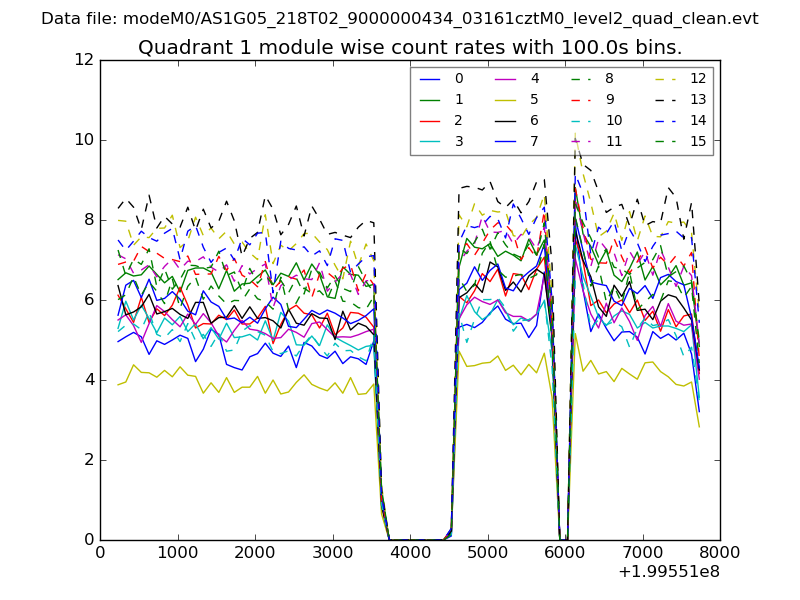
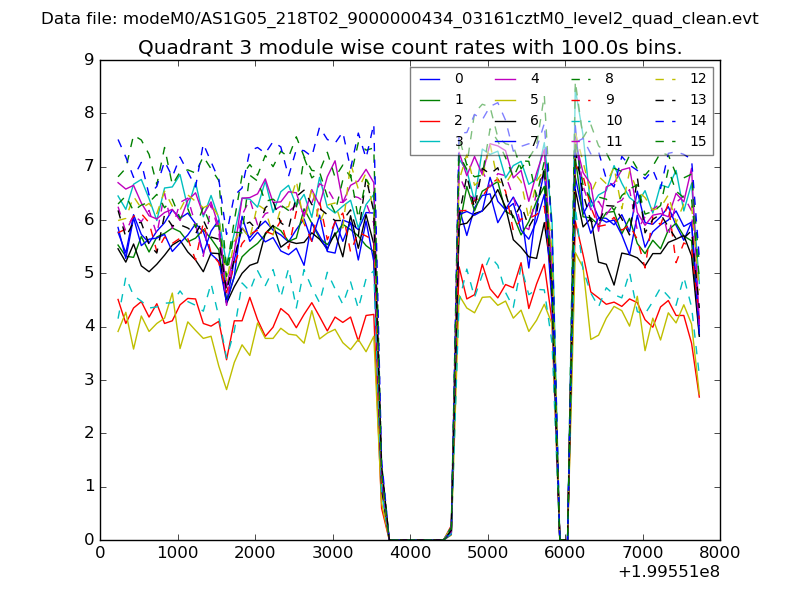
| Module-wise count rates for Quadrant A Data is divided into 100 sec bins |
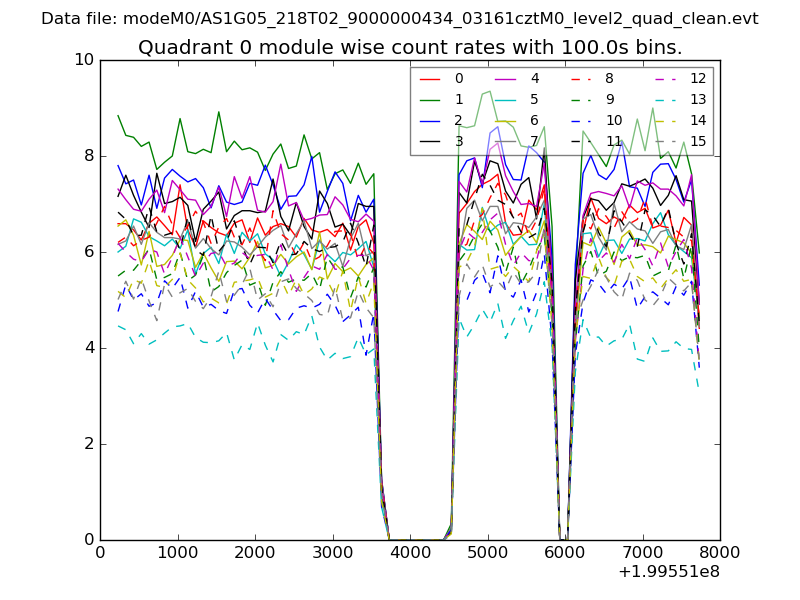 |
 |
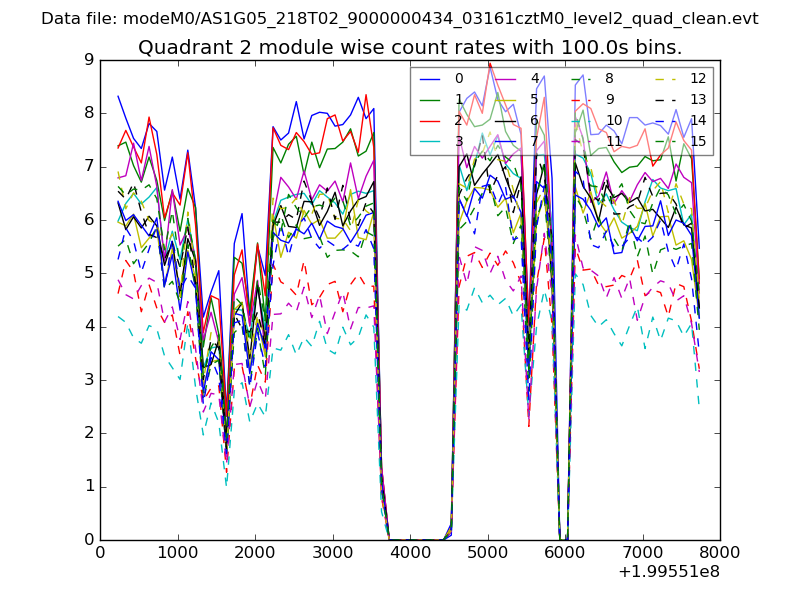
| Module-wise count rates for Quadrant B Data is divided into 100 sec bins |
 |
 |
| Module-wise count rates for Quadrant C Data is divided into 100 sec bins |
 |
 |
| Module-wise count rates for Quadrant D Data is divided into 100 sec bins |
 |
 |
| Parameter | Plot |
|---|---|
| CZT HV Monitor | 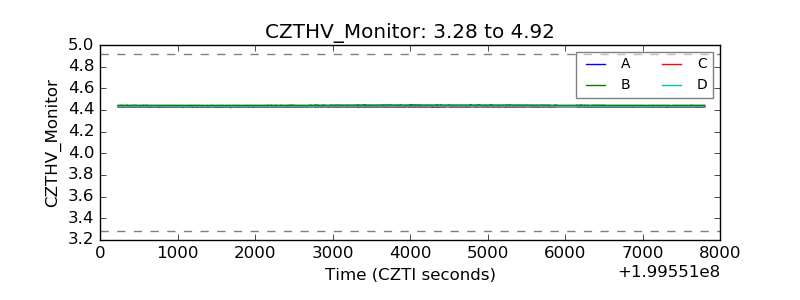 |
| D_VDD | 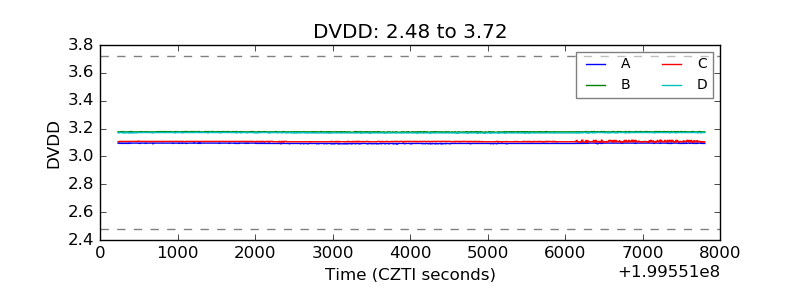 |
| Temperature 1 | 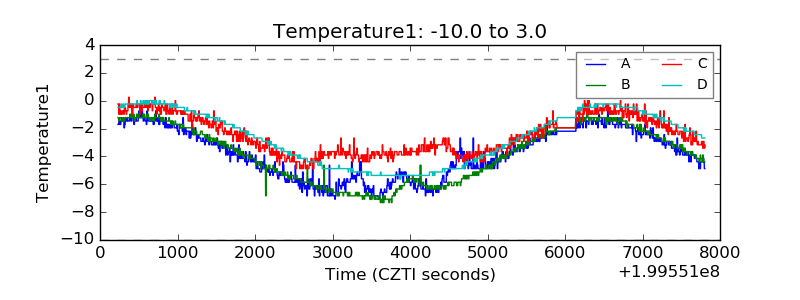 |
| Veto HV Monitor | 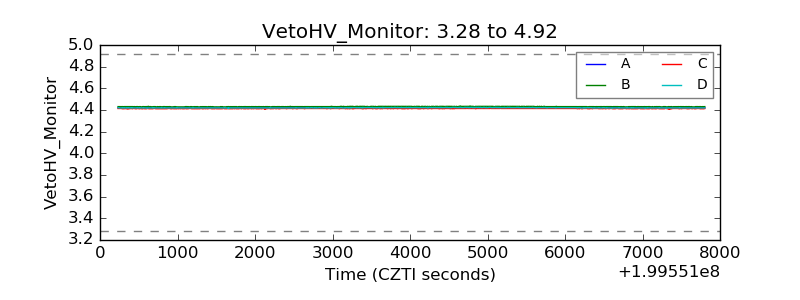 |
| Veto LLD | 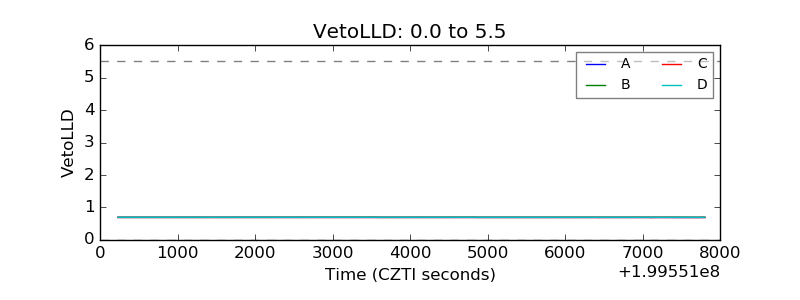 |
| Alpha Counter | 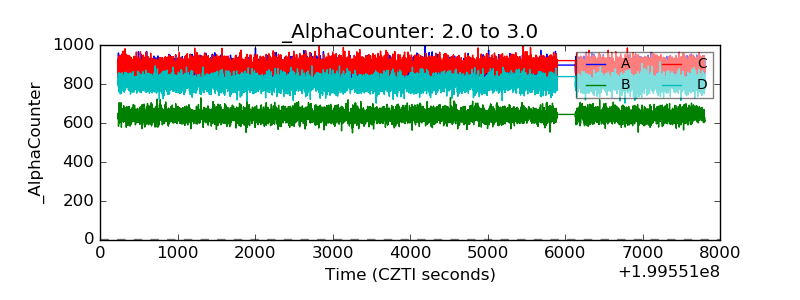 |
| _CPM_Rate | 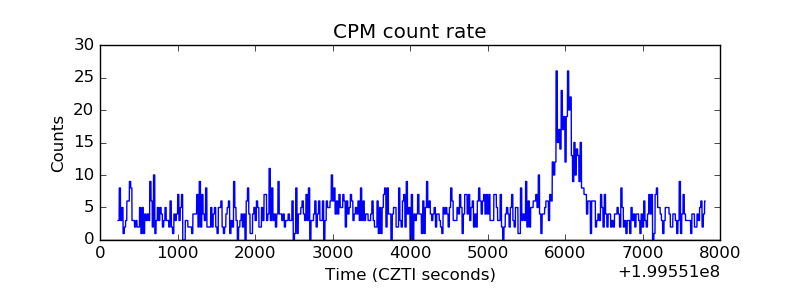 |
| CZT Counter | 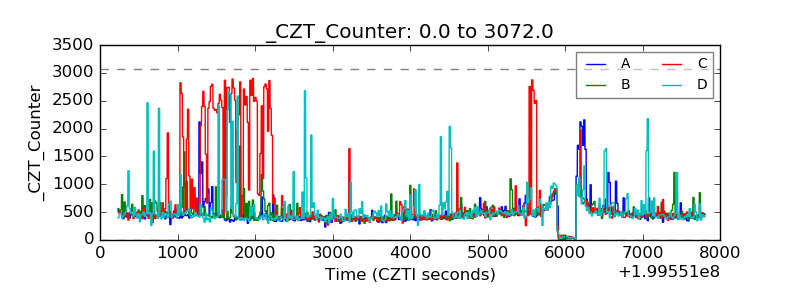 |
| +2.5 Volts monitor |  |
| +5 Volts monitor |  |
| _ROLL_ROT | 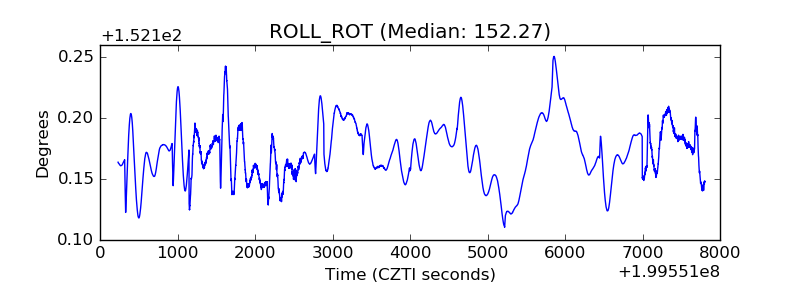 |
| _Roll_DEC | 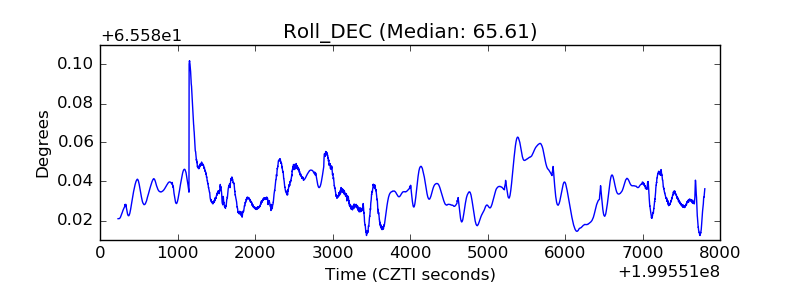 |
| _Roll_RA | 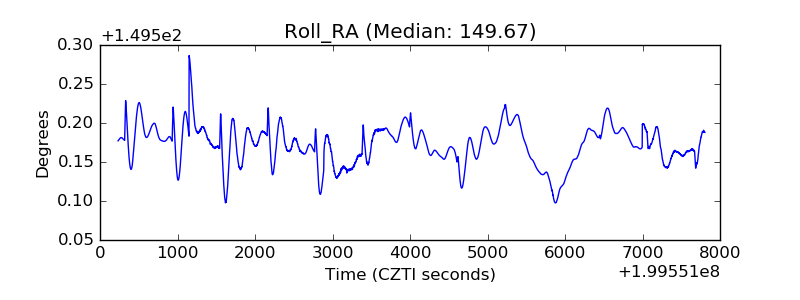 |
| Veto Counter | 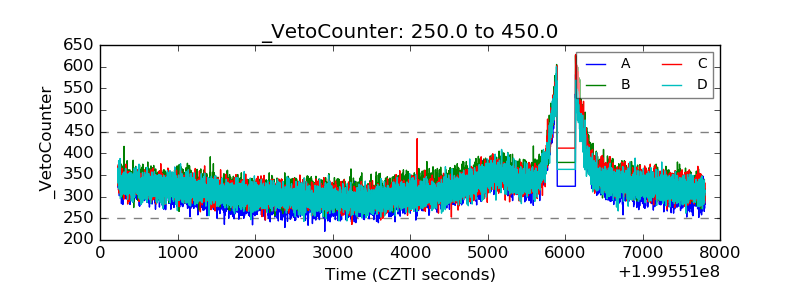 |