| Param | Original file | Final file |
|---|---|---|
| Filename | modeM0/AS1G05_218T02_9000000434_03163cztM0_level2.evt | modeM0/AS1G05_218T02_9000000434_03163cztM0_level2_quad_clean.evt |
| Size (bytes) | 870,065,280 | 173,528,640 |
| Size | 829.8 MB | 165.5 MB |
| Events in quadrant A | 5,944,360 | 1,102,196 |
| Events in quadrant B | 6,098,430 | 1,113,395 |
| Events in quadrant C | 6,715,971 | 1,082,868 |
| Events in quadrant D | 6,714,718 | 1,062,744 |
| Mode SS | |||
|---|---|---|---|
| Quadrant | BADHDUFLAG | Total packets | Discarded packets |
| A | 0 | 262 | 0 |
| B | 0 | 262 | 0 |
| C | 0 | 262 | 0 |
| D | 0 | 262 | 0 |
| Mode M0 | |||
|---|---|---|---|
| Quadrant | BADHDUFLAG | Total packets | Discarded packets |
| A | 0 | 27137 | 4 |
| B | 0 | 27207 | 3 |
| C | 0 | 29181 | 3 |
| D | 0 | 29431 | 3 |
| Mode M9 | |||
|---|---|---|---|
| Quadrant | BADHDUFLAG | Total packets | Discarded packets |
| A | 0 | 12 | 0 |
| B | 0 | 12 | 0 |
| C | 0 | 12 | 0 |
| D | 0 | 12 | 0 |
| Quadrant | Total seconds | Saturated seconds | Saturation percentage |
|---|---|---|---|
| A | 12943 | 152 | 1.174380% |
| B | 12943 | 99 | 0.764892% |
| C | 12943 | 308 | 2.379665% |
| D | 12944 | 223 | 1.722806% |
Noise dominated data is calculated using 1-second bins in cleaned event files. If a bin has >2000 counts, and if more than 50% of those come from <1% of pixels, then it is considered to be noise-dominated and hence unusable.
| Quadrant | # 1 sec bins | Bins with >0 counts | Bins with >2000 counts | High rate bins dominated by noise | Noise dominated (total time) | Noise dominated (detector-on time) | Marked lightcurve |
|---|---|---|---|---|---|---|---|
| A | 14148 | 12945 | 30 | 30 | 0.21% | 0.23% |  |
| B | 14148 | 12945 | 23 | 23 | 0.16% | 0.18% |  |
| C | 14148 | 12945 | 196 | 196 | 1.39% | 1.51% |  |
| D | 14149 | 12946 | 145 | 145 | 1.02% | 1.12% | 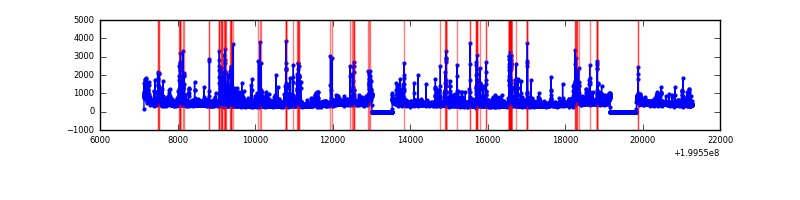 |
Top three noisy pixels from each quadrant. If the there are fewer than three noisy pixels in the level2.evt file, extra rows are filled as -1
| Pixel properties | Quadrant properties | ||||||
|---|---|---|---|---|---|---|---|
| Quadrant | DetID | PixID | Counts | Sigma | Mean | Median | Sigma |
| A | 0 | 199 | 220000 | 750.07 | 1432 | 1397 | 291.4 |
| A | 12 | 247 | 62373 | 209.22 | 1432 | 1397 | 291.4 |
| A | 0 | 226 | 38634 | 127.77 | 1432 | 1397 | 291.4 |
| B | 2 | 249 | 92045 | 322.04 | 1470 | 1432 | 281.4 |
| B | 14 | 167 | 72926 | 254.09 | 1470 | 1432 | 281.4 |
| B | 15 | 85 | 58466 | 202.7 | 1470 | 1432 | 281.4 |
| C | 14 | 223 | 611253 | 1876.84 | 1395 | 1400 | 324.9 |
| C | 15 | 208 | 402953 | 1235.79 | 1395 | 1400 | 324.9 |
| C | 1 | 16 | 87704 | 265.6 | 1395 | 1400 | 324.9 |
| D | 13 | 223 | 299238 | 884.45 | 1401 | 1358 | 336.8 |
| D | 2 | 136 | 278764 | 823.66 | 1401 | 1358 | 336.8 |
| D | 5 | 233 | 221385 | 653.29 | 1401 | 1358 | 336.8 |
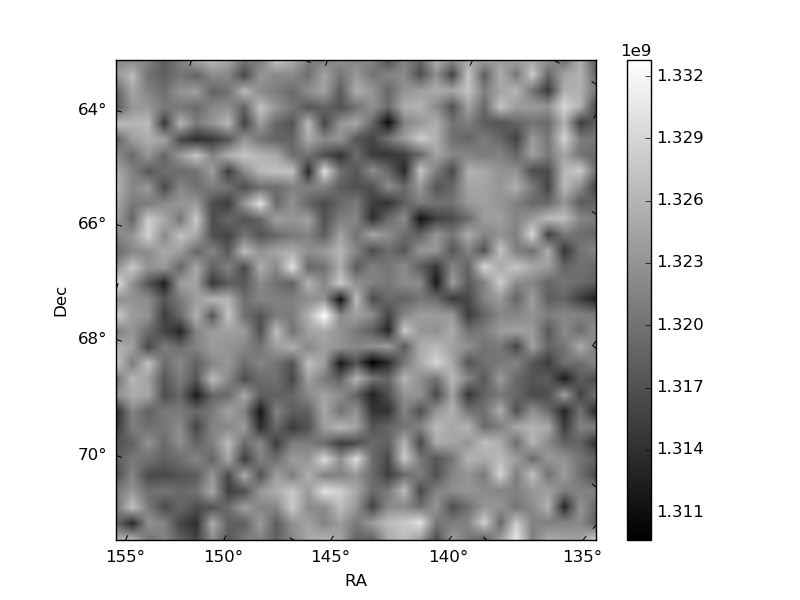
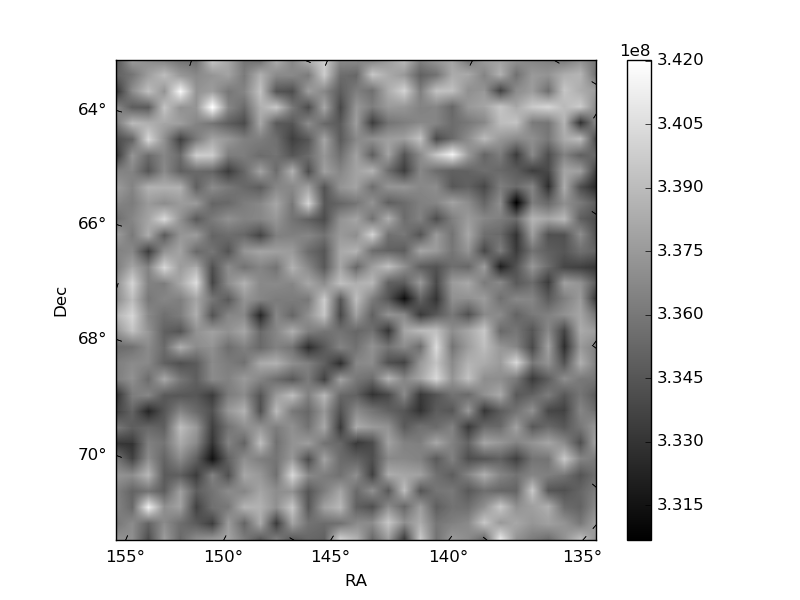
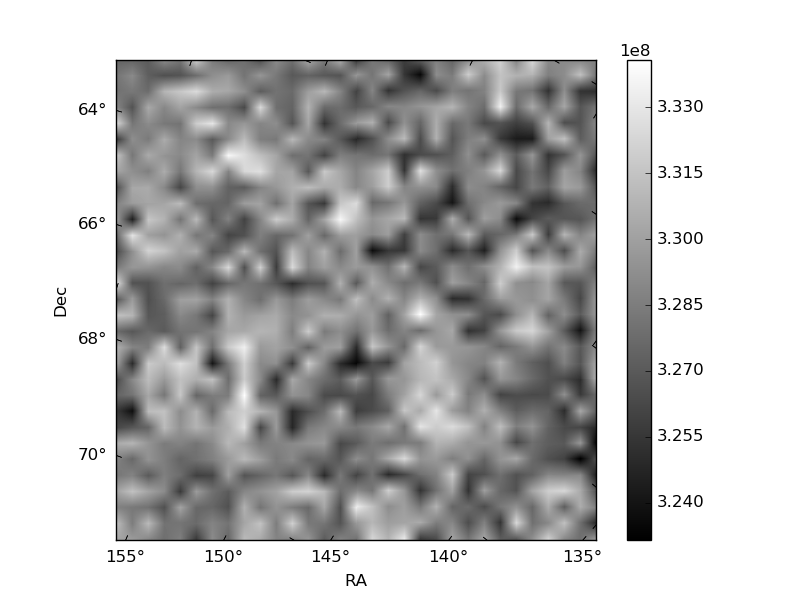
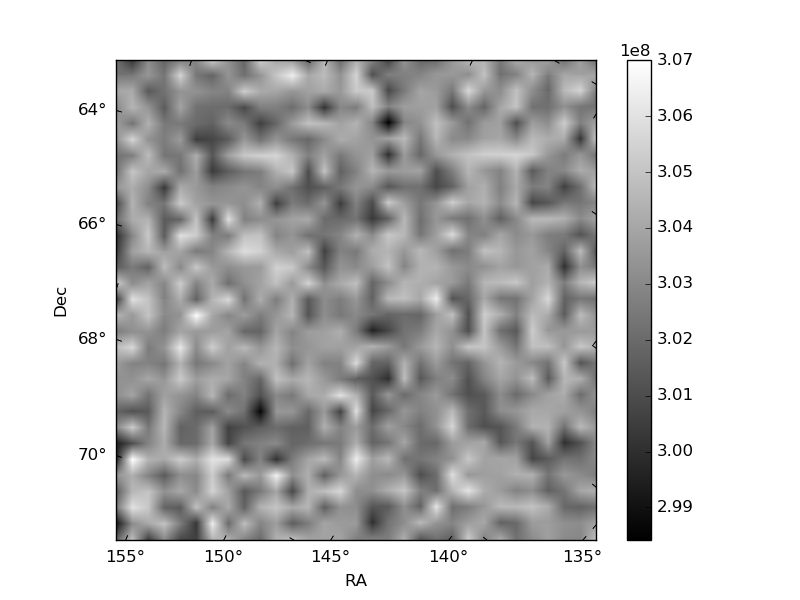
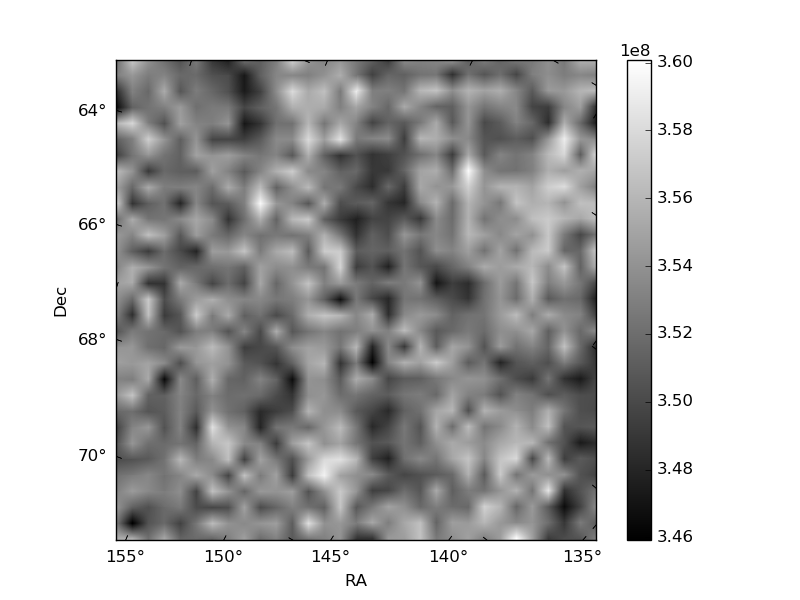
Histogram calculated using DETX and DETY for each event in the final _common_clean file
| Quadrant A | 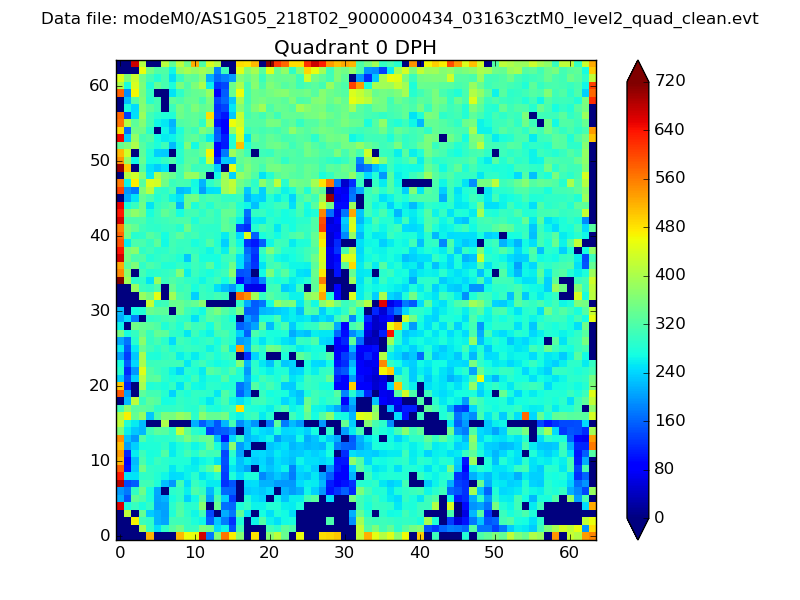 |
 |
Quadrant B |
|---|---|---|---|
| Quadrant D | 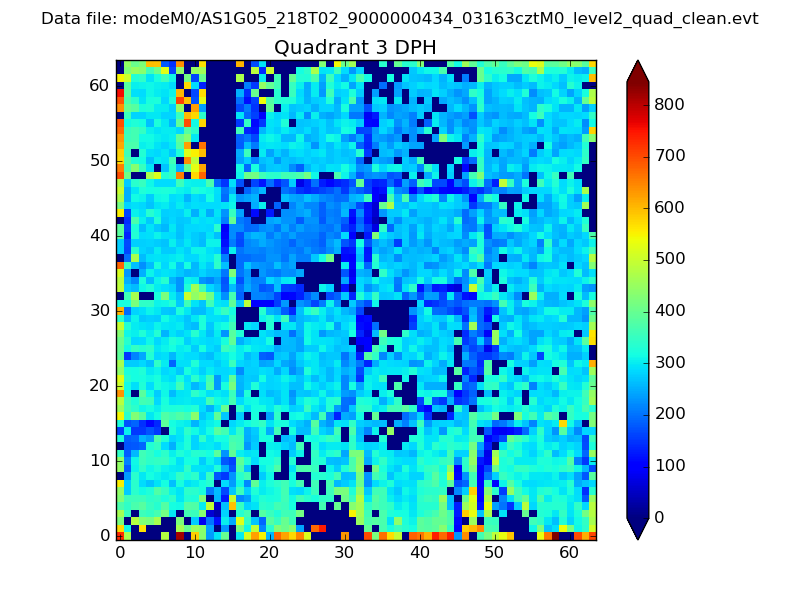 |
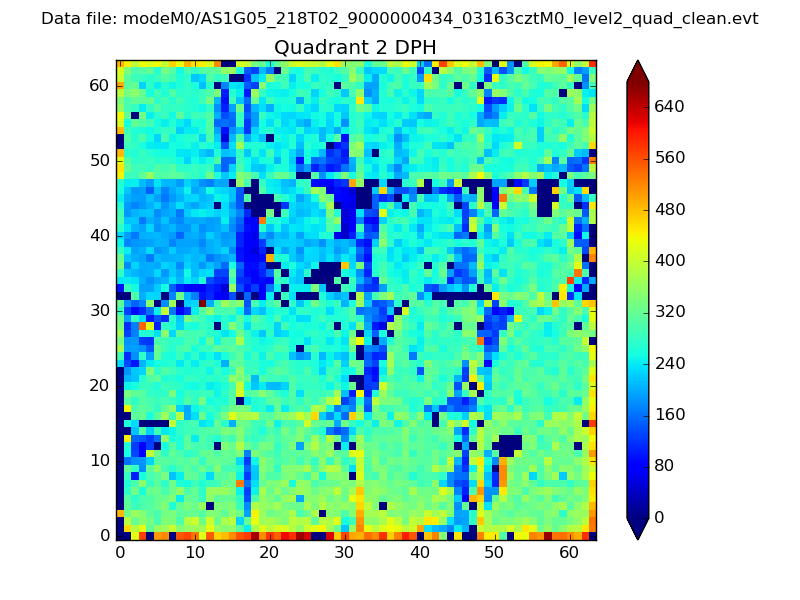 |
Quadrant C |
| Plot type | Count rate plots | Images |
|---|---|---|
| Comparison with Poisson distribution Blue bars denote a histogram of data divided into 1 sec bins. Red curve is a Poisson curve with rate = median count rate of data. |
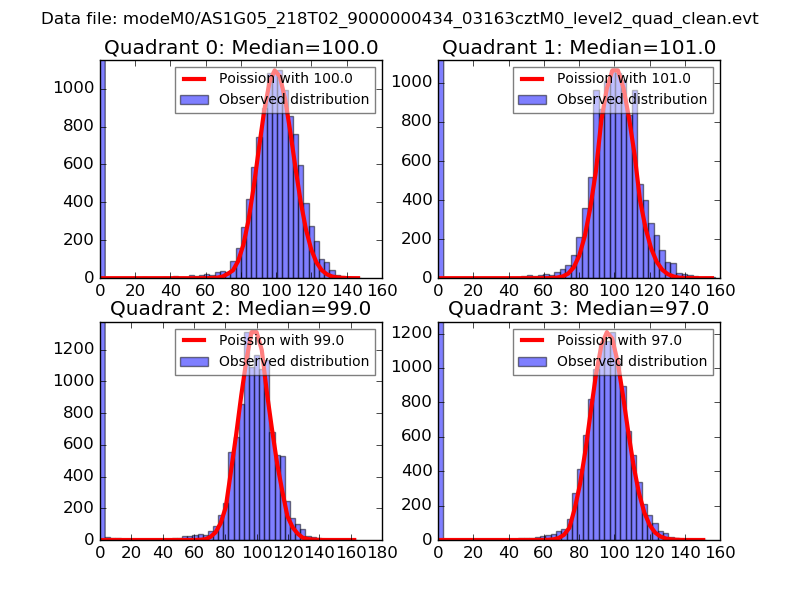 |
 |
| Quadrant-wise count rates Data is divided into 100 sec bins |
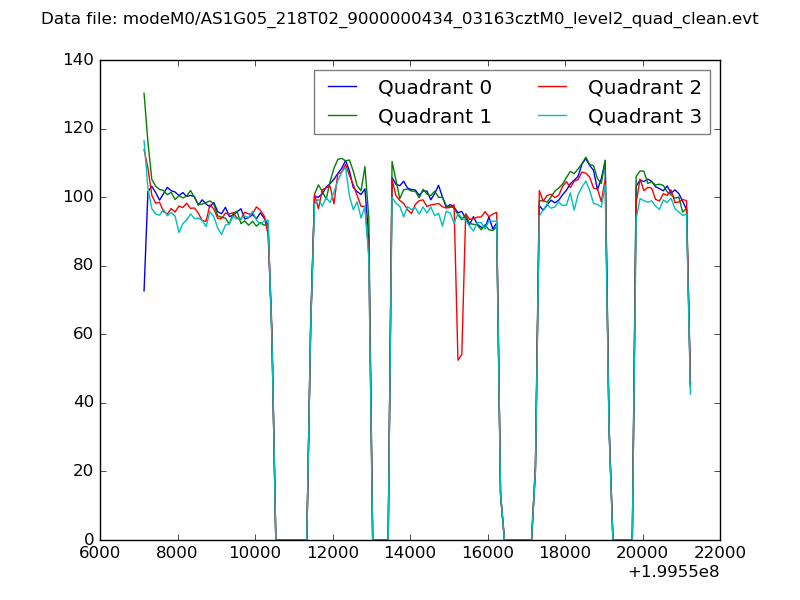 |
|
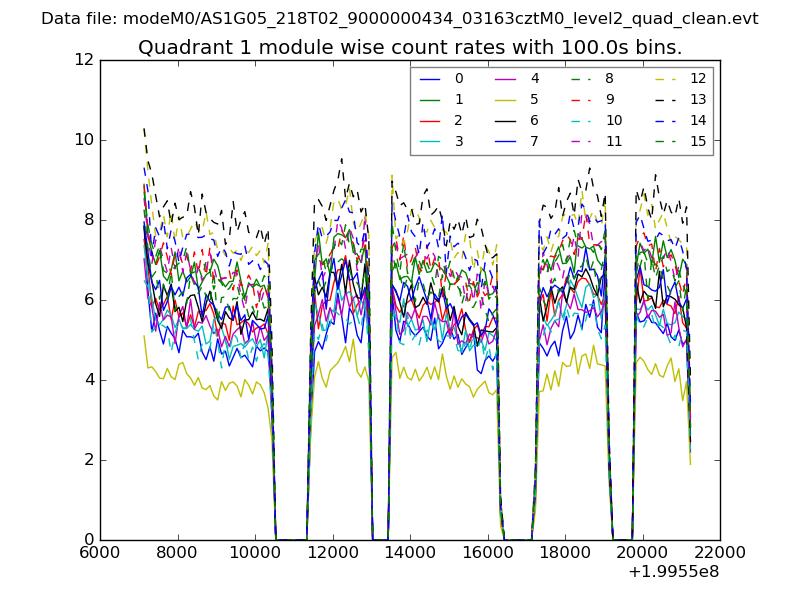
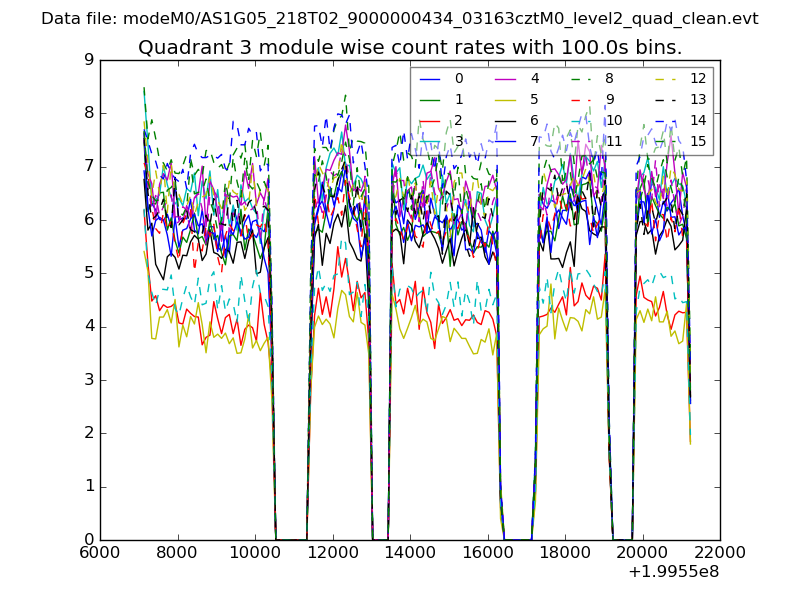
| Module-wise count rates for Quadrant A Data is divided into 100 sec bins |
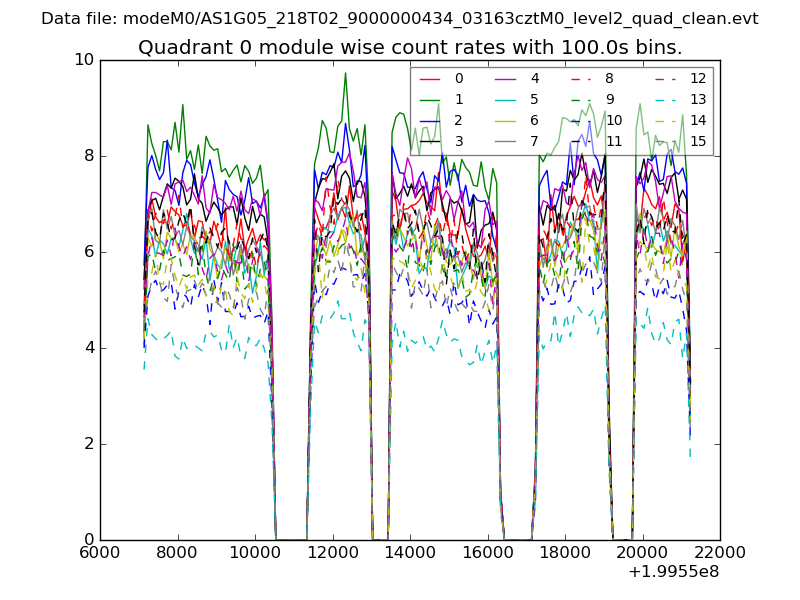 |
 |
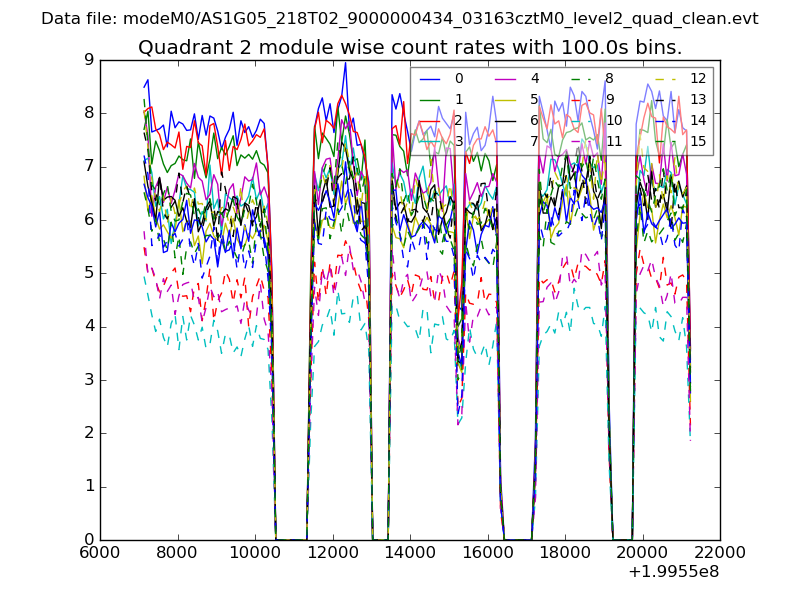
| Module-wise count rates for Quadrant B Data is divided into 100 sec bins |
 |
 |
| Module-wise count rates for Quadrant C Data is divided into 100 sec bins |
 |
 |
| Module-wise count rates for Quadrant D Data is divided into 100 sec bins |
 |
 |
| Parameter | Plot |
|---|---|
| CZT HV Monitor | 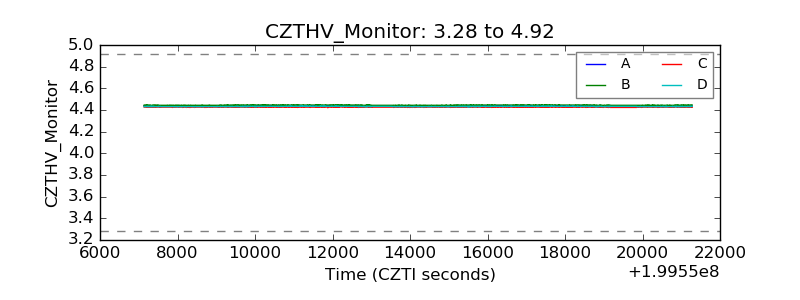 |
| D_VDD | 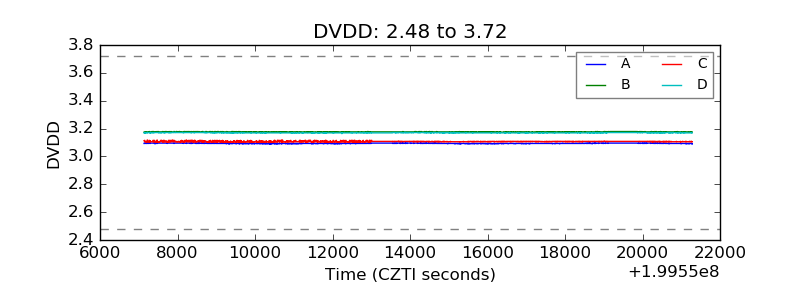 |
| Temperature 1 | 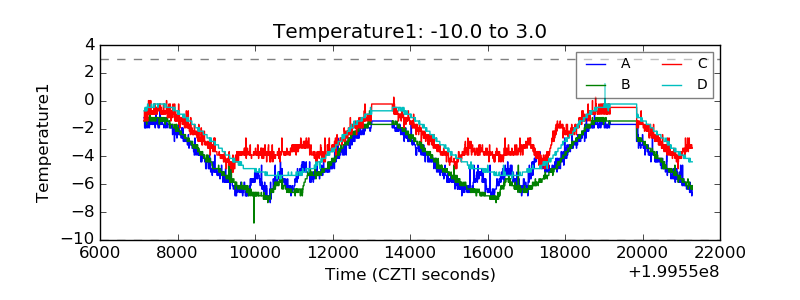 |
| Veto HV Monitor | 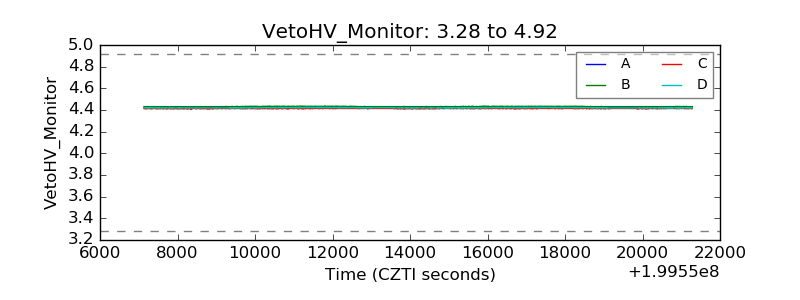 |
| Veto LLD | 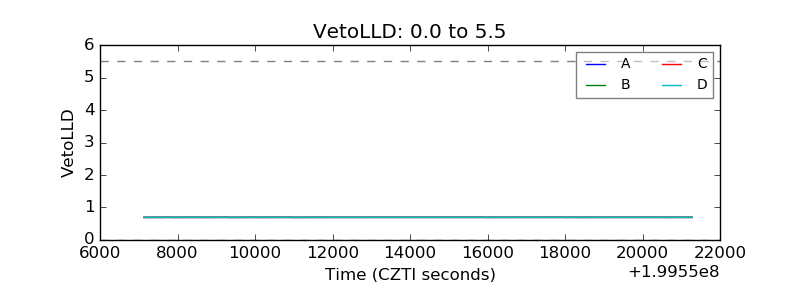 |
| Alpha Counter | 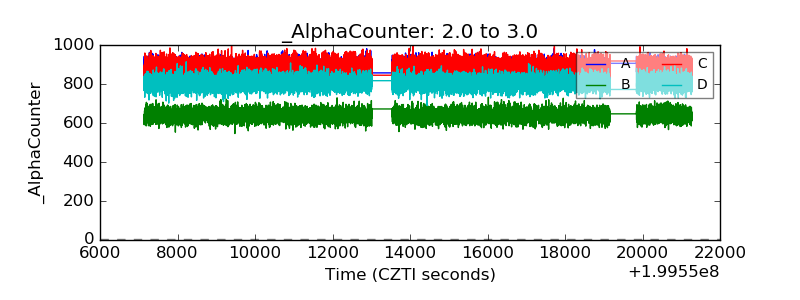 |
| _CPM_Rate | 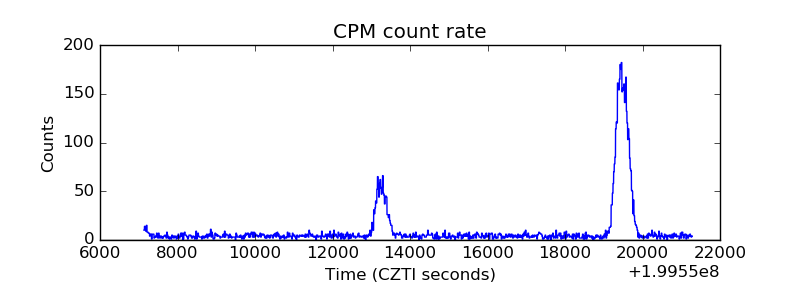 |
| CZT Counter | 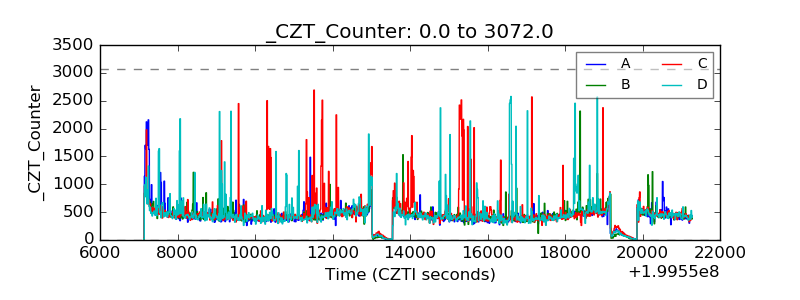 |
| +2.5 Volts monitor |  |
| +5 Volts monitor |  |
| _ROLL_ROT | 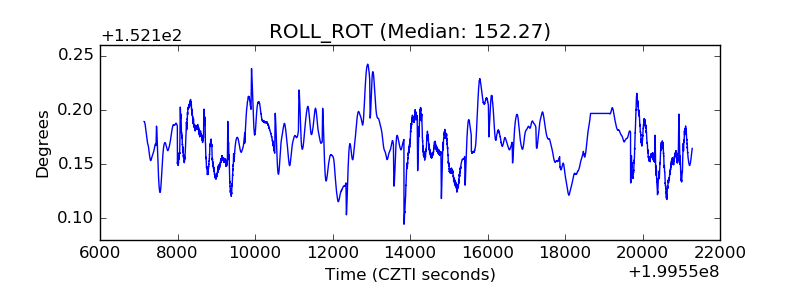 |
| _Roll_DEC | 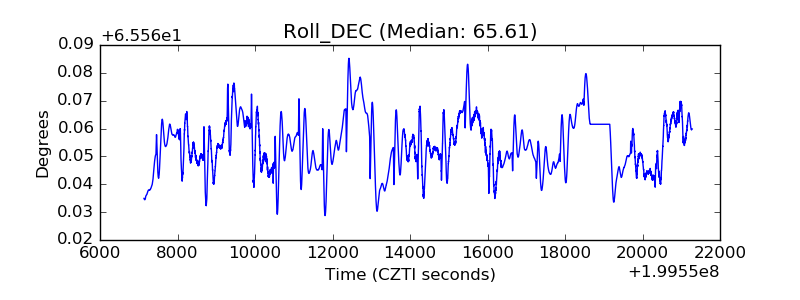 |
| _Roll_RA | 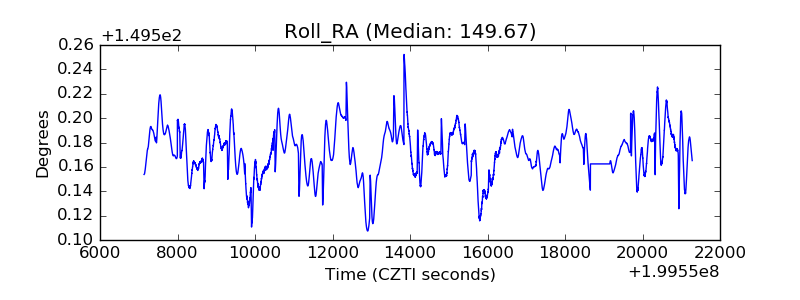 |
| Veto Counter | 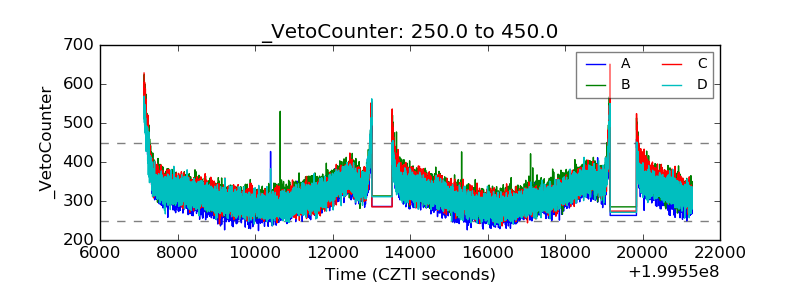 |