| Param | Original file | Final file |
|---|---|---|
| Filename | modeM0/AS1G05_218T02_9000000434_03164cztM0_level2.evt | modeM0/AS1G05_218T02_9000000434_03164cztM0_level2_quad_clean.evt |
| Size (bytes) | 431,556,480 | 93,839,040 |
| Size | 411.6 MB | 89.5 MB |
| Events in quadrant A | 2,992,889 | 595,786 |
| Events in quadrant B | 3,183,976 | 601,474 |
| Events in quadrant C | 3,057,098 | 593,632 |
| Events in quadrant D | 3,370,349 | 574,274 |
| Mode SS | |||
|---|---|---|---|
| Quadrant | BADHDUFLAG | Total packets | Discarded packets |
| A | 0 | 140 | 0 |
| B | 0 | 140 | 0 |
| C | 0 | 140 | 0 |
| D | 0 | 140 | 0 |
| Mode M0 | |||
|---|---|---|---|
| Quadrant | BADHDUFLAG | Total packets | Discarded packets |
| A | 0 | 13981 | 3 |
| B | 0 | 14151 | 2 |
| C | 0 | 14002 | 2 |
| D | 0 | 15073 | 2 |
| Mode M9 | |||
|---|---|---|---|
| Quadrant | BADHDUFLAG | Total packets | Discarded packets |
| A | 0 | 16 | 0 |
| B | 0 | 16 | 0 |
| C | 0 | 16 | 0 |
| D | 0 | 16 | 0 |
| Quadrant | Total seconds | Saturated seconds | Saturation percentage |
|---|---|---|---|
| A | 6843 | 19 | 0.277656% |
| B | 6843 | 37 | 0.540699% |
| C | 6843 | 30 | 0.438404% |
| D | 6843 | 73 | 1.066784% |
Noise dominated data is calculated using 1-second bins in cleaned event files. If a bin has >2000 counts, and if more than 50% of those come from <1% of pixels, then it is considered to be noise-dominated and hence unusable.
| Quadrant | # 1 sec bins | Bins with >0 counts | Bins with >2000 counts | High rate bins dominated by noise | Noise dominated (total time) | Noise dominated (detector-on time) | Marked lightcurve |
|---|---|---|---|---|---|---|---|
| A | 8373 | 6845 | 1 | 1 | 0.01% | 0.01% | 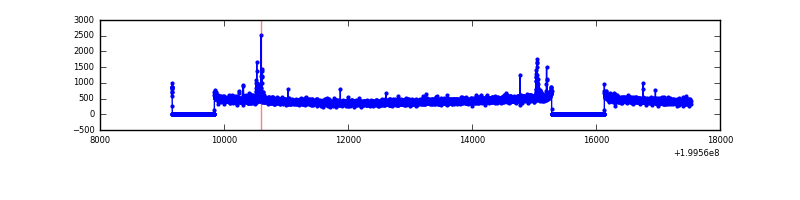 |
| B | 8373 | 6845 | 7 | 7 | 0.08% | 0.10% | 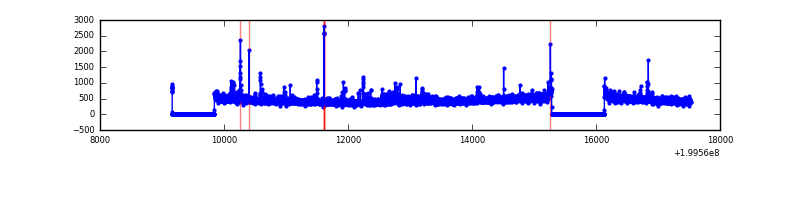 |
| C | 8373 | 6845 | 8 | 8 | 0.10% | 0.12% | 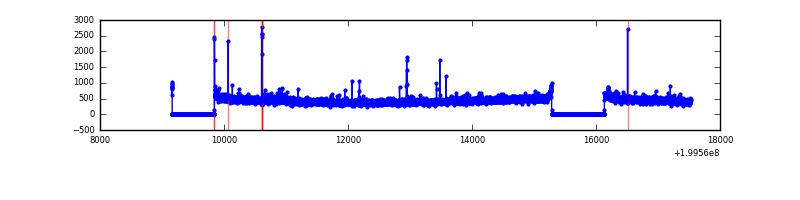 |
| D | 8373 | 6845 | 47 | 47 | 0.56% | 0.69% | 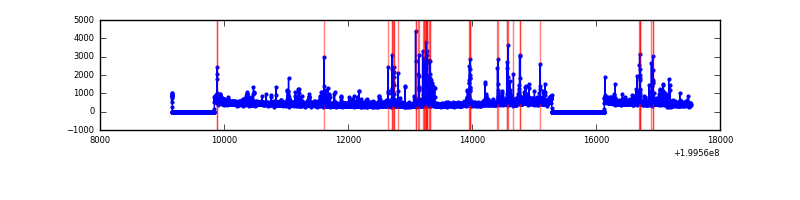 |
Top three noisy pixels from each quadrant. If the there are fewer than three noisy pixels in the level2.evt file, extra rows are filled as -1
| Pixel properties | Quadrant properties | ||||||
|---|---|---|---|---|---|---|---|
| Quadrant | DetID | PixID | Counts | Sigma | Mean | Median | Sigma |
| A | 12 | 247 | 54295 | 343.32 | 755 | 738 | 156.0 |
| A | 8 | 15 | 18006 | 110.69 | 755 | 738 | 156.0 |
| A | 12 | 194 | 8297 | 48.46 | 755 | 738 | 156.0 |
| B | 5 | 70 | 67377 | 446.49 | 773 | 754 | 149.2 |
| B | 2 | 249 | 27588 | 179.83 | 773 | 754 | 149.2 |
| B | 0 | 219 | 26420 | 172.01 | 773 | 754 | 149.2 |
| C | 1 | 192 | 38243 | 214.73 | 745 | 748 | 174.6 |
| C | 1 | 16 | 36896 | 207.01 | 745 | 748 | 174.6 |
| C | 6 | 80 | 22702 | 125.73 | 745 | 748 | 174.6 |
| D | 5 | 233 | 130026 | 720.4 | 736 | 712 | 179.5 |
| D | 13 | 239 | 128691 | 712.96 | 736 | 712 | 179.5 |
| D | 13 | 223 | 109132 | 604.0 | 736 | 712 | 179.5 |
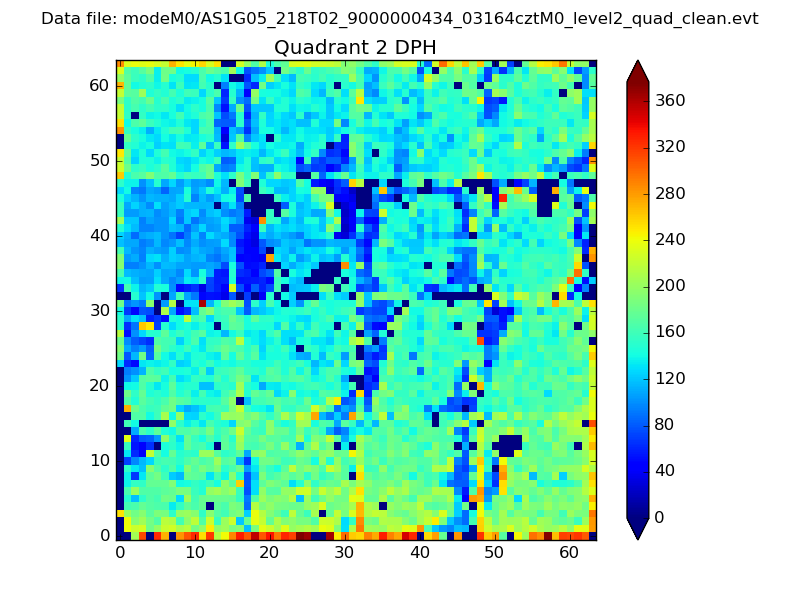
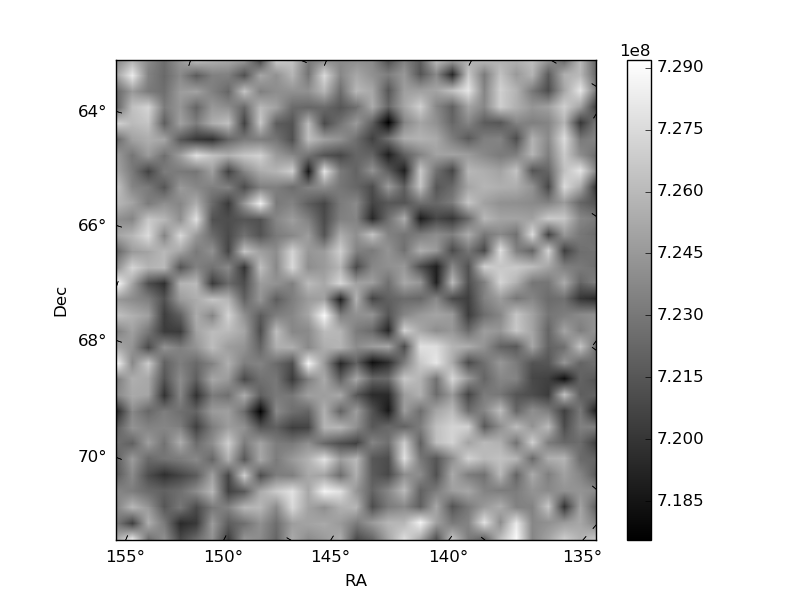
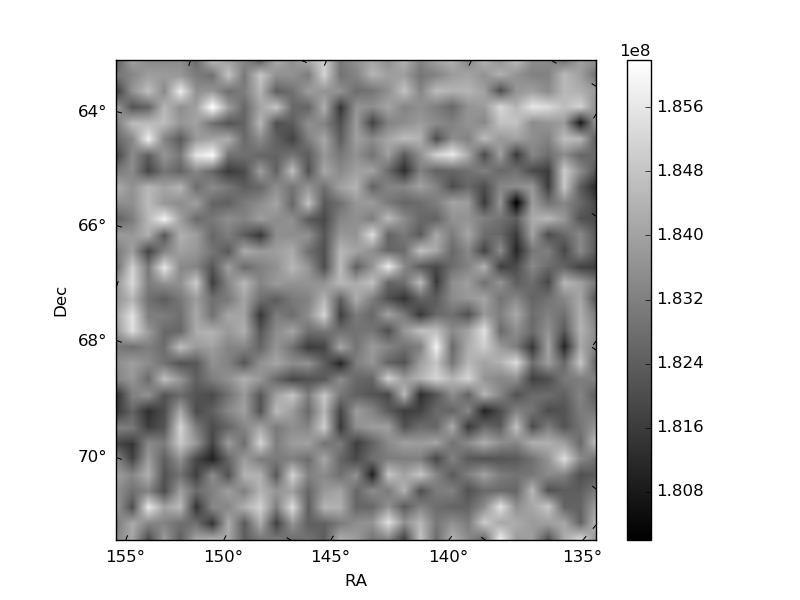
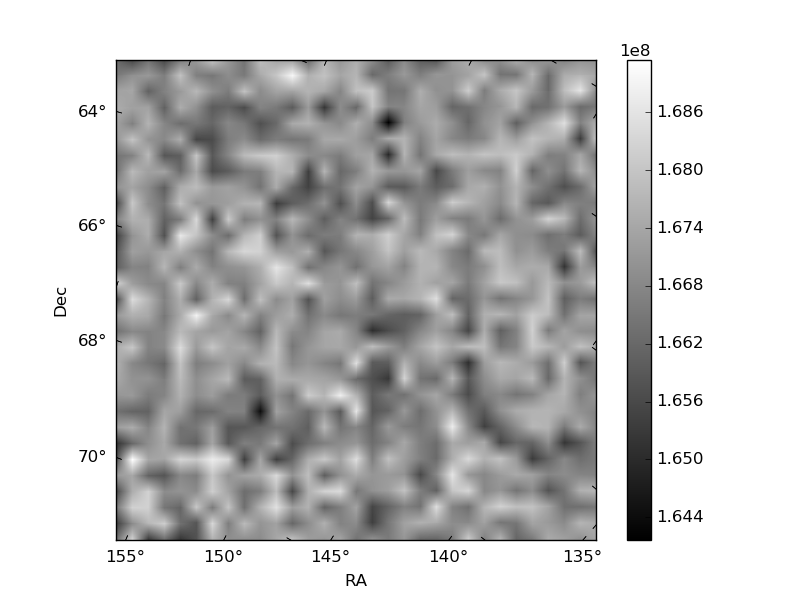
Histogram calculated using DETX and DETY for each event in the final _common_clean file
| Quadrant A | 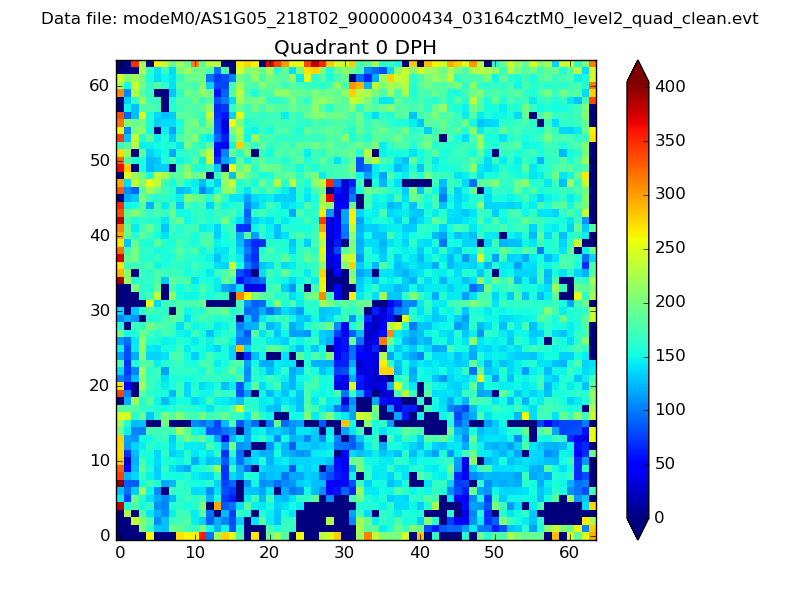 |
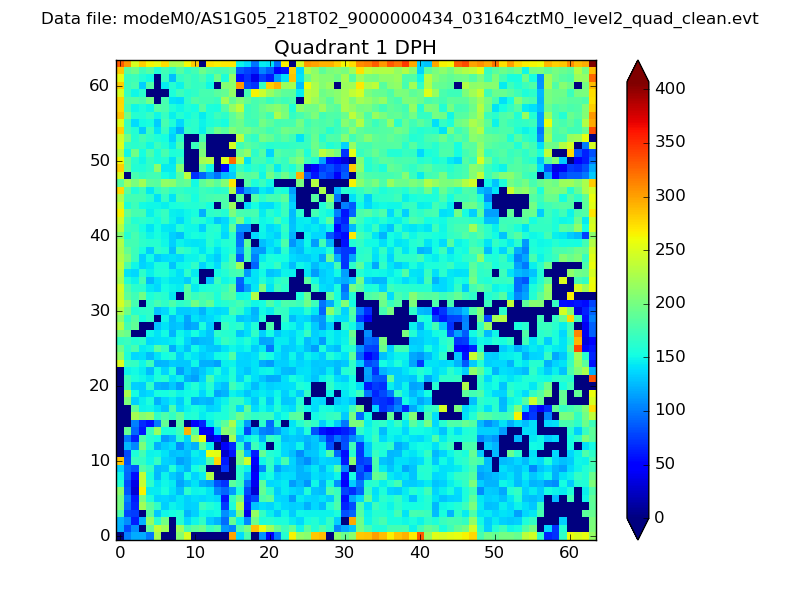 |
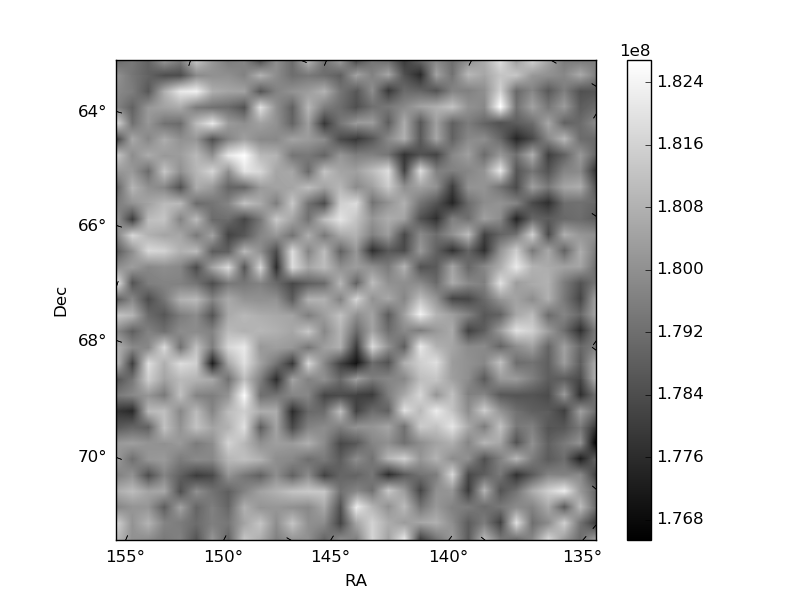
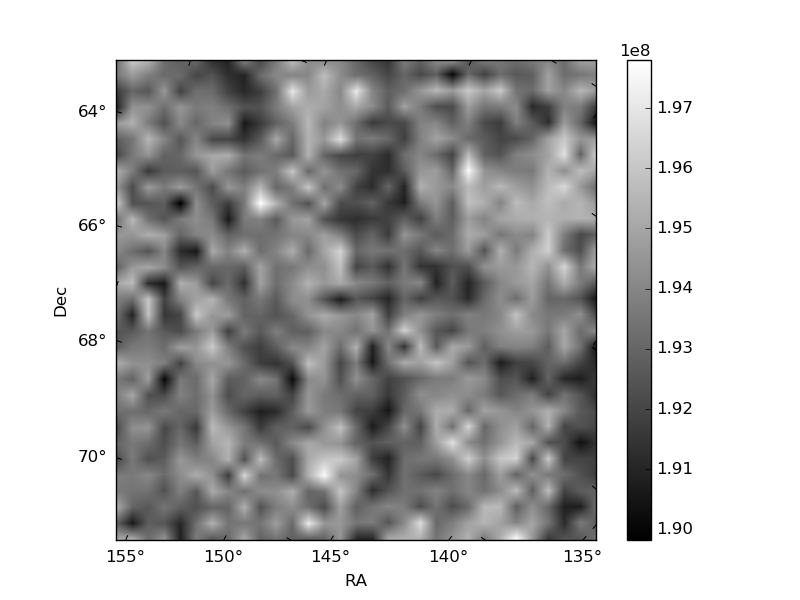
Quadrant B |
|---|---|---|---|
| Quadrant D | 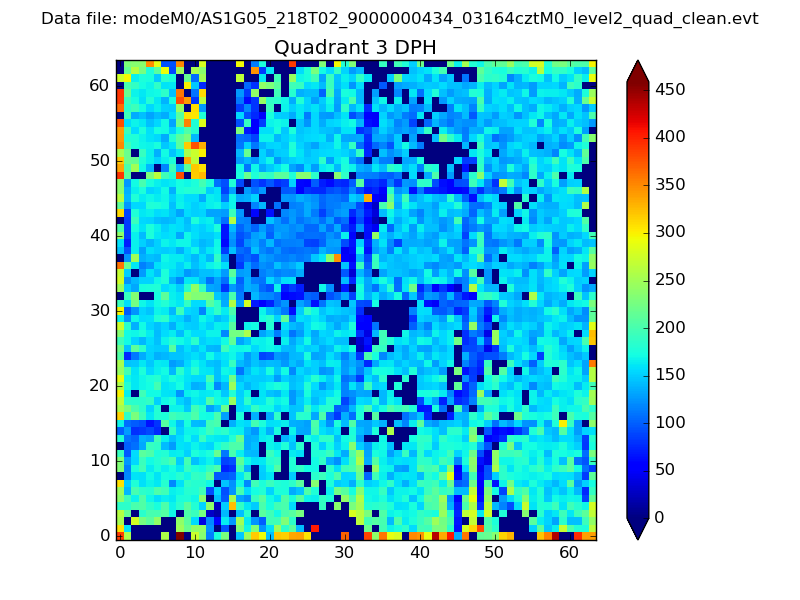 |
 |
Quadrant C |
| Plot type | Count rate plots | Images |
|---|---|---|
| Comparison with Poisson distribution Blue bars denote a histogram of data divided into 1 sec bins. Red curve is a Poisson curve with rate = median count rate of data. |
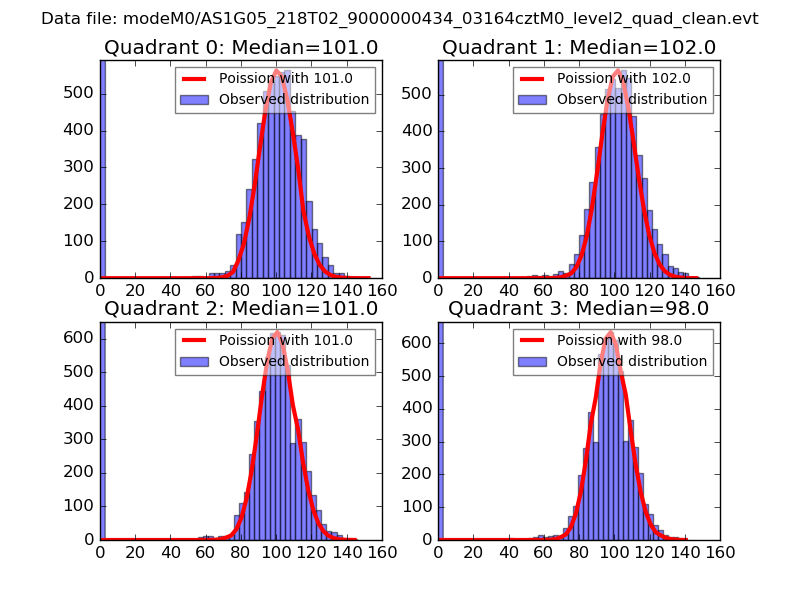 |
 |
| Quadrant-wise count rates Data is divided into 100 sec bins |
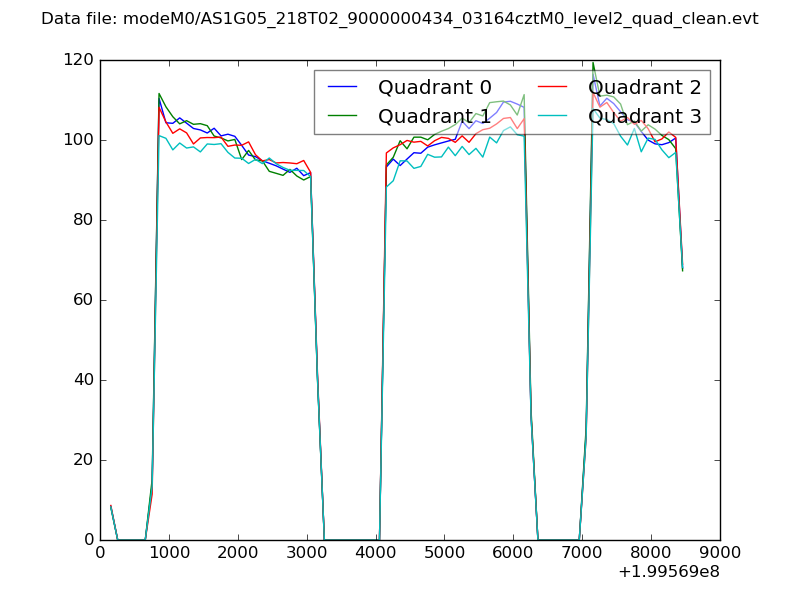 |
|
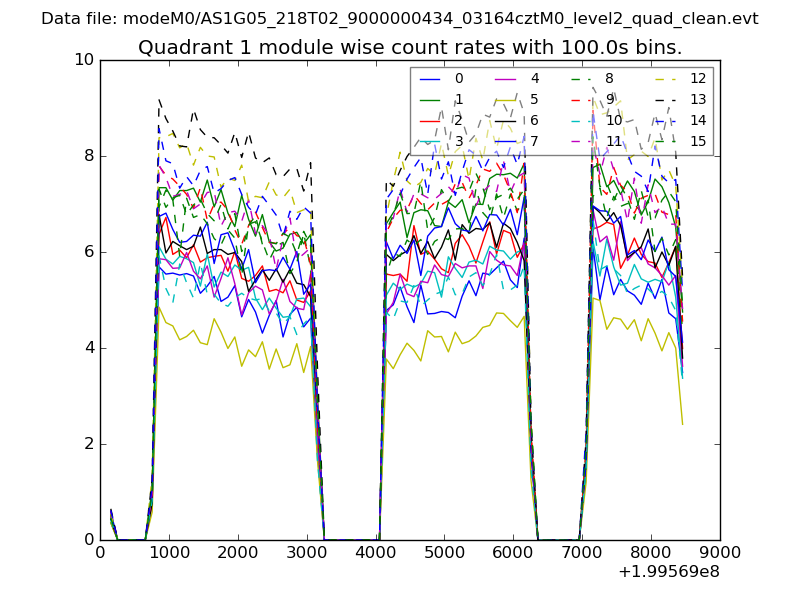
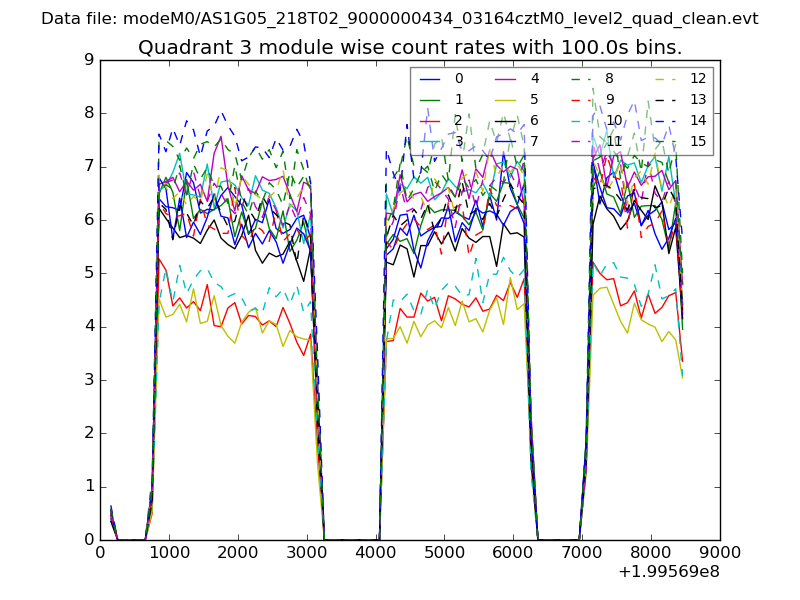
| Module-wise count rates for Quadrant A Data is divided into 100 sec bins |
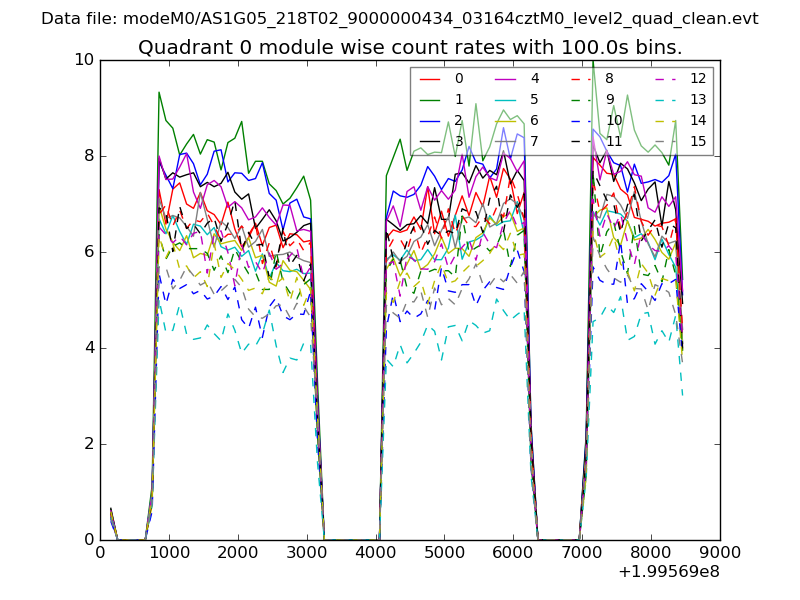 |
 |
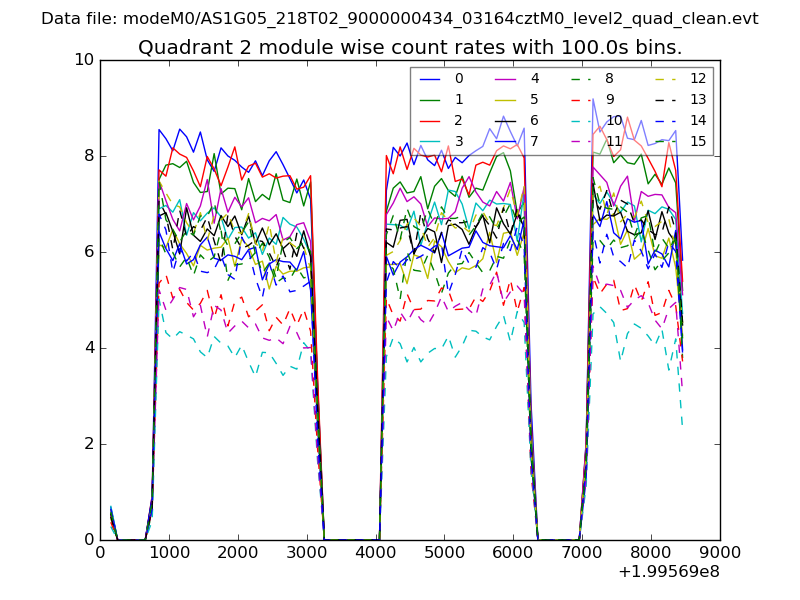
| Module-wise count rates for Quadrant B Data is divided into 100 sec bins |
 |
 |
| Module-wise count rates for Quadrant C Data is divided into 100 sec bins |
 |
 |
| Module-wise count rates for Quadrant D Data is divided into 100 sec bins |
 |
 |
| Parameter | Plot |
|---|---|
| CZT HV Monitor | 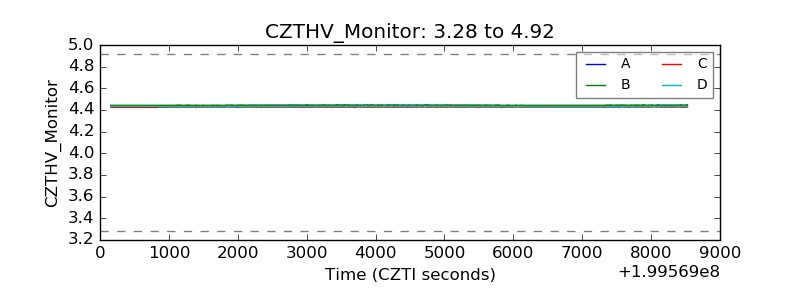 |
| D_VDD | 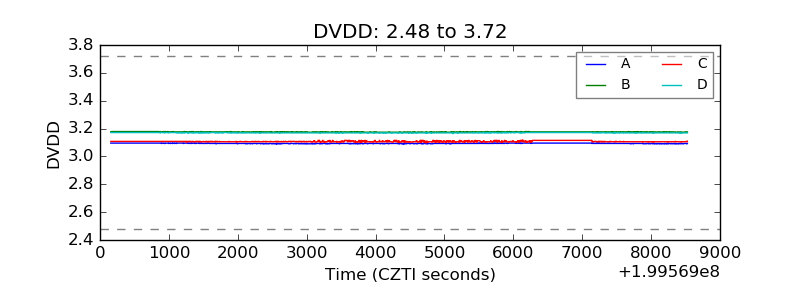 |
| Temperature 1 | 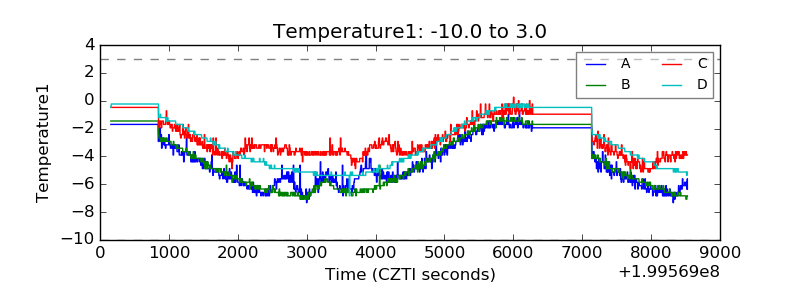 |
| Veto HV Monitor | 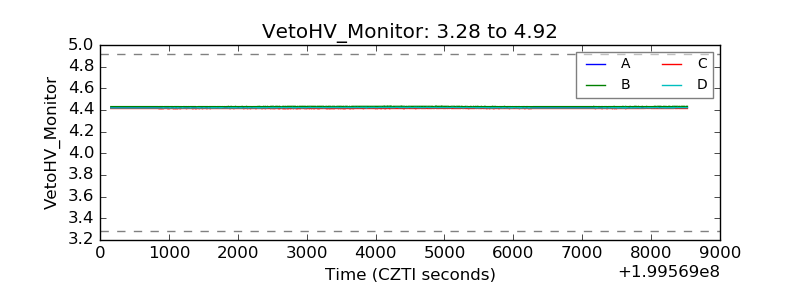 |
| Veto LLD | 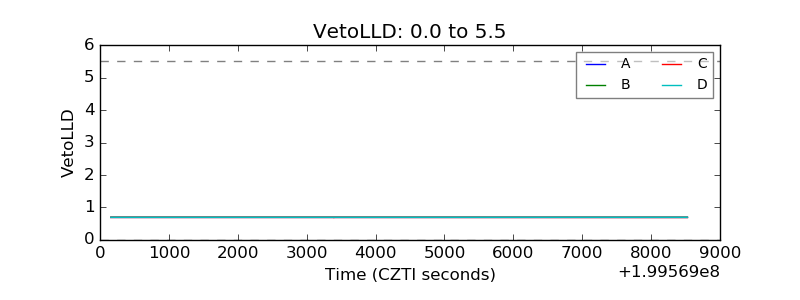 |
| Alpha Counter | 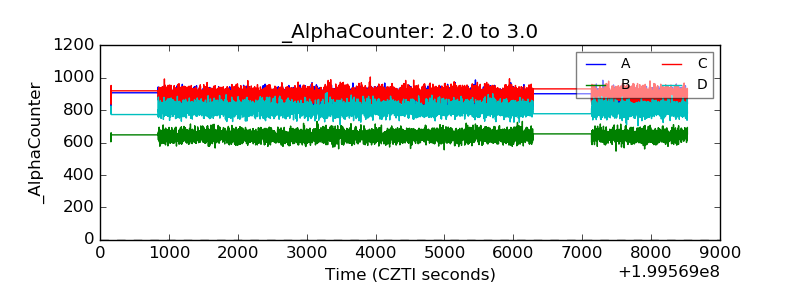 |
| _CPM_Rate | 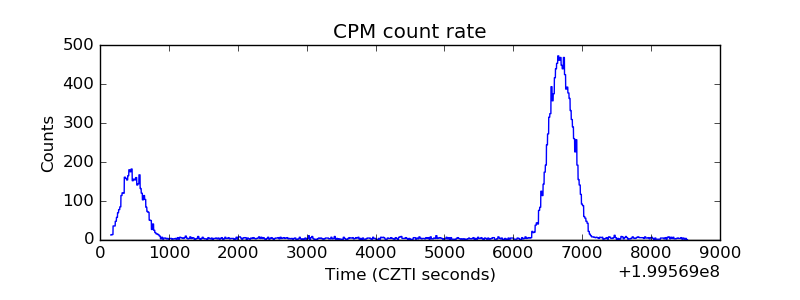 |
| CZT Counter | 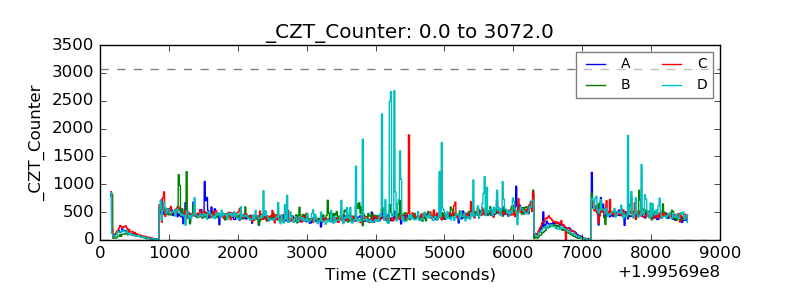 |
| +2.5 Volts monitor |  |
| +5 Volts monitor |  |
| _ROLL_ROT | 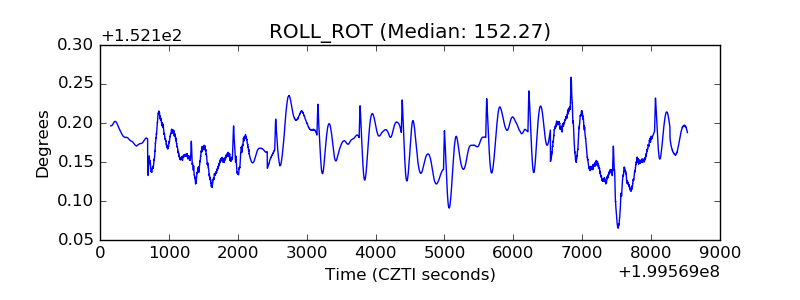 |
| _Roll_DEC |  |
| _Roll_RA | 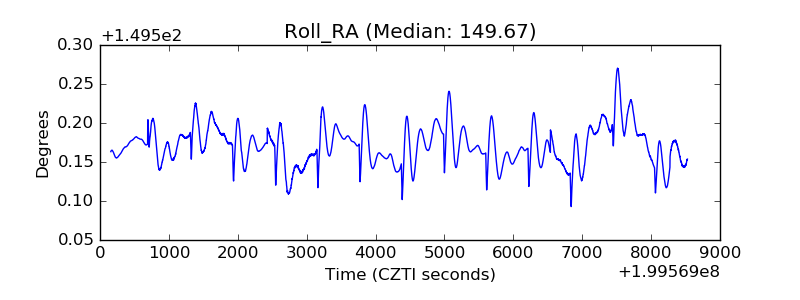 |
| Veto Counter | 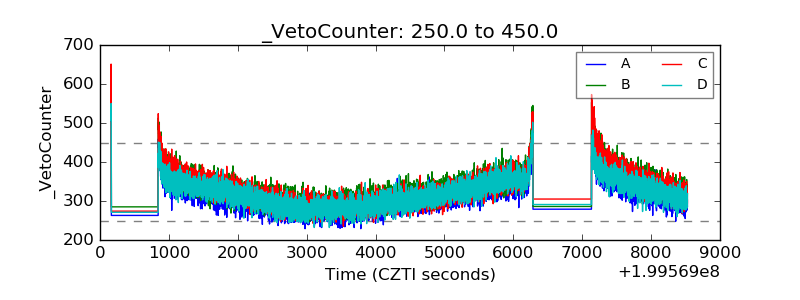 |