| Param | Original file | Final file |
|---|---|---|
| Filename | modeM0/AS1G05_218T02_9000000434_03167cztM0_level2.evt | modeM0/AS1G05_218T02_9000000434_03167cztM0_level2_quad_clean.evt |
| Size (bytes) | 845,032,320 | 156,620,160 |
| Size | 805.9 MB | 149.4 MB |
| Events in quadrant A | 5,338,764 | 991,944 |
| Events in quadrant B | 5,431,517 | 1,012,236 |
| Events in quadrant C | 7,912,680 | 959,989 |
| Events in quadrant D | 6,098,088 | 951,082 |
| Mode SS | |||
|---|---|---|---|
| Quadrant | BADHDUFLAG | Total packets | Discarded packets |
| A | 0 | 242 | 0 |
| B | 0 | 242 | 0 |
| C | 0 | 242 | 0 |
| D | 0 | 242 | 0 |
| Mode M0 | |||
|---|---|---|---|
| Quadrant | BADHDUFLAG | Total packets | Discarded packets |
| A | 0 | 24698 | 0 |
| B | 0 | 24659 | 0 |
| C | 0 | 32196 | 0 |
| D | 0 | 26963 | 0 |
| Mode M9 | |||
|---|---|---|---|
| Quadrant | BADHDUFLAG | Total packets | Discarded packets |
| A | 0 | 29 | 0 |
| B | 0 | 29 | 0 |
| C | 0 | 29 | 0 |
| D | 0 | 30 | 0 |
| Quadrant | Total seconds | Saturated seconds | Saturation percentage |
|---|---|---|---|
| A | 11977 | 68 | 0.567755% |
| B | 11977 | 47 | 0.392419% |
| C | 11977 | 741 | 6.186858% |
| D | 11977 | 137 | 1.143859% |
Noise dominated data is calculated using 1-second bins in cleaned event files. If a bin has >2000 counts, and if more than 50% of those come from <1% of pixels, then it is considered to be noise-dominated and hence unusable.
| Quadrant | # 1 sec bins | Bins with >0 counts | Bins with >2000 counts | High rate bins dominated by noise | Noise dominated (total time) | Noise dominated (detector-on time) | Marked lightcurve |
|---|---|---|---|---|---|---|---|
| A | 14132 | 11979 | 30 | 30 | 0.21% | 0.25% | 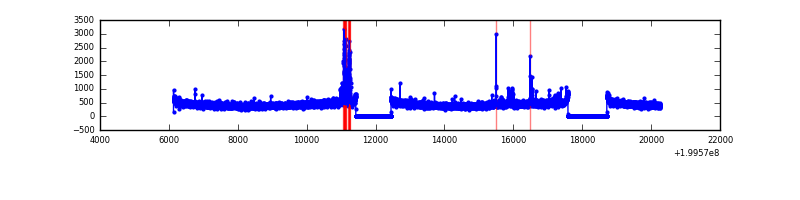 |
| B | 14132 | 11979 | 5 | 5 | 0.04% | 0.04% | 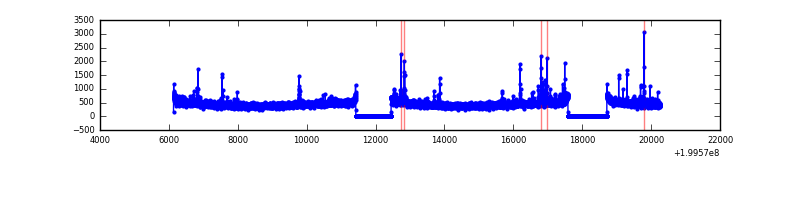 |
| C | 14132 | 11978 | 643 | 643 | 4.55% | 5.37% |  |
| D | 14132 | 11979 | 91 | 91 | 0.64% | 0.76% | 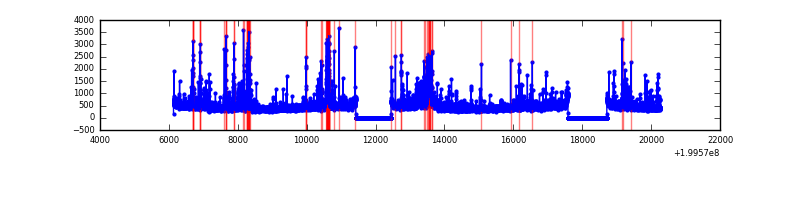 |
Top three noisy pixels from each quadrant. If the there are fewer than three noisy pixels in the level2.evt file, extra rows are filled as -1
| Pixel properties | Quadrant properties | ||||||
|---|---|---|---|---|---|---|---|
| Quadrant | DetID | PixID | Counts | Sigma | Mean | Median | Sigma |
| A | 12 | 247 | 133801 | 494.64 | 1320 | 1292 | 267.9 |
| A | 8 | 15 | 44054 | 159.63 | 1320 | 1292 | 267.9 |
| A | 14 | 238 | 37171 | 133.93 | 1320 | 1292 | 267.9 |
| B | 2 | 249 | 72754 | 278.24 | 1357 | 1327 | 256.7 |
| B | 0 | 219 | 31749 | 118.51 | 1357 | 1327 | 256.7 |
| B | 15 | 85 | 22416 | 82.15 | 1357 | 1327 | 256.7 |
| C | 14 | 223 | 2664223 | 9024.57 | 1268 | 1272 | 295.1 |
| C | 1 | 192 | 130048 | 436.41 | 1268 | 1272 | 295.1 |
| C | 6 | 80 | 81024 | 270.27 | 1268 | 1272 | 295.1 |
| D | 2 | 136 | 408451 | 1321.68 | 1277 | 1237 | 308.1 |
| D | 5 | 233 | 189576 | 611.29 | 1277 | 1237 | 308.1 |
| D | 13 | 223 | 188572 | 608.03 | 1277 | 1237 | 308.1 |
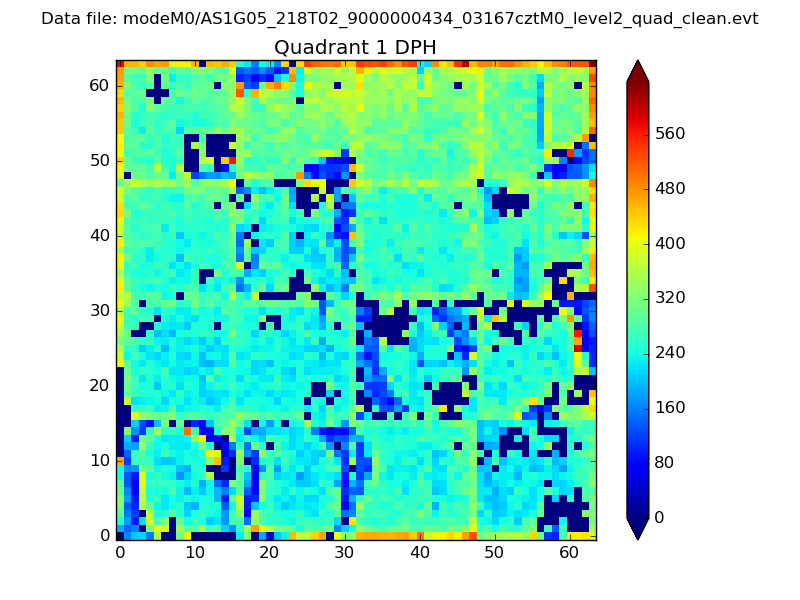
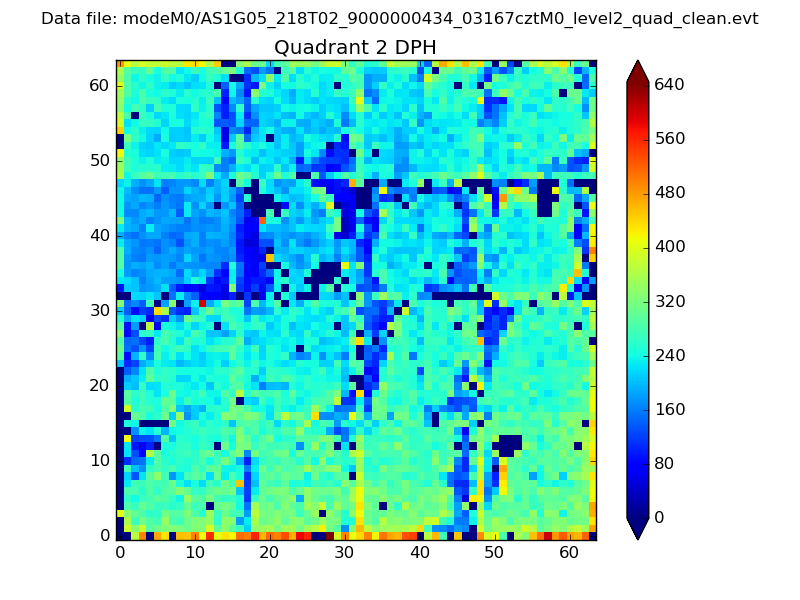
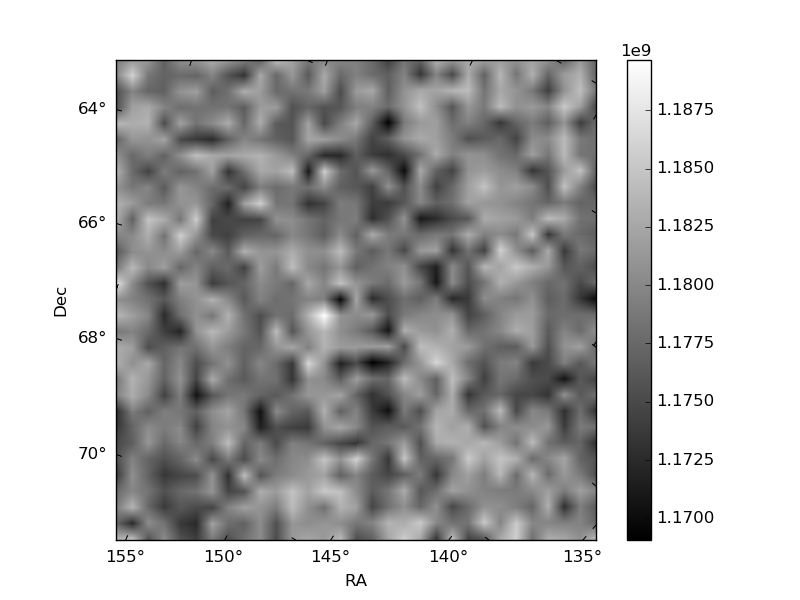
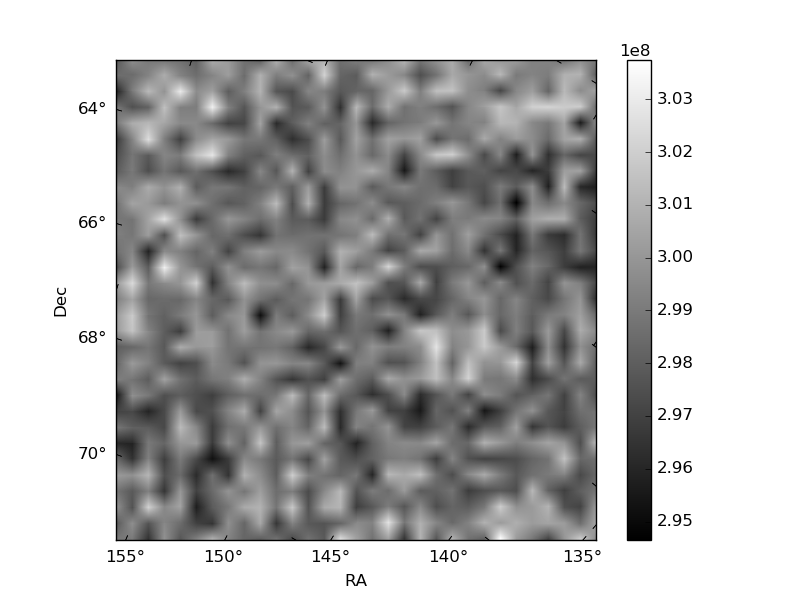
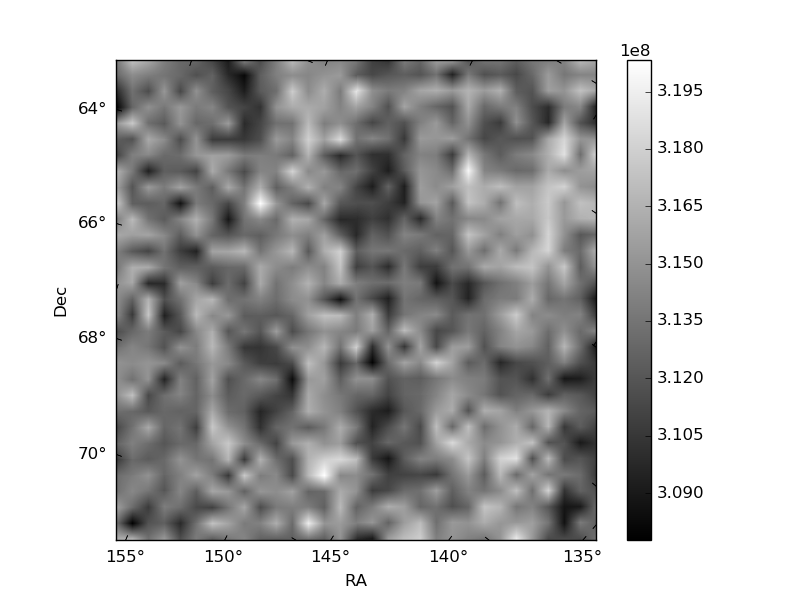
Histogram calculated using DETX and DETY for each event in the final _common_clean file
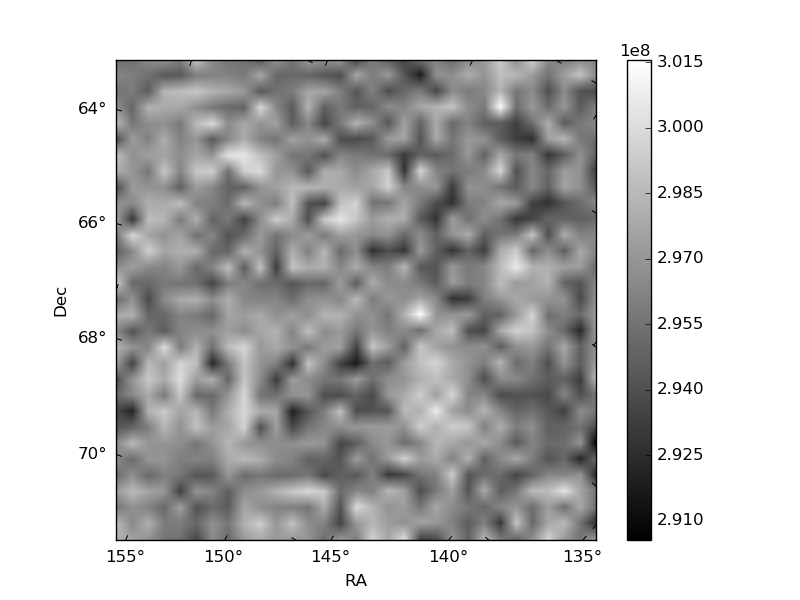
| Quadrant A | 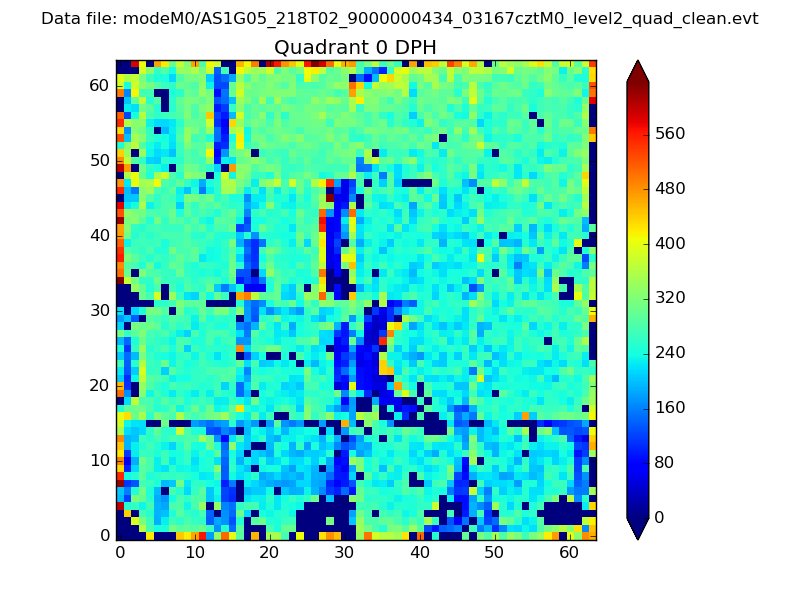 |
 |
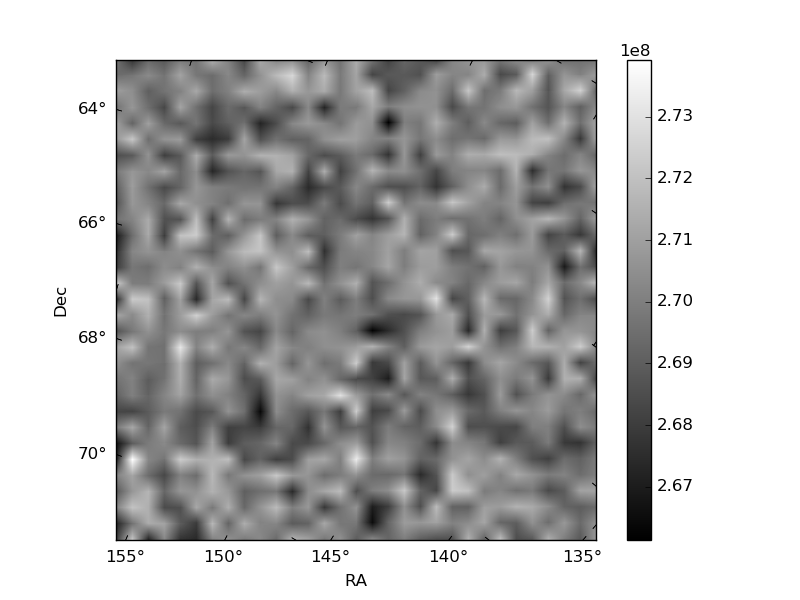
Quadrant B |
|---|---|---|---|
| Quadrant D | 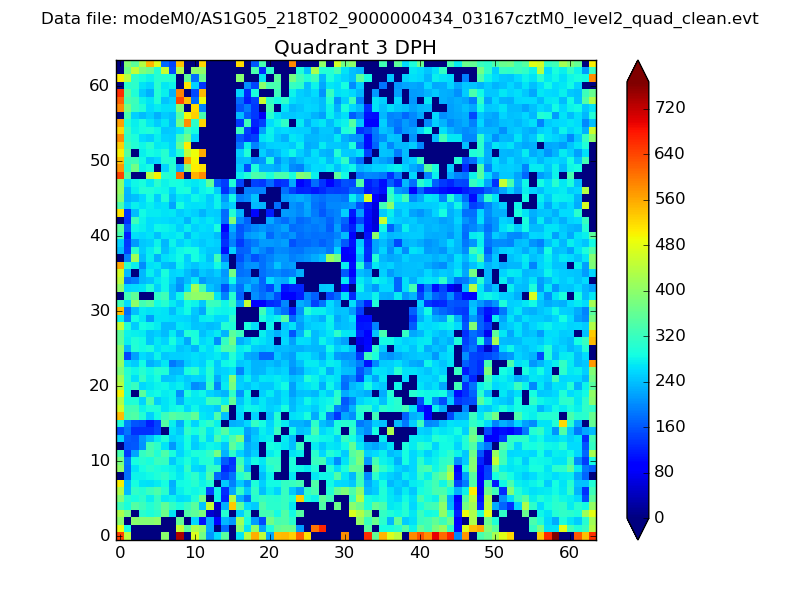 |
 |
Quadrant C |
| Plot type | Count rate plots | Images |
|---|---|---|
| Comparison with Poisson distribution Blue bars denote a histogram of data divided into 1 sec bins. Red curve is a Poisson curve with rate = median count rate of data. |
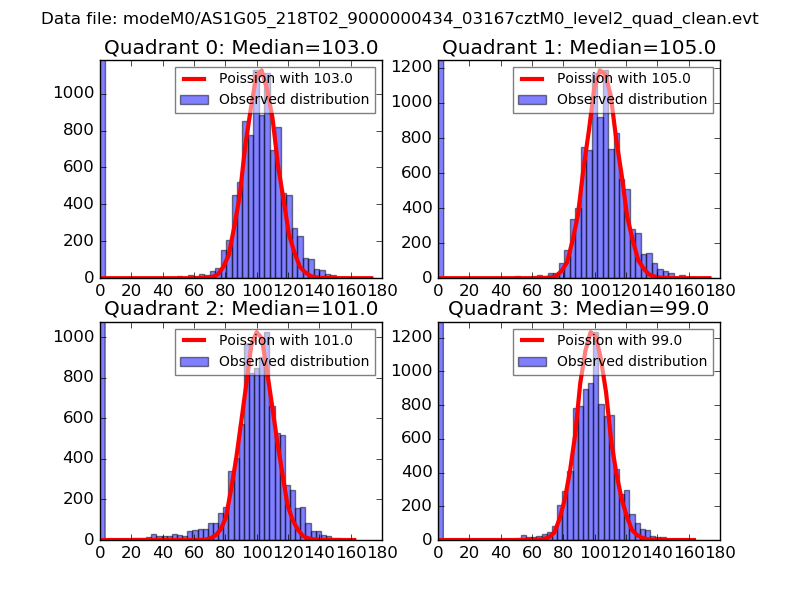 |
 |
| Quadrant-wise count rates Data is divided into 100 sec bins |
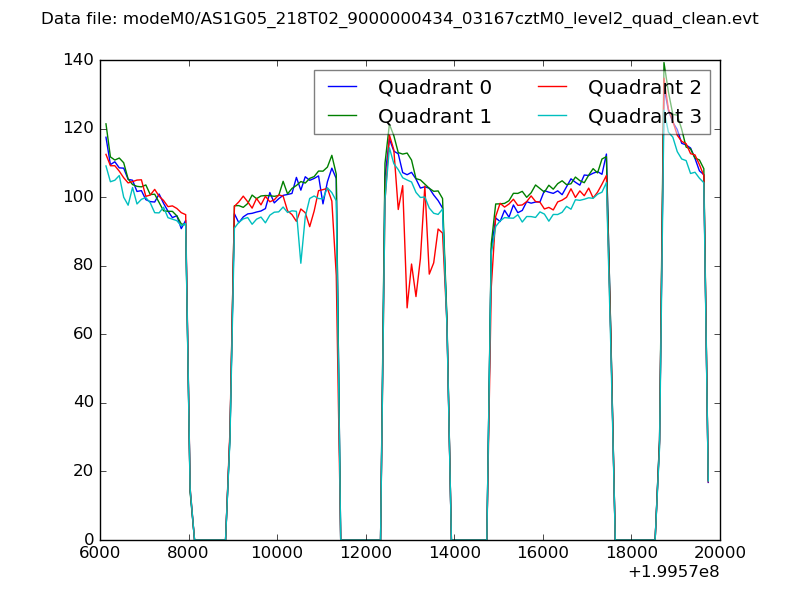 |
|
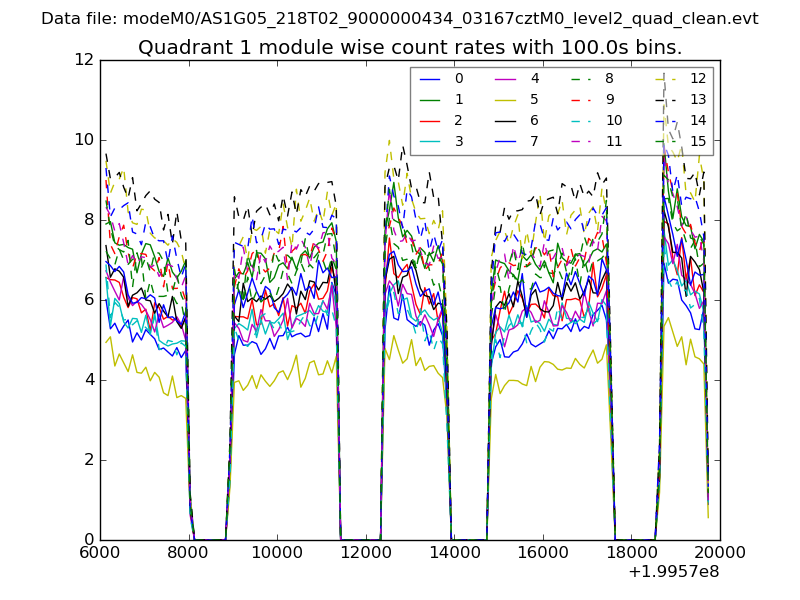
| Module-wise count rates for Quadrant A Data is divided into 100 sec bins |
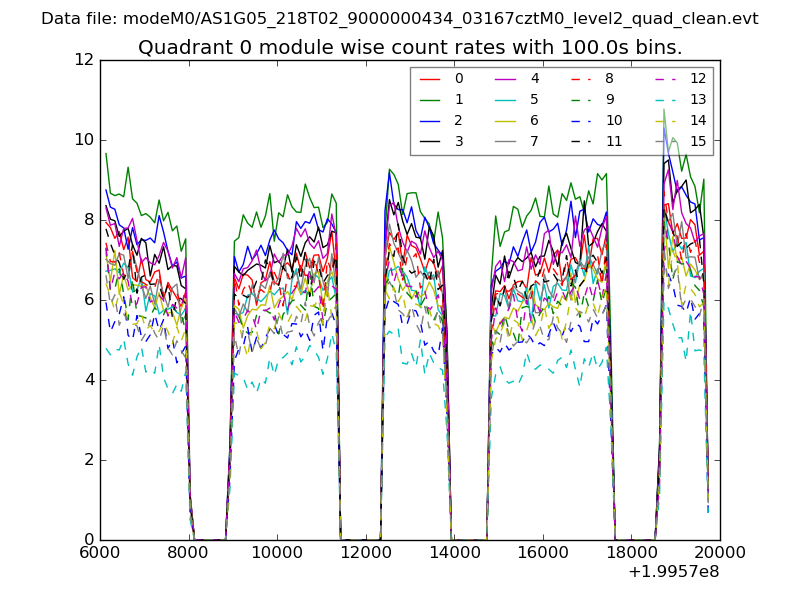 |
 |
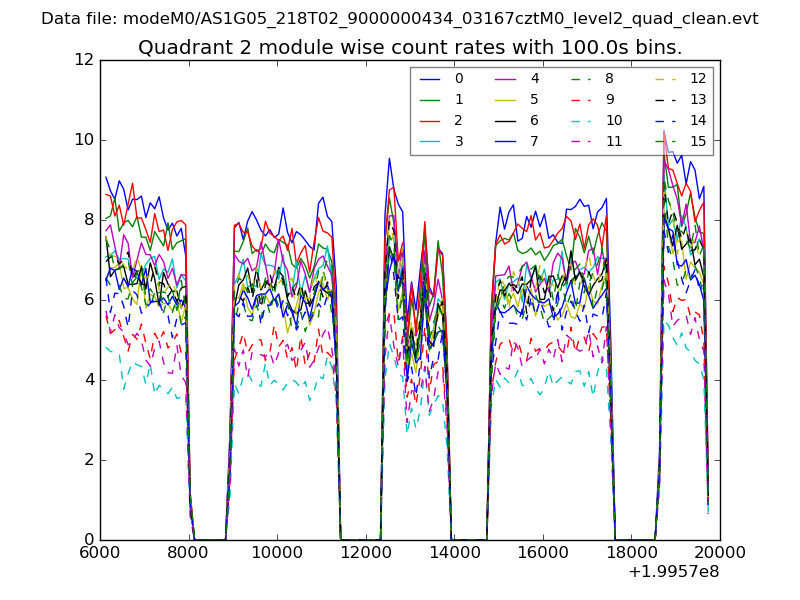
| Module-wise count rates for Quadrant B Data is divided into 100 sec bins |
 |
 |
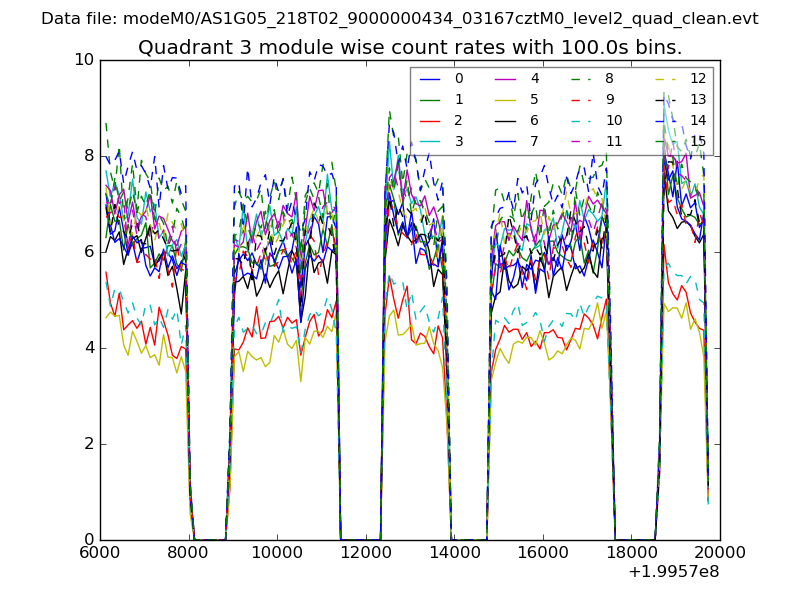
| Module-wise count rates for Quadrant C Data is divided into 100 sec bins |
 |
 |
| Module-wise count rates for Quadrant D Data is divided into 100 sec bins |
 |
 |
| Parameter | Plot |
|---|---|
| CZT HV Monitor | 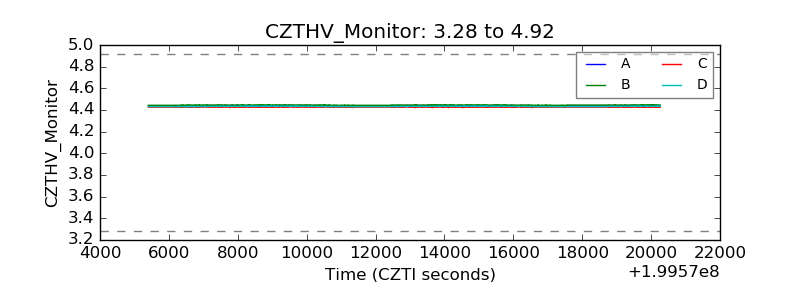 |
| D_VDD | 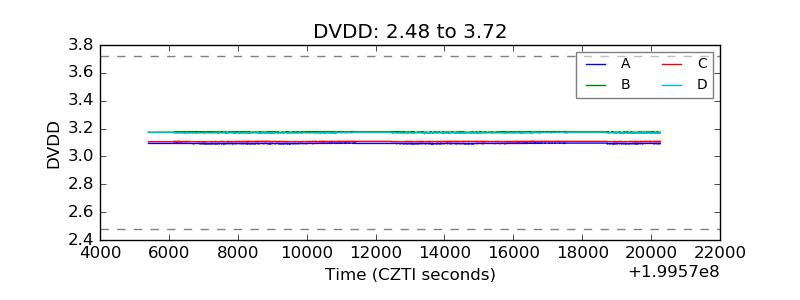 |
| Temperature 1 | 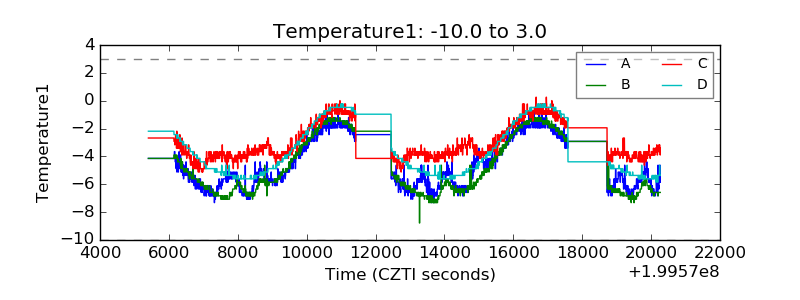 |
| Veto HV Monitor | 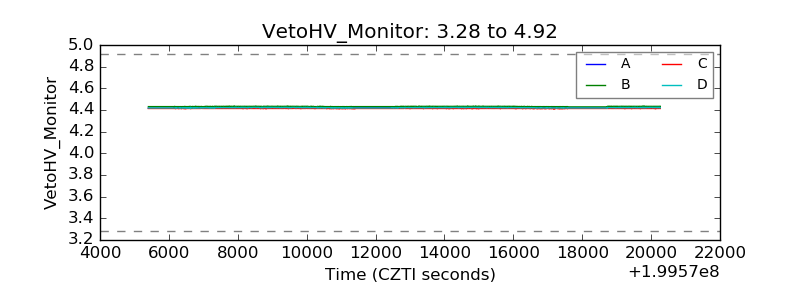 |
| Veto LLD | 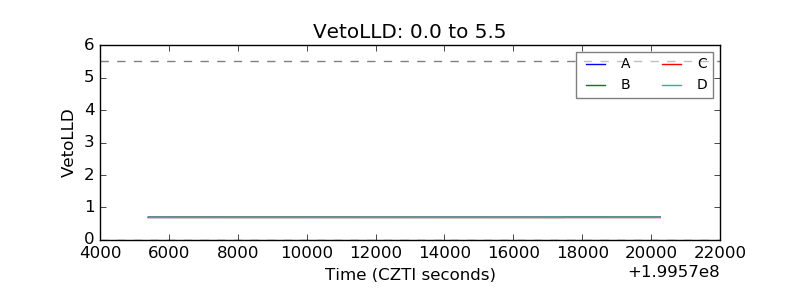 |
| Alpha Counter | 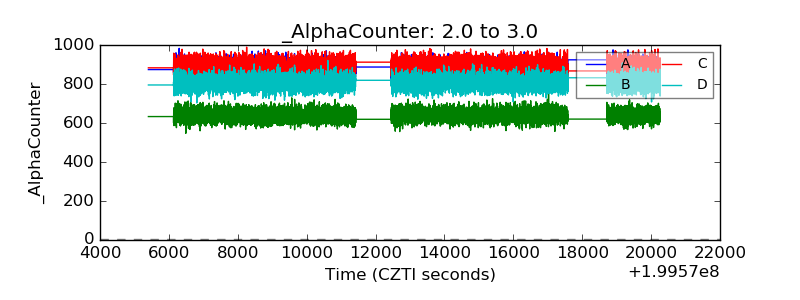 |
| _CPM_Rate | 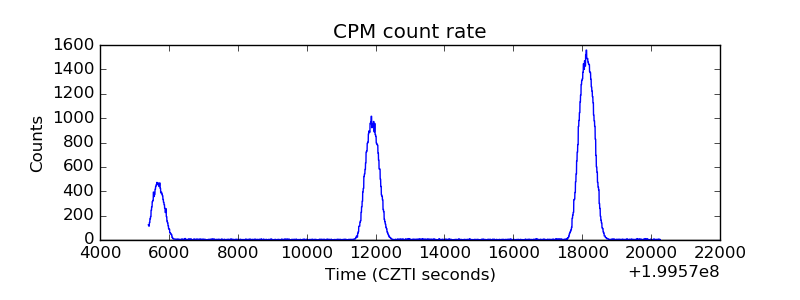 |
| CZT Counter | 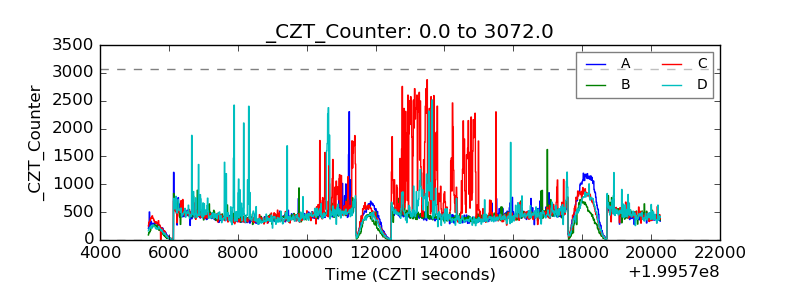 |
| +2.5 Volts monitor | 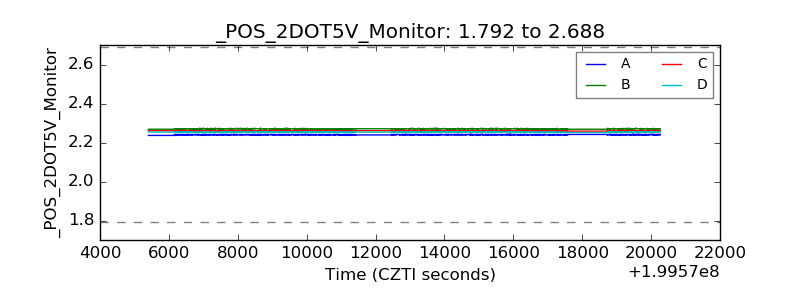 |
| +5 Volts monitor |  |
| _ROLL_ROT | 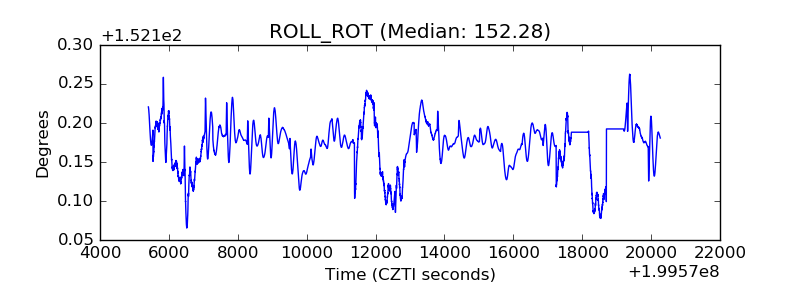 |
| _Roll_DEC | 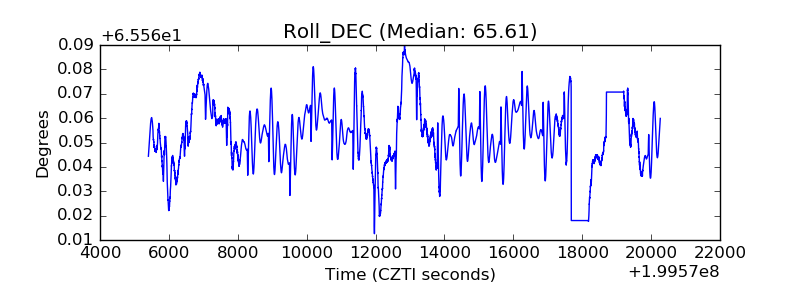 |
| _Roll_RA | 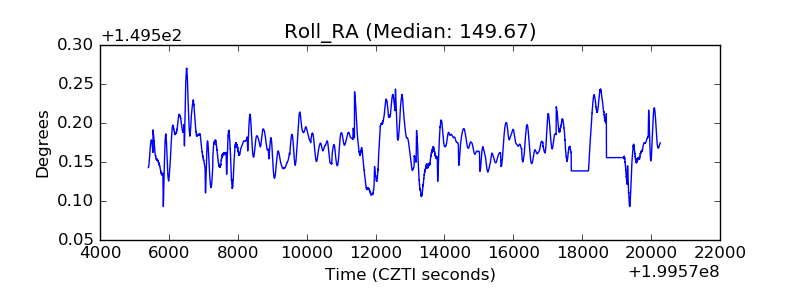 |
| Veto Counter | 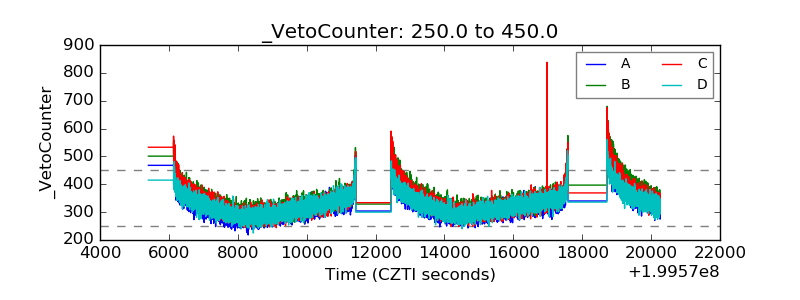 |