| Param | Original file | Final file |
|---|---|---|
| Filename | modeM0/AS1G05_218T02_9000000434_03169cztM0_level2.evt | modeM0/AS1G05_218T02_9000000434_03169cztM0_level2_quad_clean.evt |
| Size (bytes) | 396,944,640 | 73,869,120 |
| Size | 378.6 MB | 70.4 MB |
| Events in quadrant A | 2,843,642 | 459,839 |
| Events in quadrant B | 3,031,873 | 471,044 |
| Events in quadrant C | 2,833,426 | 451,835 |
| Events in quadrant D | 2,902,284 | 433,059 |
| Mode SS | |||
|---|---|---|---|
| Quadrant | BADHDUFLAG | Total packets | Discarded packets |
| A | 0 | 122 | 0 |
| B | 0 | 122 | 0 |
| C | 0 | 122 | 0 |
| D | 0 | 122 | 0 |
| Mode M0 | |||
|---|---|---|---|
| Quadrant | BADHDUFLAG | Total packets | Discarded packets |
| A | 0 | 12482 | 2 |
| B | 0 | 12949 | 1 |
| C | 0 | 12558 | 1 |
| D | 0 | 12978 | 1 |
| Mode M9 | |||
|---|---|---|---|
| Quadrant | BADHDUFLAG | Total packets | Discarded packets |
| A | 0 | 13 | 0 |
| B | 0 | 13 | 0 |
| C | 0 | 13 | 0 |
| D | 0 | 13 | 0 |
| Quadrant | Total seconds | Saturated seconds | Saturation percentage |
|---|---|---|---|
| A | 6029 | 80 | 1.326920% |
| B | 6029 | 98 | 1.625477% |
| C | 6029 | 43 | 0.713219% |
| D | 6029 | 60 | 0.995190% |
Noise dominated data is calculated using 1-second bins in cleaned event files. If a bin has >2000 counts, and if more than 50% of those come from <1% of pixels, then it is considered to be noise-dominated and hence unusable.
| Quadrant | # 1 sec bins | Bins with >0 counts | Bins with >2000 counts | High rate bins dominated by noise | Noise dominated (total time) | Noise dominated (detector-on time) | Marked lightcurve |
|---|---|---|---|---|---|---|---|
| A | 7294 | 6029 | 16 | 16 | 0.22% | 0.27% | 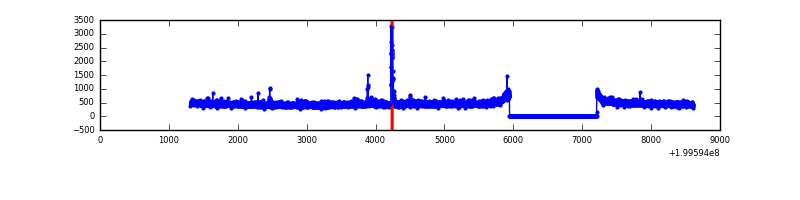 |
| B | 7294 | 6029 | 29 | 29 | 0.40% | 0.48% | 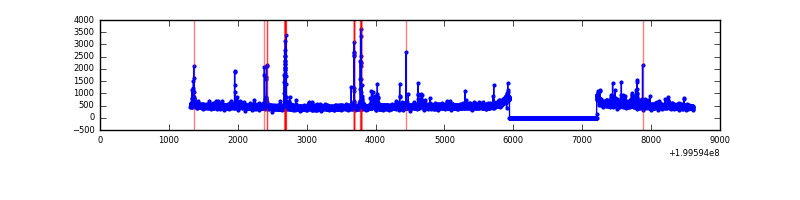 |
| C | 7294 | 6030 | 0 | 0 | 0.00% | 0.00% | 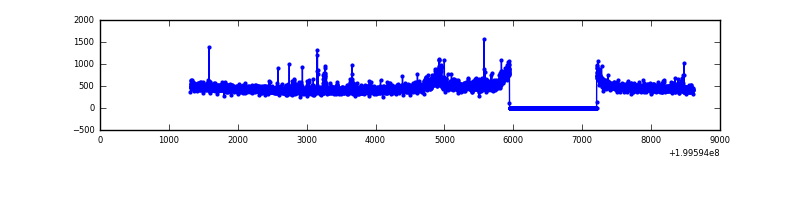 |
| D | 7294 | 6030 | 17 | 17 | 0.23% | 0.28% | 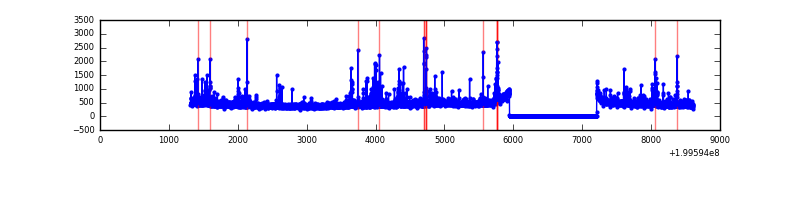 |
Top three noisy pixels from each quadrant. If the there are fewer than three noisy pixels in the level2.evt file, extra rows are filled as -1
| Pixel properties | Quadrant properties | ||||||
|---|---|---|---|---|---|---|---|
| Quadrant | DetID | PixID | Counts | Sigma | Mean | Median | Sigma |
| A | 12 | 247 | 49512 | 336.15 | 712 | 697 | 145.2 |
| A | 8 | 15 | 44927 | 304.57 | 712 | 697 | 145.2 |
| A | 12 | 194 | 7725 | 48.39 | 712 | 697 | 145.2 |
| B | 4 | 80 | 61449 | 446.37 | 722 | 707 | 136.1 |
| B | 2 | 249 | 57354 | 416.27 | 722 | 707 | 136.1 |
| B | 5 | 70 | 49464 | 358.29 | 722 | 707 | 136.1 |
| C | 1 | 192 | 76225 | 479.72 | 683 | 686 | 157.5 |
| C | 15 | 208 | 39438 | 246.1 | 683 | 686 | 157.5 |
| C | 6 | 80 | 15052 | 91.23 | 683 | 686 | 157.5 |
| D | 2 | 136 | 83355 | 509.06 | 678 | 657 | 162.5 |
| D | 5 | 233 | 51494 | 312.93 | 678 | 657 | 162.5 |
| D | 13 | 239 | 38856 | 235.14 | 678 | 657 | 162.5 |
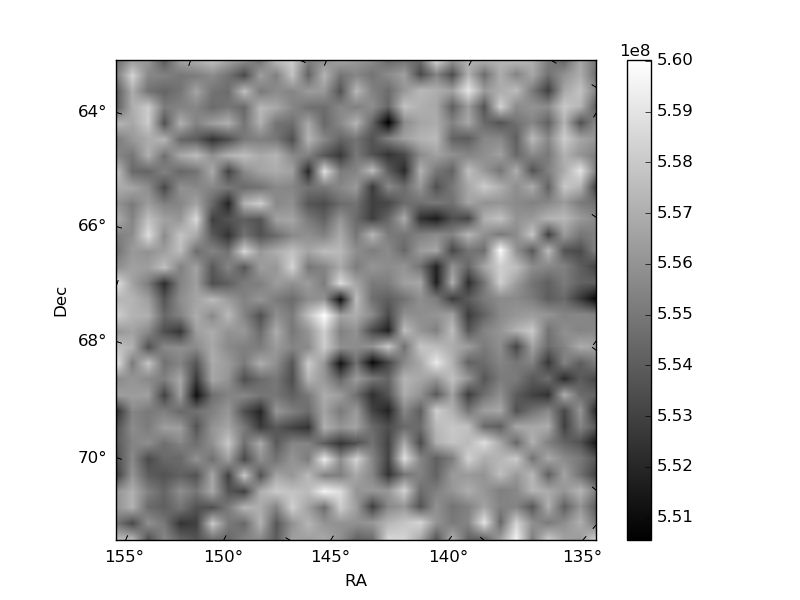
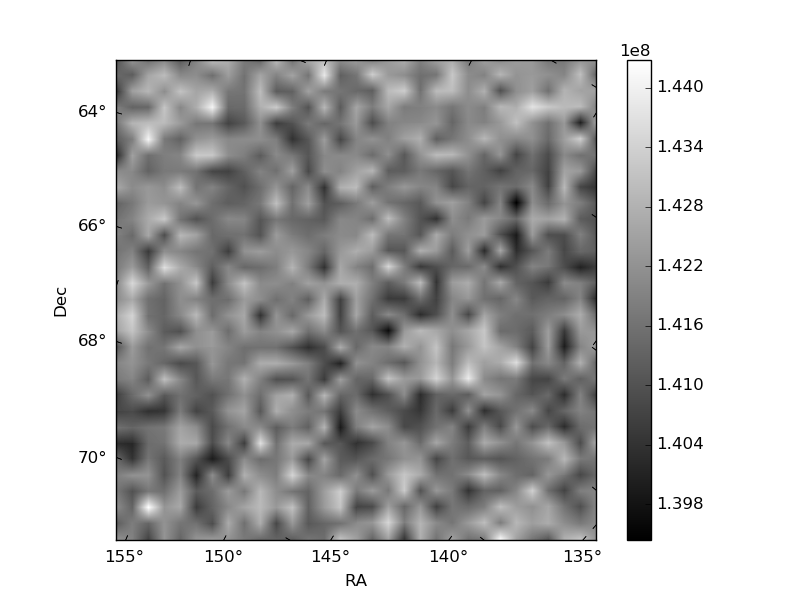
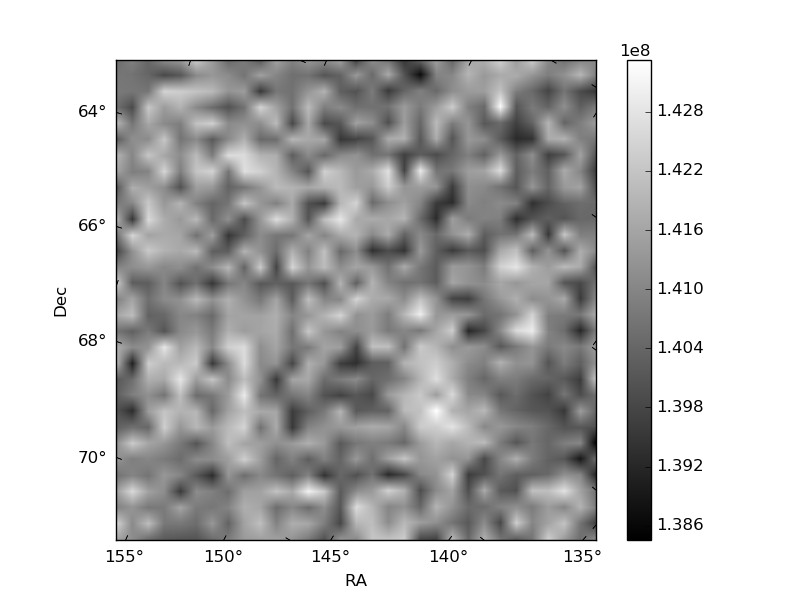
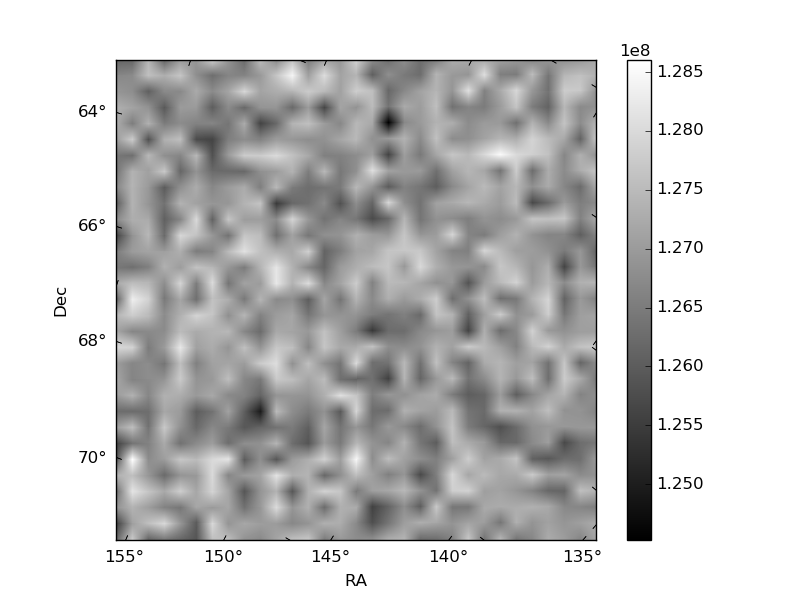
Histogram calculated using DETX and DETY for each event in the final _common_clean file
| Quadrant A | 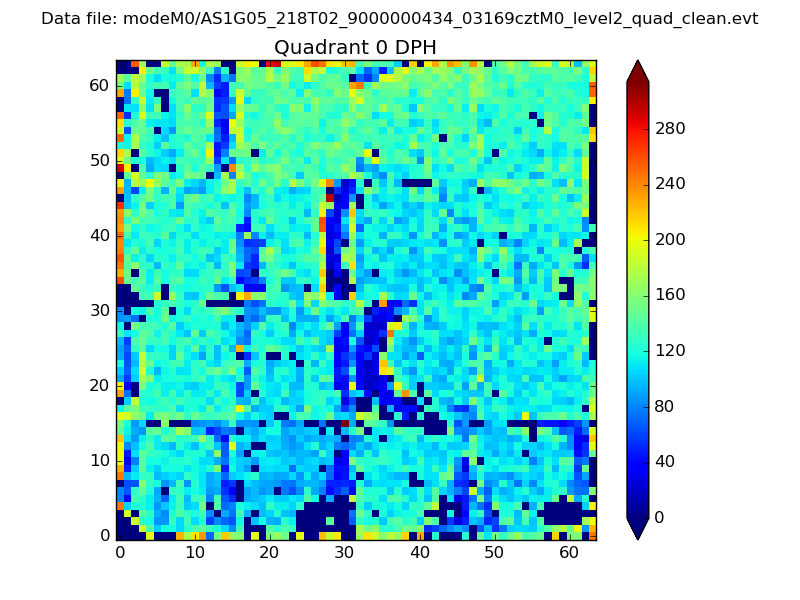 |
 |
Quadrant B |
|---|---|---|---|
| Quadrant D | 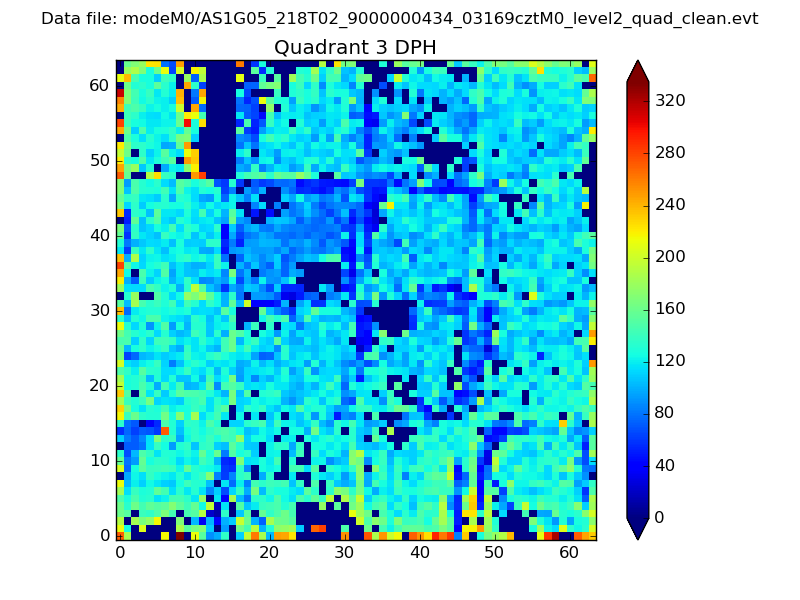 |
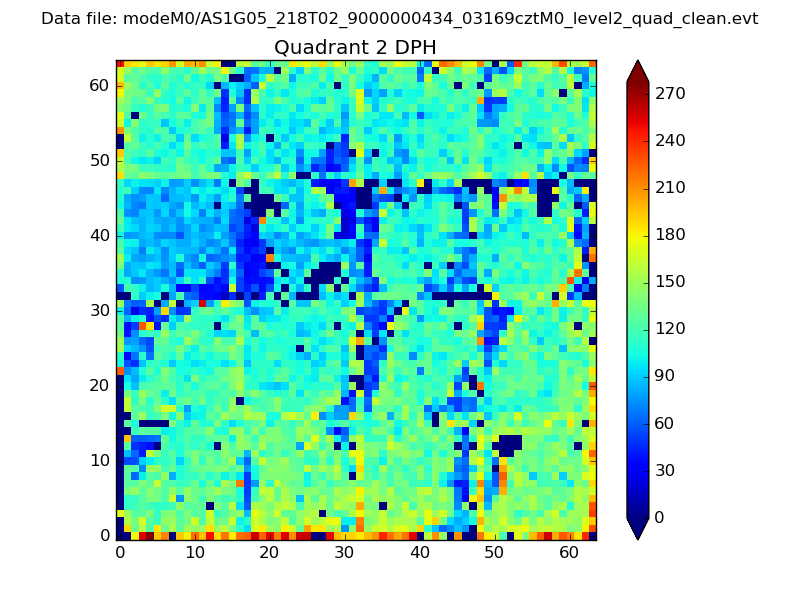 |
Quadrant C |
| Plot type | Count rate plots | Images |
|---|---|---|
| Comparison with Poisson distribution Blue bars denote a histogram of data divided into 1 sec bins. Red curve is a Poisson curve with rate = median count rate of data. |
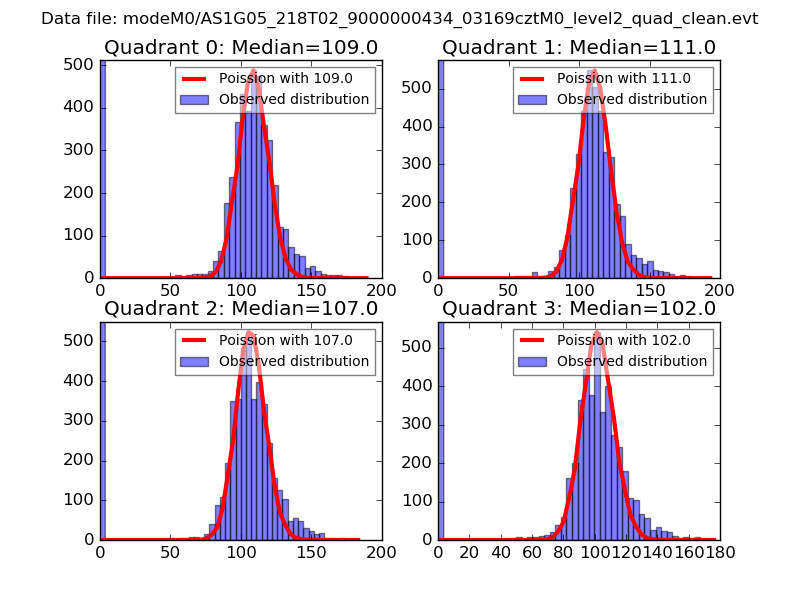 |
 |
| Quadrant-wise count rates Data is divided into 100 sec bins |
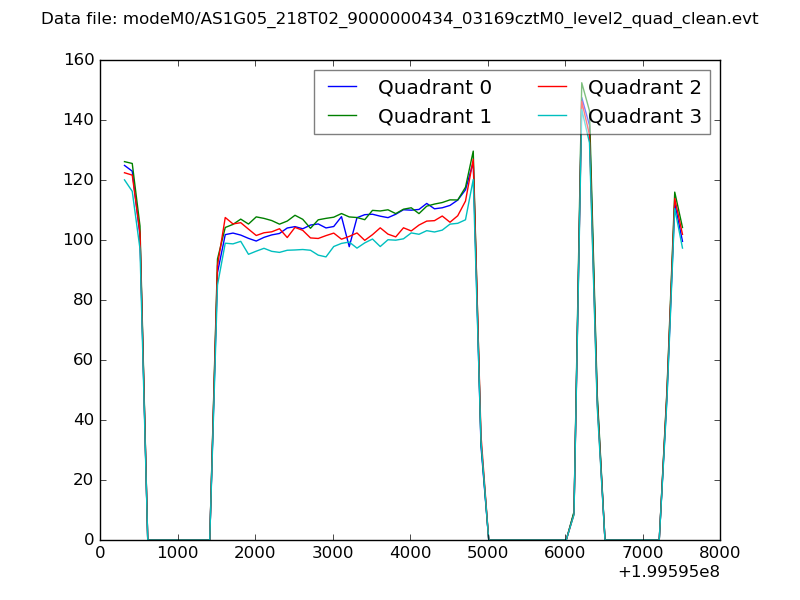 |
|
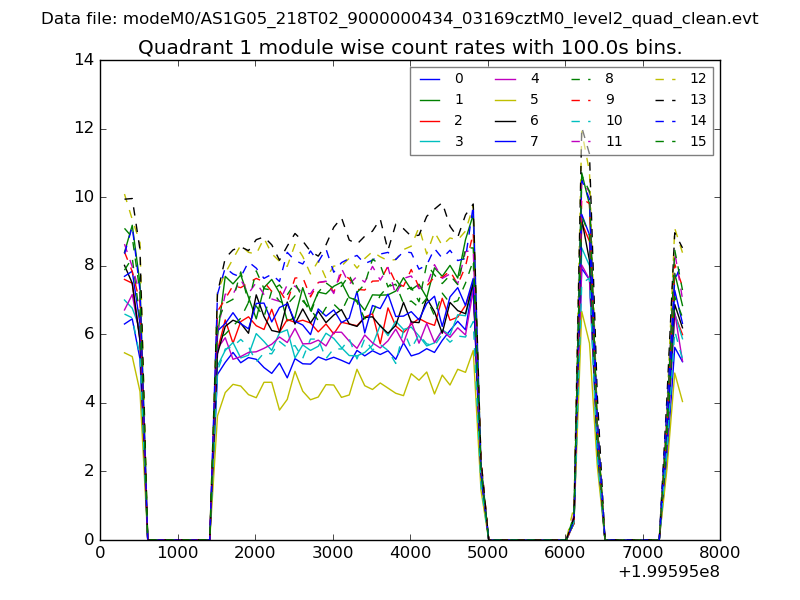
| Module-wise count rates for Quadrant A Data is divided into 100 sec bins |
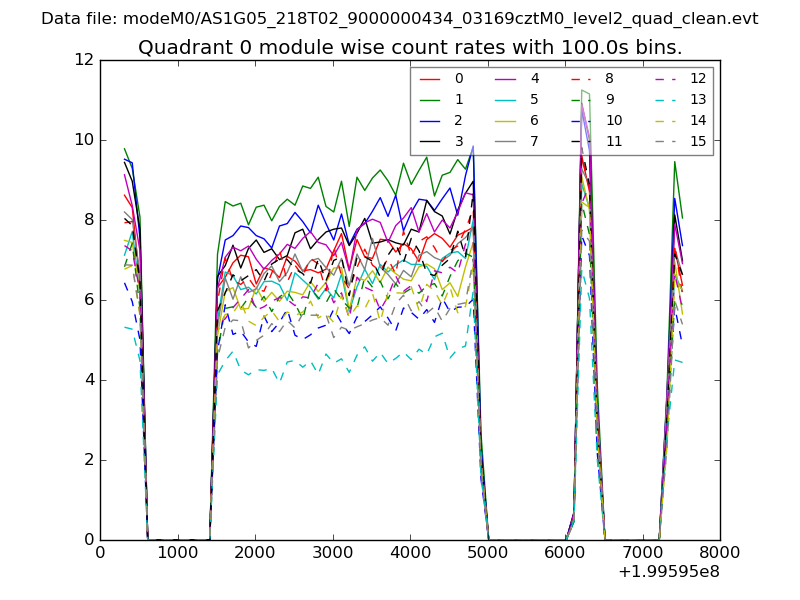 |
 |
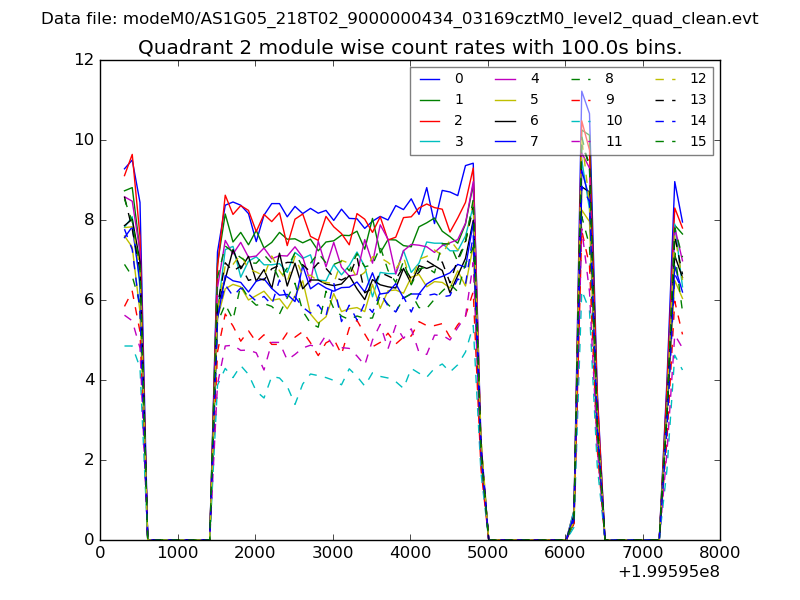
| Module-wise count rates for Quadrant B Data is divided into 100 sec bins |
 |
 |
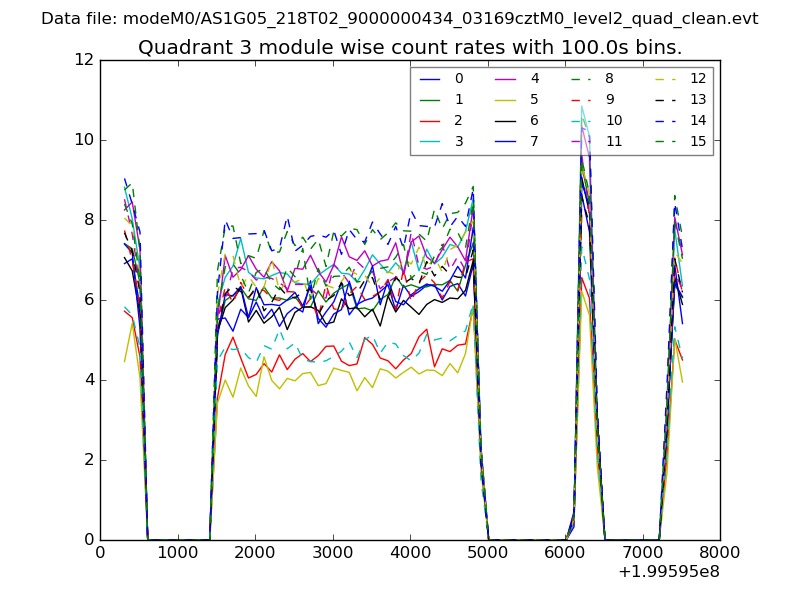
| Module-wise count rates for Quadrant C Data is divided into 100 sec bins |
 |
 |
| Module-wise count rates for Quadrant D Data is divided into 100 sec bins |
 |
 |
| Parameter | Plot |
|---|---|
| CZT HV Monitor | 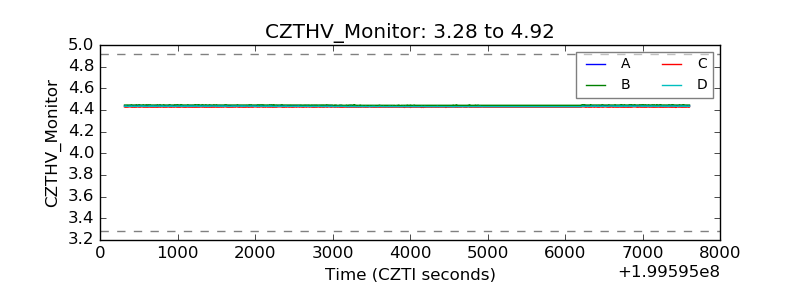 |
| D_VDD | 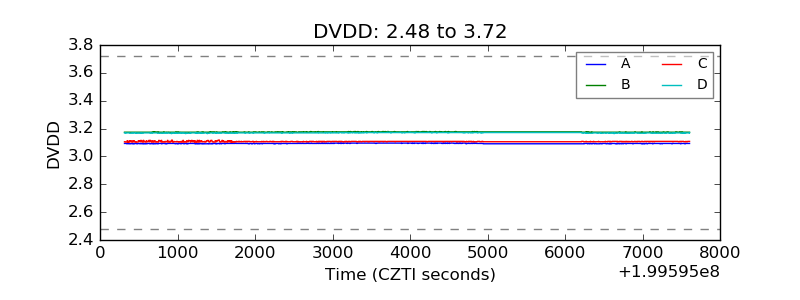 |
| Temperature 1 | 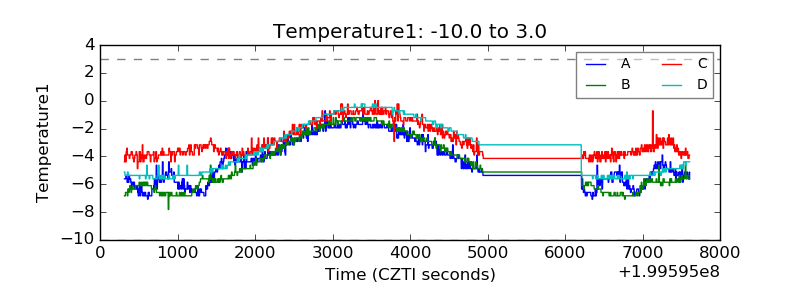 |
| Veto HV Monitor | 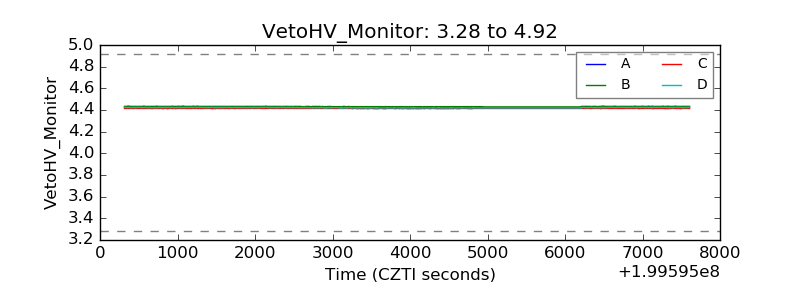 |
| Veto LLD | 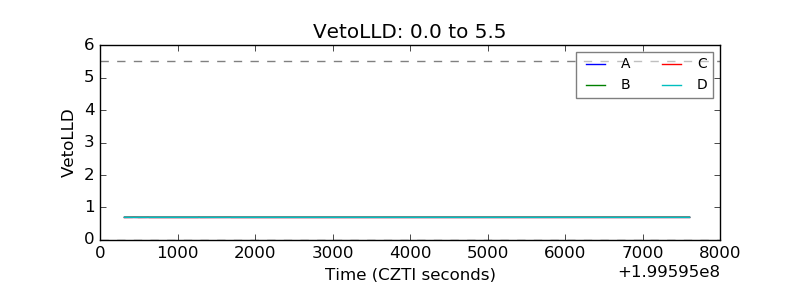 |
| Alpha Counter | 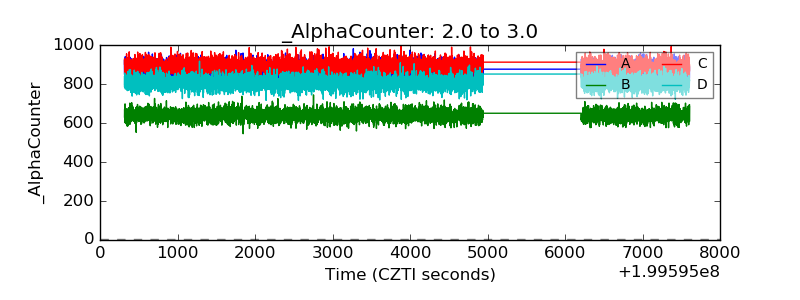 |
| _CPM_Rate | 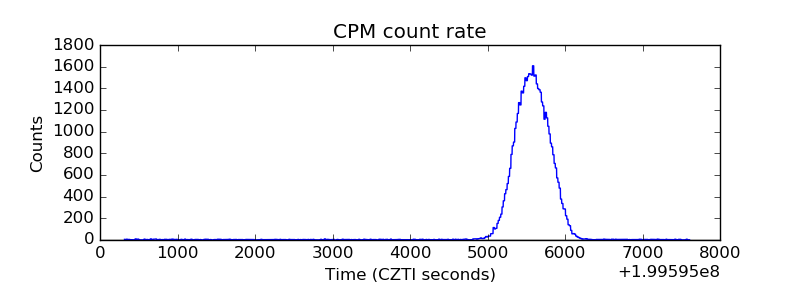 |
| CZT Counter | 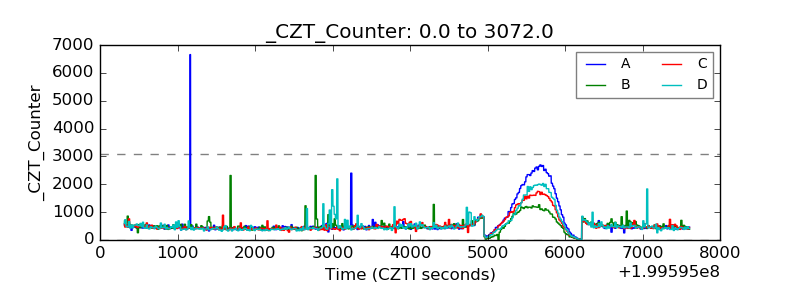 |
| +2.5 Volts monitor |  |
| +5 Volts monitor |  |
| _ROLL_ROT | 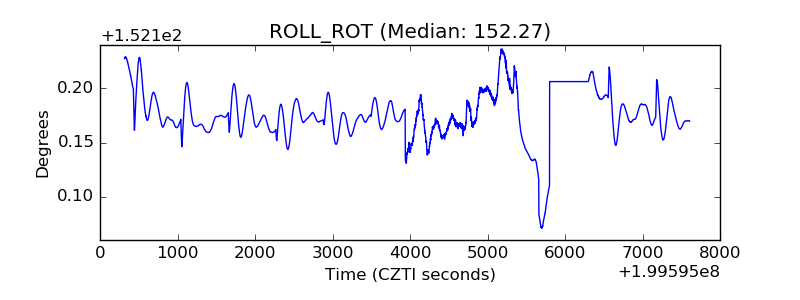 |
| _Roll_DEC | 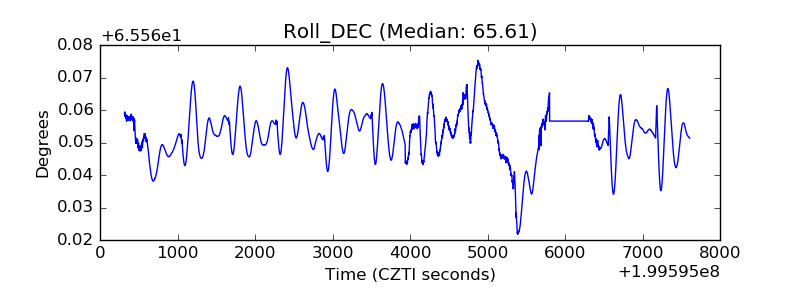 |
| _Roll_RA | 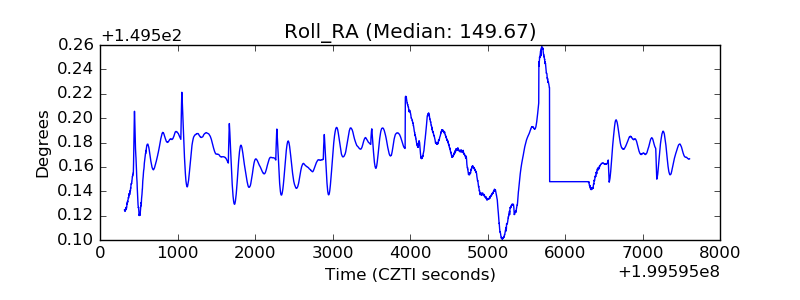 |
| Veto Counter | 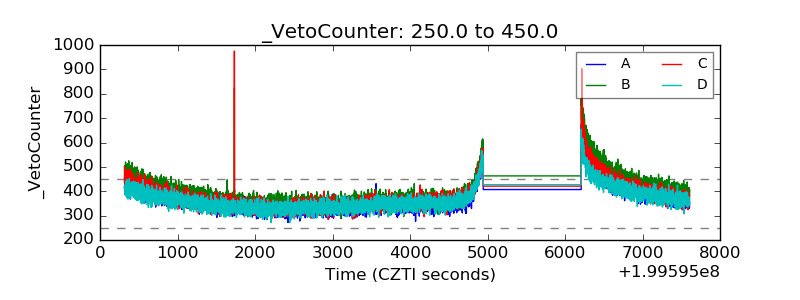 |