| Param | Original file | Final file |
|---|---|---|
| Filename | modeM0/AS1G05_218T02_9000000434_03170cztM0_level2.evt | modeM0/AS1G05_218T02_9000000434_03170cztM0_level2_quad_clean.evt |
| Size (bytes) | 423,970,560 | 78,984,000 |
| Size | 404.3 MB | 75.3 MB |
| Events in quadrant A | 3,179,171 | 494,794 |
| Events in quadrant B | 3,028,203 | 508,706 |
| Events in quadrant C | 3,234,308 | 484,048 |
| Events in quadrant D | 2,977,487 | 472,399 |
| Mode SS | |||
|---|---|---|---|
| Quadrant | BADHDUFLAG | Total packets | Discarded packets |
| A | 0 | 128 | 0 |
| B | 0 | 128 | 0 |
| C | 0 | 128 | 0 |
| D | 0 | 128 | 0 |
| Mode M0 | |||
|---|---|---|---|
| Quadrant | BADHDUFLAG | Total packets | Discarded packets |
| A | 0 | 13607 | 35 |
| B | 0 | 13065 | 47 |
| C | 0 | 13871 | 29 |
| D | 0 | 13331 | 39 |
| Mode M9 | |||
|---|---|---|---|
| Quadrant | BADHDUFLAG | Total packets | Discarded packets |
| A | 0 | 13 | 0 |
| B | 0 | 13 | 0 |
| C | 0 | 13 | 0 |
| D | 0 | 13 | 0 |
| Quadrant | Total seconds | Saturated seconds | Saturation percentage |
|---|---|---|---|
| A | 6177 | 121 | 1.958880% |
| B | 6174 | 52 | 0.842242% |
| C | 6180 | 70 | 1.132686% |
| D | 6176 | 57 | 0.922927% |
Noise dominated data is calculated using 1-second bins in cleaned event files. If a bin has >2000 counts, and if more than 50% of those come from <1% of pixels, then it is considered to be noise-dominated and hence unusable.
| Quadrant | # 1 sec bins | Bins with >0 counts | Bins with >2000 counts | High rate bins dominated by noise | Noise dominated (total time) | Noise dominated (detector-on time) | Marked lightcurve |
|---|---|---|---|---|---|---|---|
| A | 7508 | 6192 | 68 | 68 | 0.91% | 1.10% | 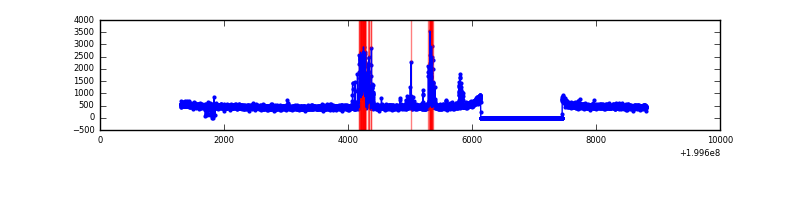 |
| B | 7508 | 6192 | 6 | 6 | 0.08% | 0.10% | 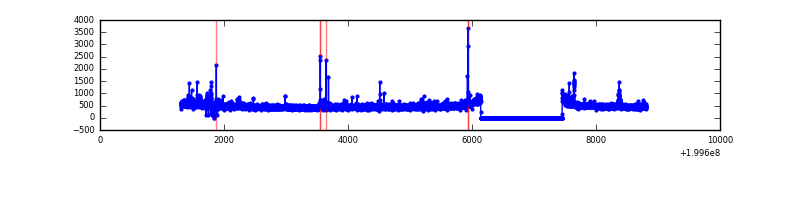 |
| C | 7508 | 6193 | 50 | 50 | 0.67% | 0.81% | 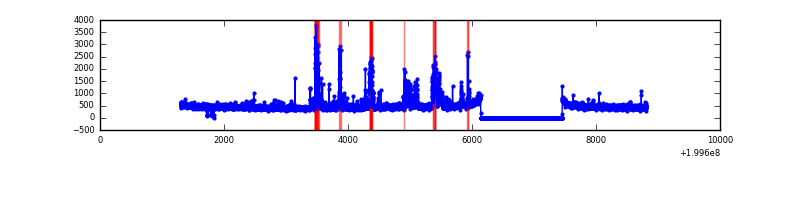 |
| D | 7508 | 6190 | 39 | 39 | 0.52% | 0.63% | 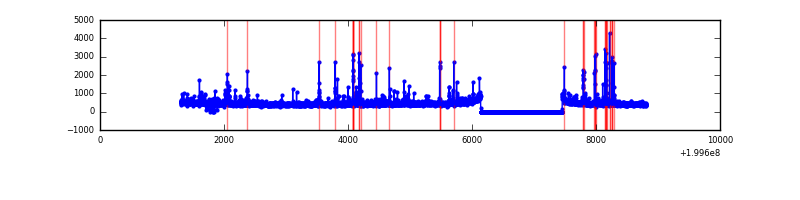 |
Top three noisy pixels from each quadrant. If the there are fewer than three noisy pixels in the level2.evt file, extra rows are filled as -1
| Pixel properties | Quadrant properties | ||||||
|---|---|---|---|---|---|---|---|
| Quadrant | DetID | PixID | Counts | Sigma | Mean | Median | Sigma |
| A | 12 | 247 | 212342 | 1408.7 | 734 | 717 | 150.2 |
| A | 0 | 149 | 115166 | 761.84 | 734 | 717 | 150.2 |
| A | 0 | 226 | 18969 | 121.5 | 734 | 717 | 150.2 |
| B | 4 | 80 | 64813 | 444.91 | 747 | 729 | 144.0 |
| B | 2 | 249 | 36293 | 246.9 | 747 | 729 | 144.0 |
| B | 0 | 219 | 14075 | 92.66 | 747 | 729 | 144.0 |
| C | 1 | 192 | 405344 | 2517.71 | 700 | 703 | 160.7 |
| C | 6 | 80 | 37170 | 226.9 | 700 | 703 | 160.7 |
| C | 15 | 208 | 24214 | 146.29 | 700 | 703 | 160.7 |
| D | 13 | 239 | 84778 | 493.17 | 703 | 680 | 170.5 |
| D | 2 | 136 | 62660 | 363.47 | 703 | 680 | 170.5 |
| D | 13 | 223 | 58773 | 340.67 | 703 | 680 | 170.5 |
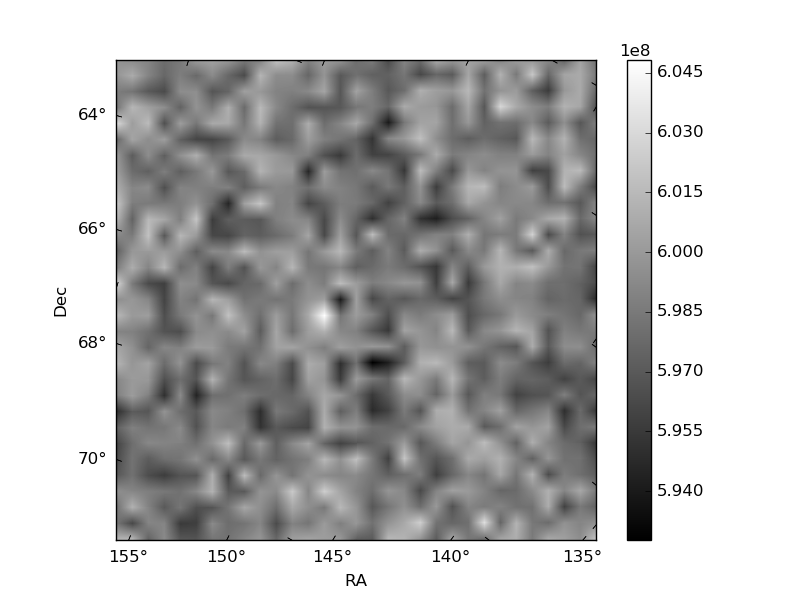
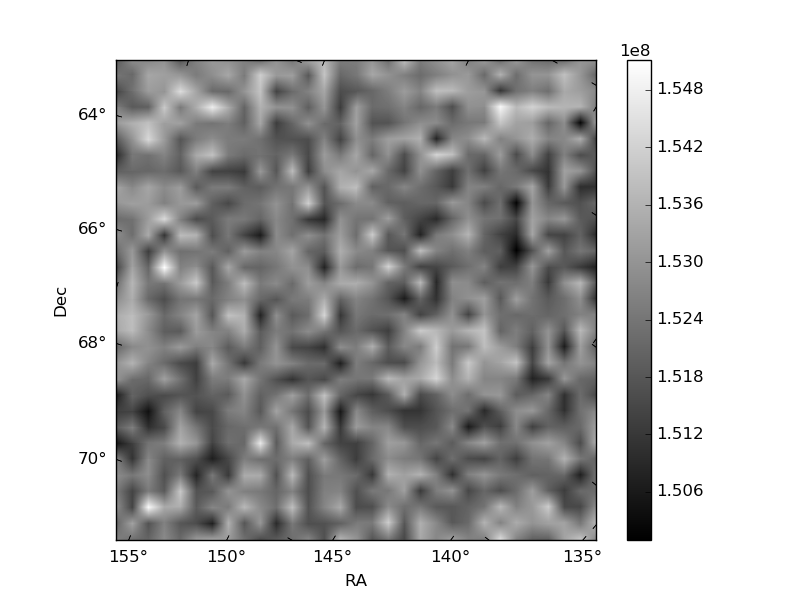
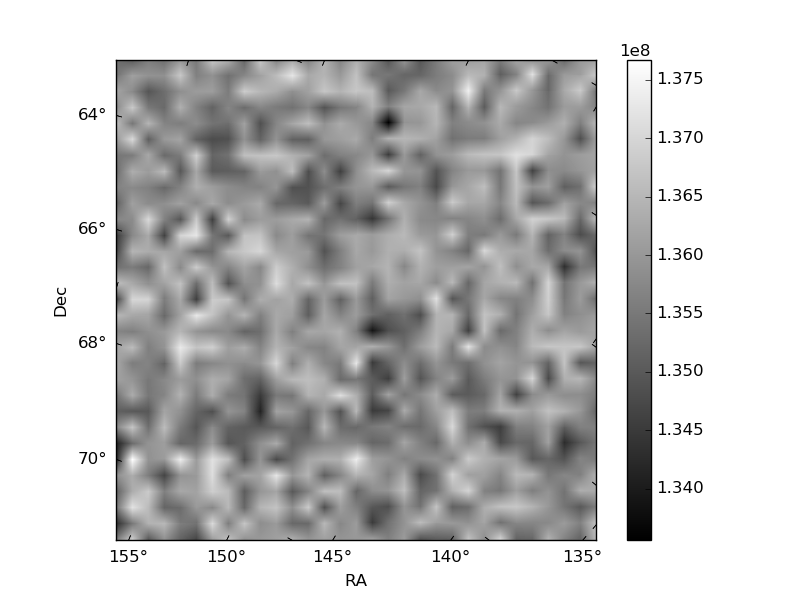
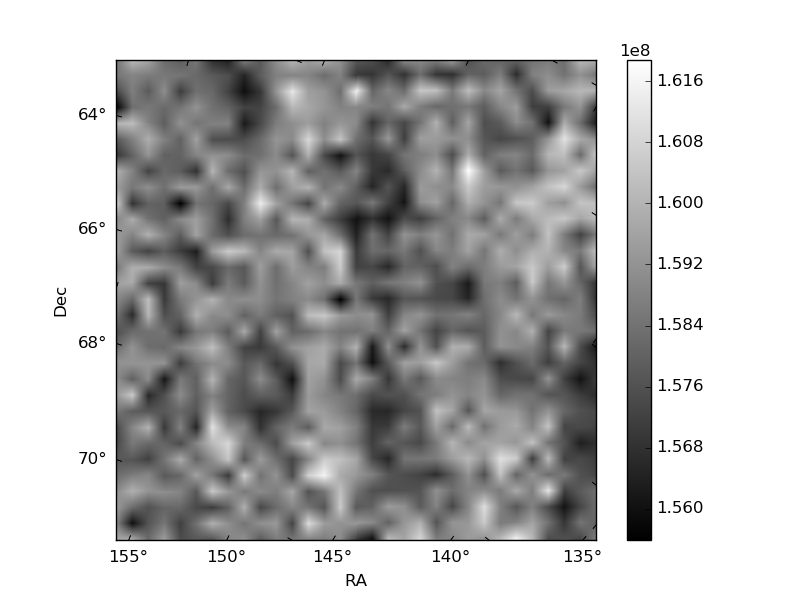
Histogram calculated using DETX and DETY for each event in the final _common_clean file
| Quadrant A | 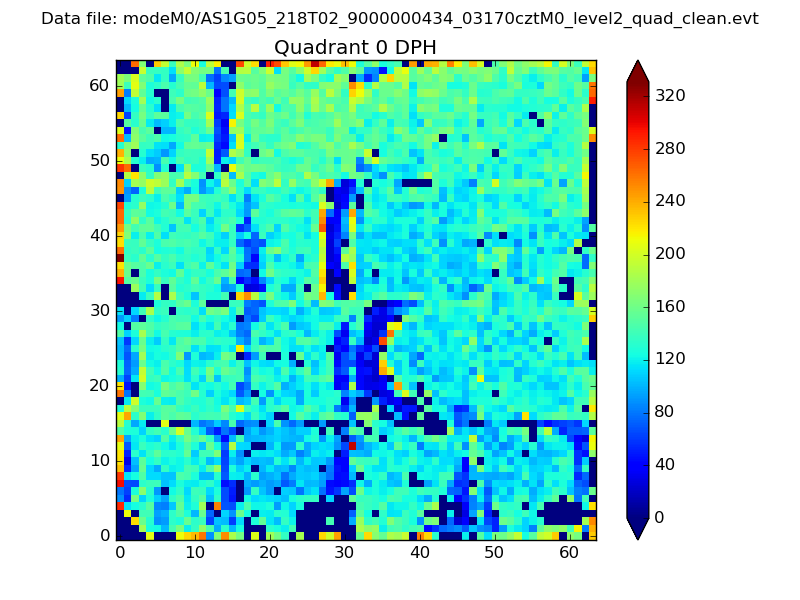 |
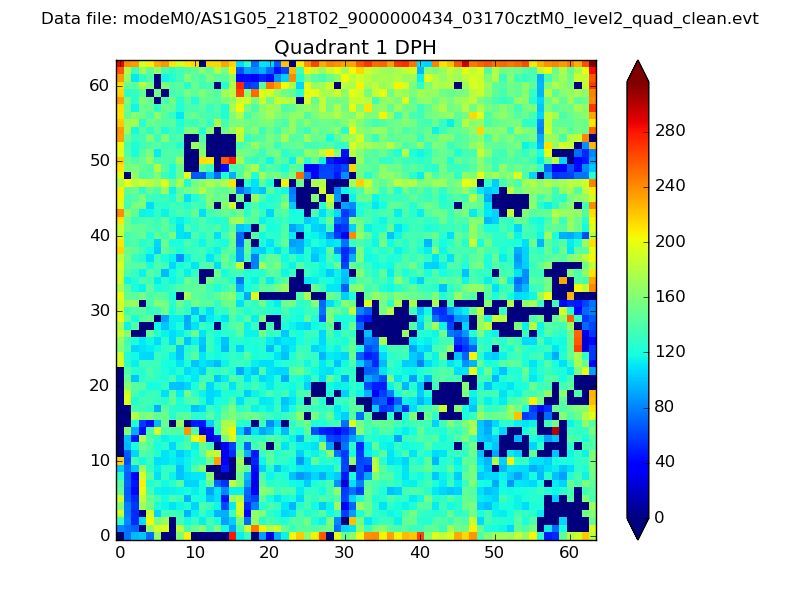 |
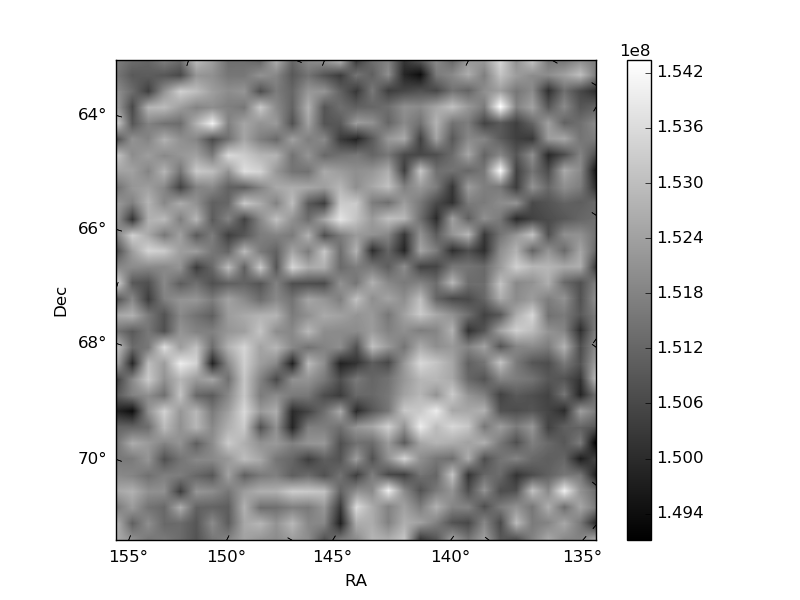
Quadrant B |
|---|---|---|---|
| Quadrant D | 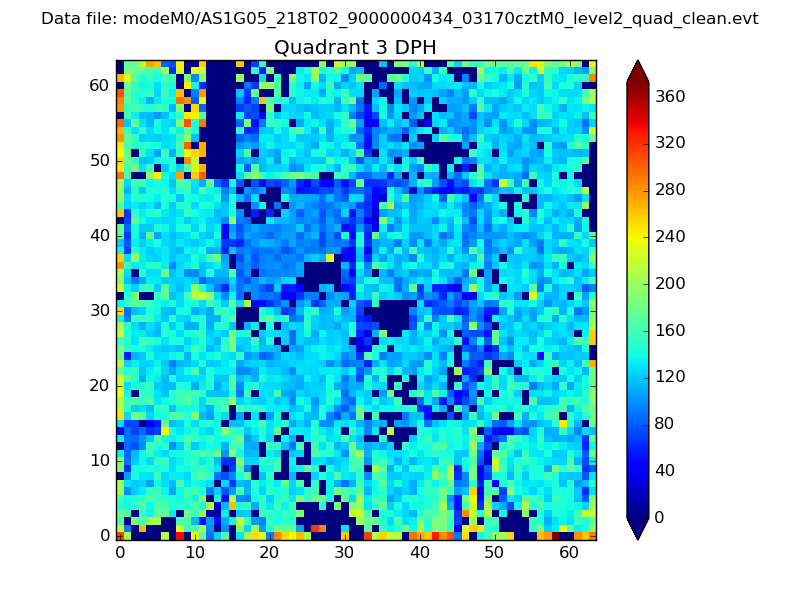 |
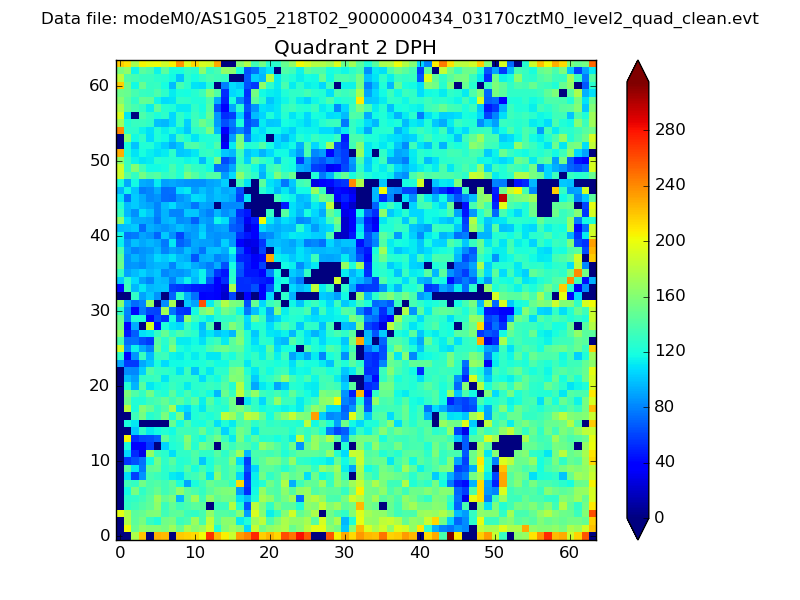 |
Quadrant C |
| Plot type | Count rate plots | Images |
|---|---|---|
| Comparison with Poisson distribution Blue bars denote a histogram of data divided into 1 sec bins. Red curve is a Poisson curve with rate = median count rate of data. |
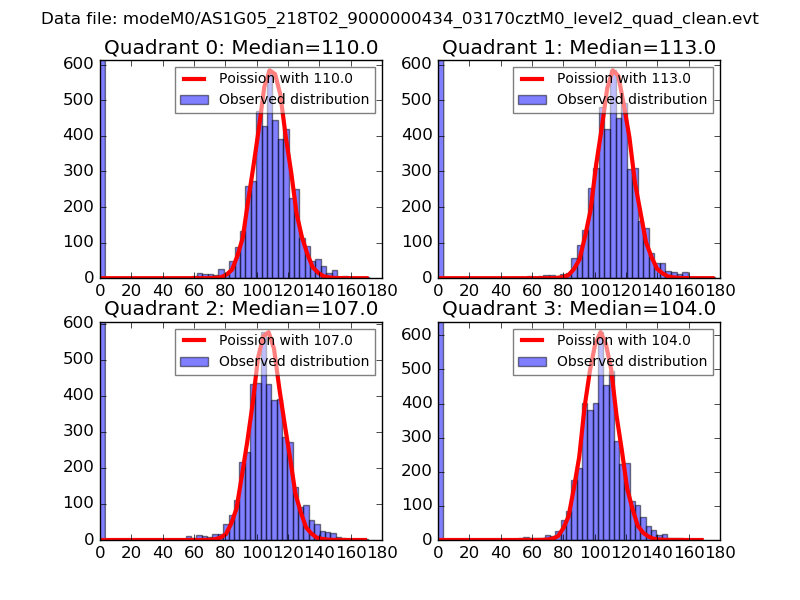 |
 |
| Quadrant-wise count rates Data is divided into 100 sec bins |
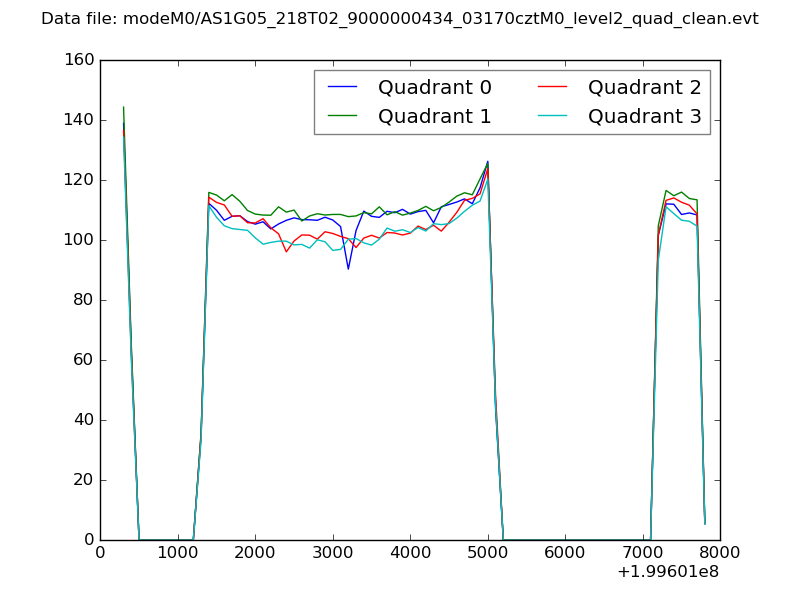 |
|
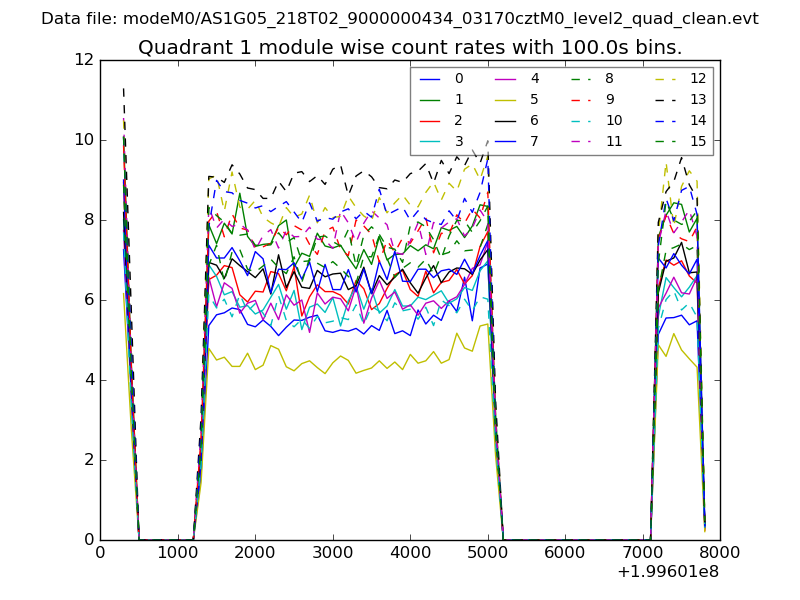
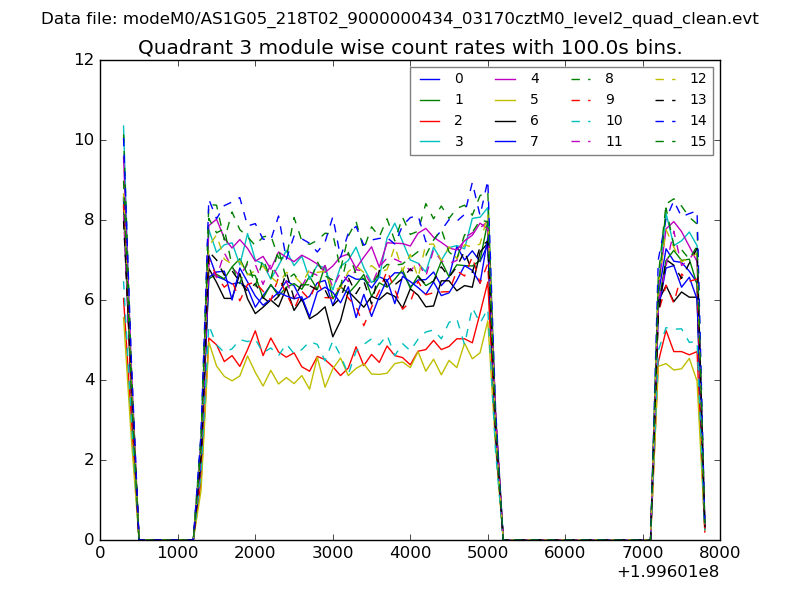
| Module-wise count rates for Quadrant A Data is divided into 100 sec bins |
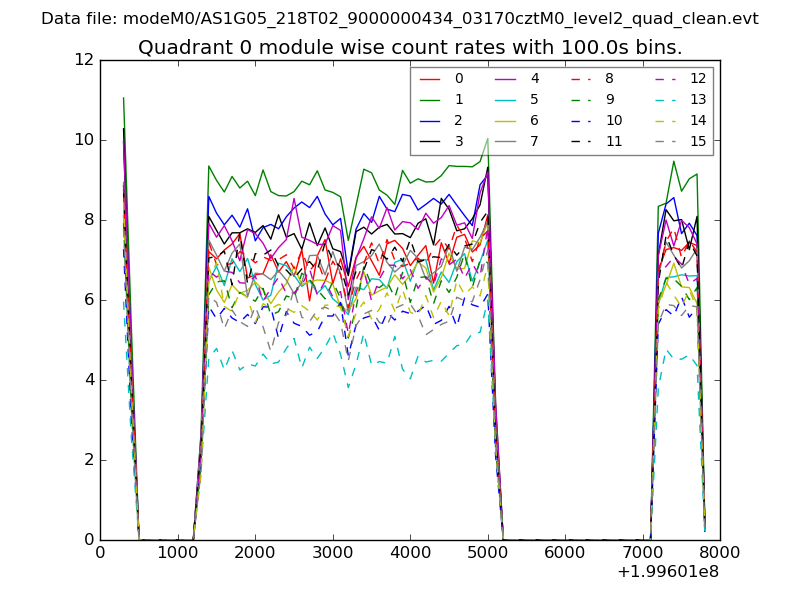 |
 |
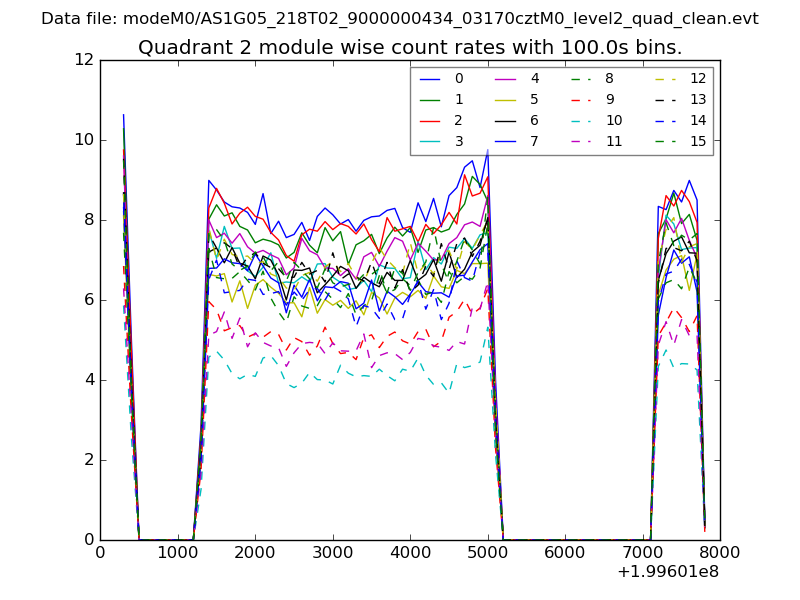
| Module-wise count rates for Quadrant B Data is divided into 100 sec bins |
 |
 |
| Module-wise count rates for Quadrant C Data is divided into 100 sec bins |
 |
 |
| Module-wise count rates for Quadrant D Data is divided into 100 sec bins |
 |
 |
| Parameter | Plot |
|---|---|
| CZT HV Monitor | 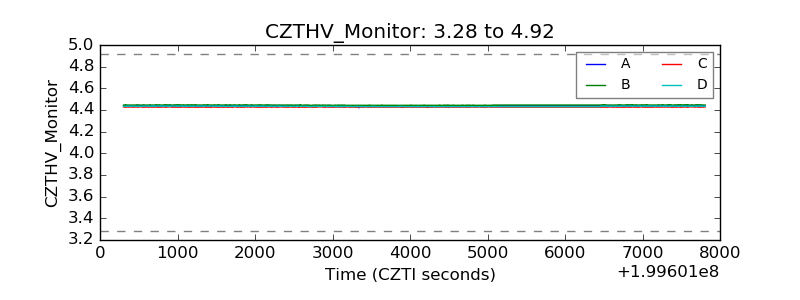 |
| D_VDD | 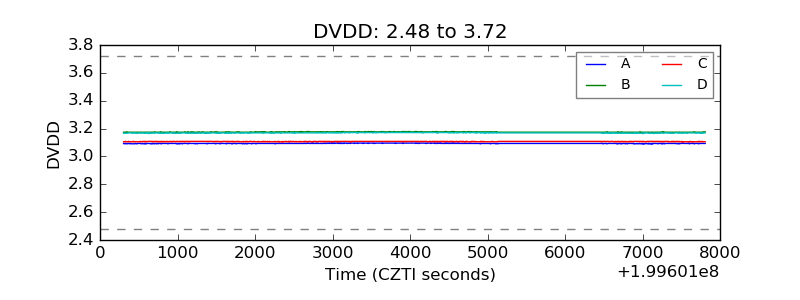 |
| Temperature 1 | 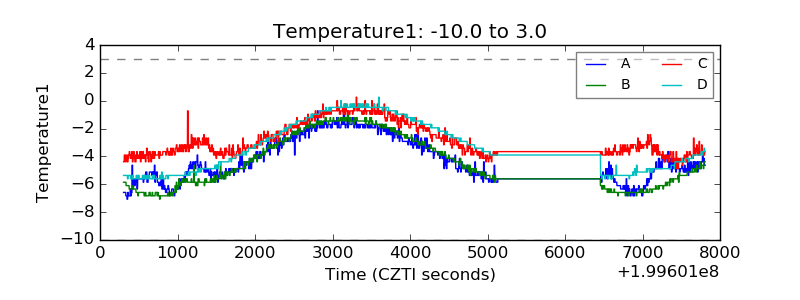 |
| Veto HV Monitor | 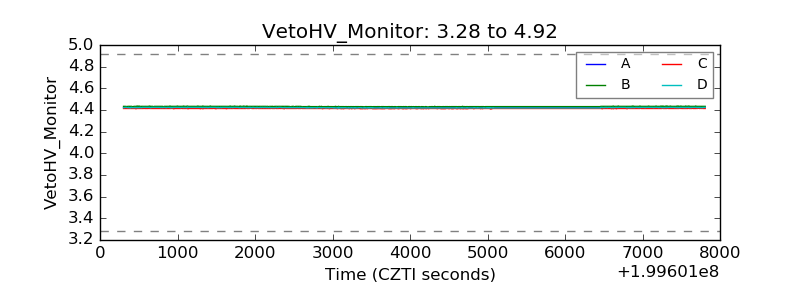 |
| Veto LLD | 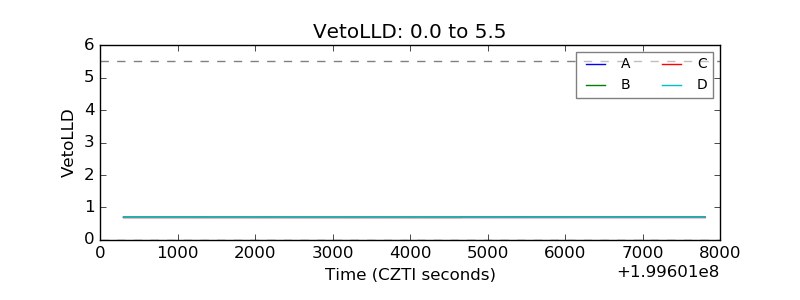 |
| Alpha Counter | 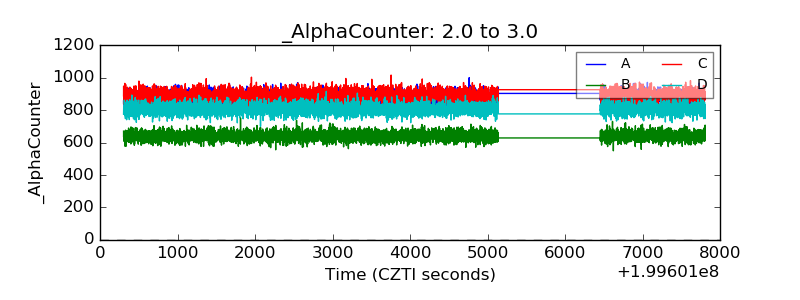 |
| _CPM_Rate | 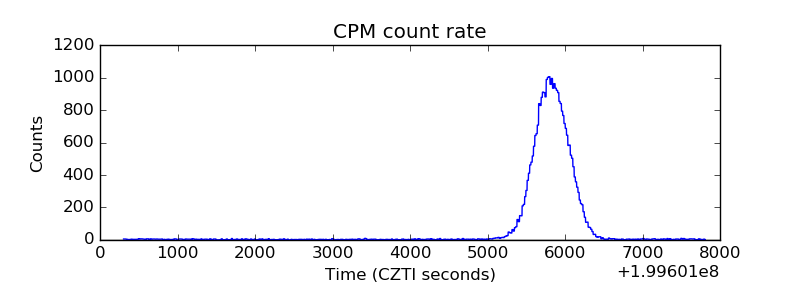 |
| CZT Counter | 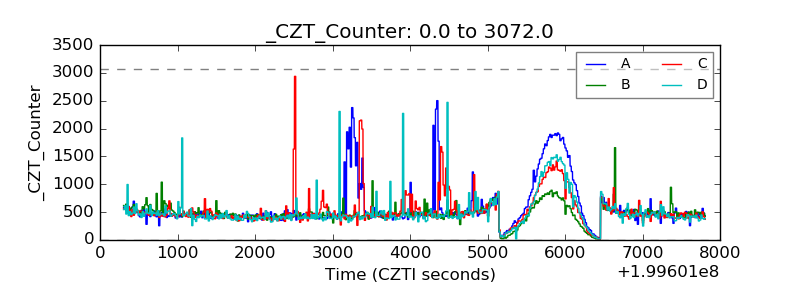 |
| +2.5 Volts monitor |  |
| +5 Volts monitor |  |
| _ROLL_ROT | 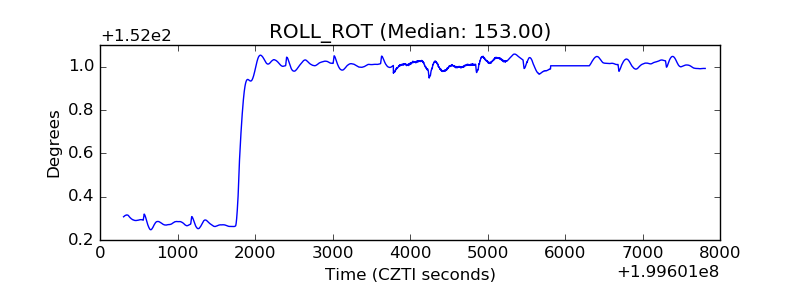 |
| _Roll_DEC | 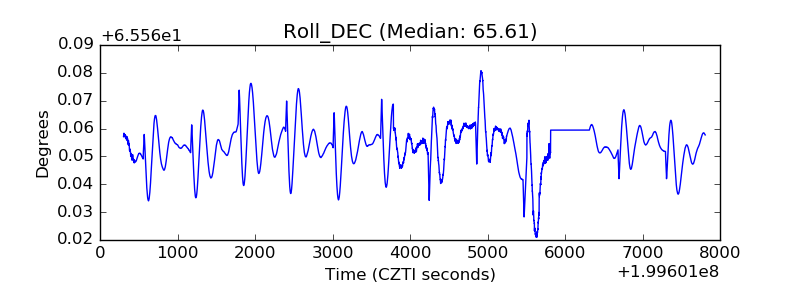 |
| _Roll_RA | 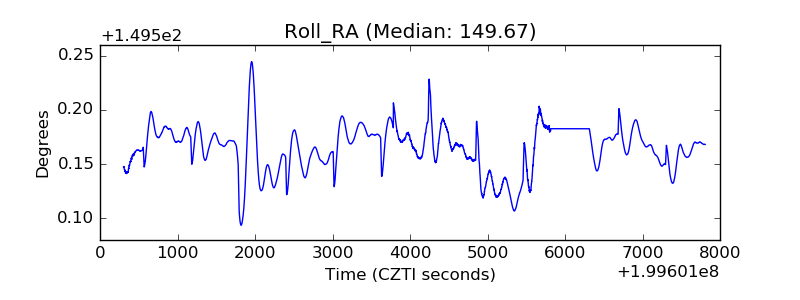 |
| Veto Counter | 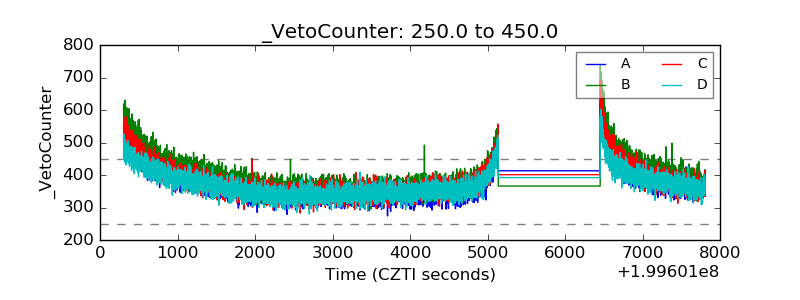 |