| Param | Original file | Final file |
|---|---|---|
| Filename | modeM0/AS1G05_218T02_9000000434_03171cztM0_level2.evt | modeM0/AS1G05_218T02_9000000434_03171cztM0_level2_quad_clean.evt |
| Size (bytes) | 454,392,000 | 88,905,600 |
| Size | 433.3 MB | 84.8 MB |
| Events in quadrant A | 3,056,353 | 572,368 |
| Events in quadrant B | 3,363,759 | 578,301 |
| Events in quadrant C | 3,640,682 | 552,399 |
| Events in quadrant D | 3,263,841 | 541,327 |
| Mode SS | |||
|---|---|---|---|
| Quadrant | BADHDUFLAG | Total packets | Discarded packets |
| A | 0 | 130 | 0 |
| B | 0 | 130 | 0 |
| C | 0 | 130 | 0 |
| D | 0 | 130 | 0 |
| Mode M0 | |||
|---|---|---|---|
| Quadrant | BADHDUFLAG | Total packets | Discarded packets |
| A | 0 | 13485 | 3 |
| B | 0 | 14240 | 2 |
| C | 0 | 15416 | 2 |
| D | 0 | 14396 | 2 |
| Mode M9 | |||
|---|---|---|---|
| Quadrant | BADHDUFLAG | Total packets | Discarded packets |
| A | 0 | 12 | 0 |
| B | 0 | 12 | 0 |
| C | 0 | 12 | 0 |
| D | 0 | 13 | 0 |
| Quadrant | Total seconds | Saturated seconds | Saturation percentage |
|---|---|---|---|
| A | 6421 | 88 | 1.370503% |
| B | 6421 | 145 | 2.258215% |
| C | 6421 | 264 | 4.111509% |
| D | 6421 | 142 | 2.211494% |
Noise dominated data is calculated using 1-second bins in cleaned event files. If a bin has >2000 counts, and if more than 50% of those come from <1% of pixels, then it is considered to be noise-dominated and hence unusable.
| Quadrant | # 1 sec bins | Bins with >0 counts | Bins with >2000 counts | High rate bins dominated by noise | Noise dominated (total time) | Noise dominated (detector-on time) | Marked lightcurve |
|---|---|---|---|---|---|---|---|
| A | 7632 | 6422 | 7 | 7 | 0.09% | 0.11% |  |
| B | 7632 | 6421 | 32 | 32 | 0.42% | 0.50% |  |
| C | 7632 | 6422 | 188 | 188 | 2.46% | 2.93% | 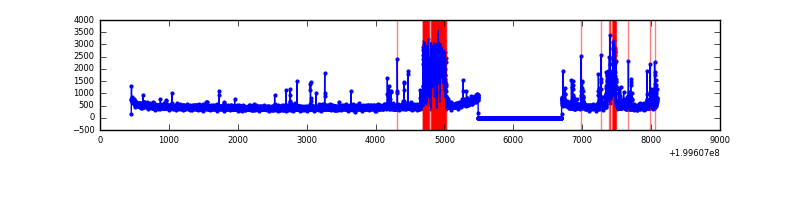 |
| D | 7632 | 6422 | 84 | 84 | 1.10% | 1.31% |  |
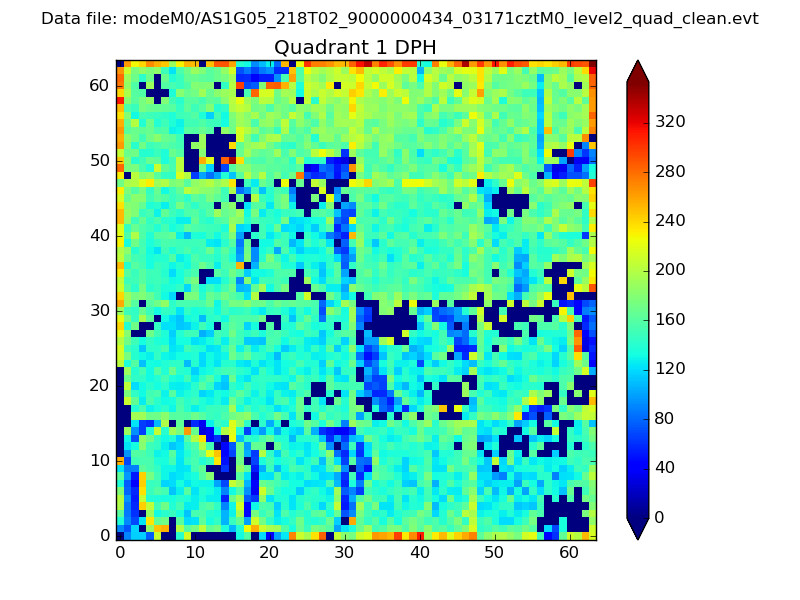
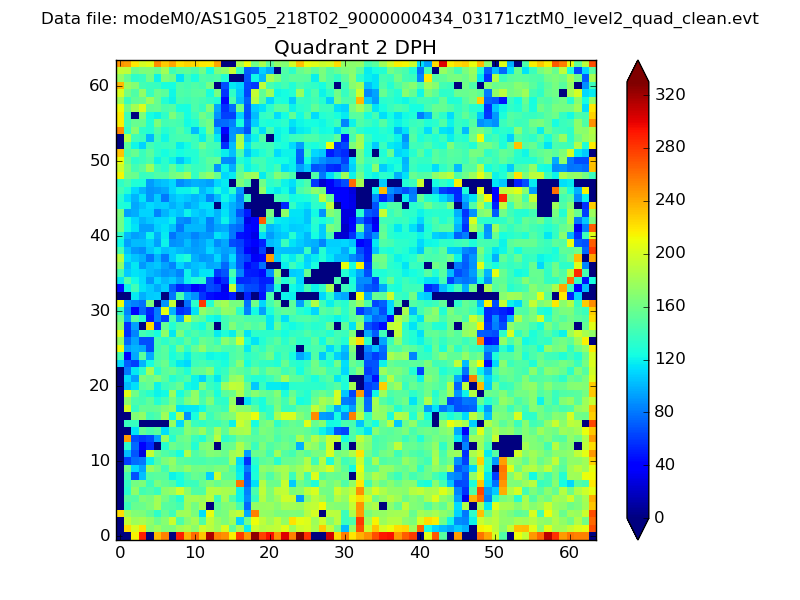
Top three noisy pixels from each quadrant. If the there are fewer than three noisy pixels in the level2.evt file, extra rows are filled as -1
| Pixel properties | Quadrant properties | ||||||
|---|---|---|---|---|---|---|---|
| Quadrant | DetID | PixID | Counts | Sigma | Mean | Median | Sigma |
| A | 0 | 128 | 57787 | 372.57 | 758 | 741 | 153.1 |
| A | 12 | 247 | 31795 | 202.82 | 758 | 741 | 153.1 |
| A | 0 | 149 | 28945 | 184.2 | 758 | 741 | 153.1 |
| B | 2 | 249 | 176523 | 1196.62 | 766 | 748 | 146.9 |
| B | 4 | 80 | 114994 | 777.75 | 766 | 748 | 146.9 |
| B | 15 | 85 | 28530 | 189.13 | 766 | 748 | 146.9 |
| C | 1 | 192 | 672510 | 4024.15 | 717 | 718 | 166.9 |
| C | 14 | 223 | 112508 | 669.64 | 717 | 718 | 166.9 |
| C | 6 | 80 | 25104 | 146.08 | 717 | 718 | 166.9 |
| D | 2 | 136 | 220161 | 1259.19 | 723 | 701 | 174.3 |
| D | 13 | 239 | 74868 | 425.55 | 723 | 701 | 174.3 |
| D | 13 | 223 | 72705 | 413.14 | 723 | 701 | 174.3 |
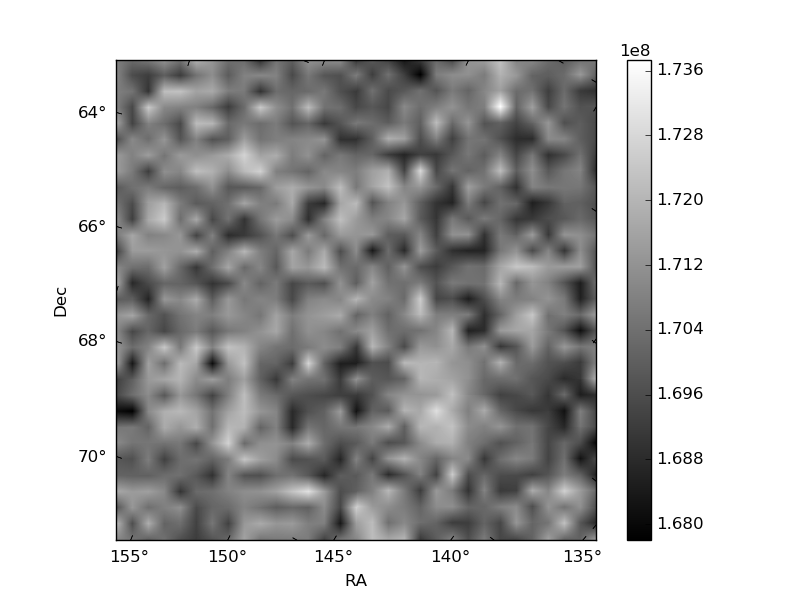
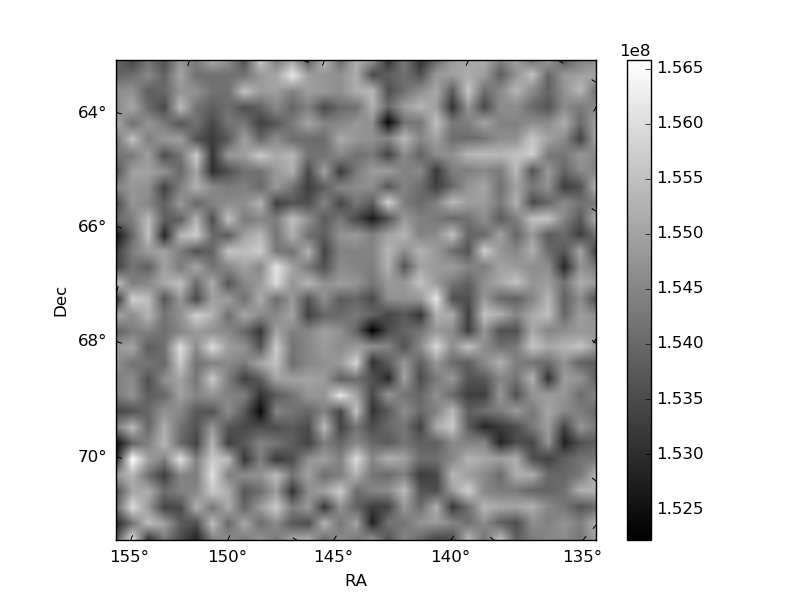
Histogram calculated using DETX and DETY for each event in the final _common_clean file
| Quadrant A |  |
 |
Quadrant B |
|---|---|---|---|
| Quadrant D |  |
 |
Quadrant C |
| Plot type | Count rate plots | Images |
|---|---|---|
| Comparison with Poisson distribution Blue bars denote a histogram of data divided into 1 sec bins. Red curve is a Poisson curve with rate = median count rate of data. |
 |
 |
| Quadrant-wise count rates Data is divided into 100 sec bins |
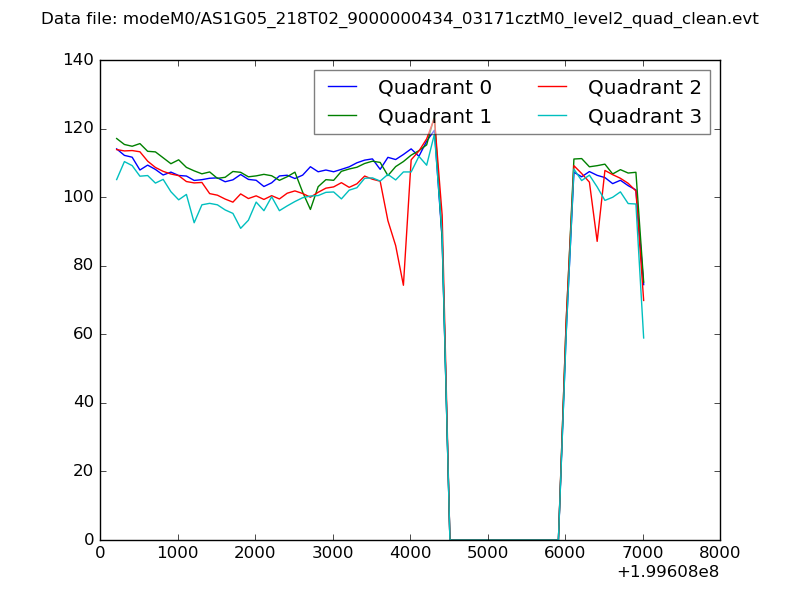 |
|
| Module-wise count rates for Quadrant A Data is divided into 100 sec bins |
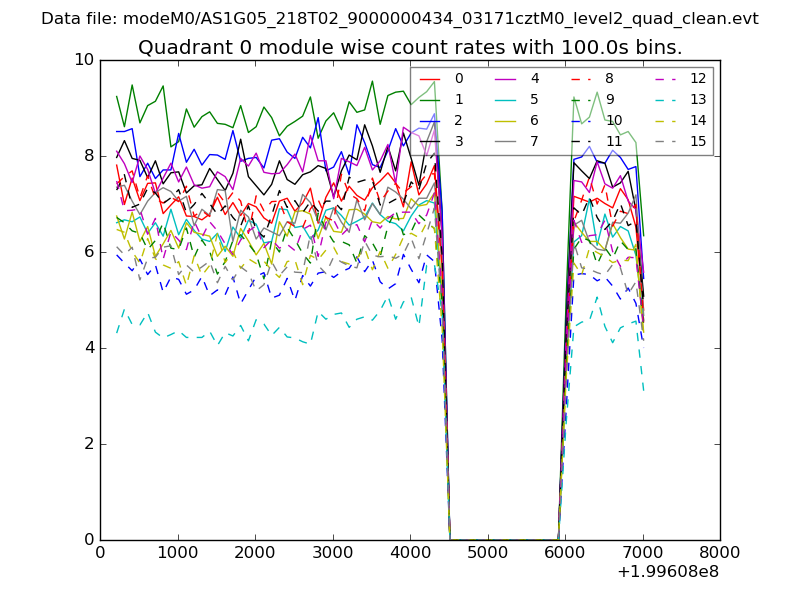 |
 |
| Module-wise count rates for Quadrant B Data is divided into 100 sec bins |
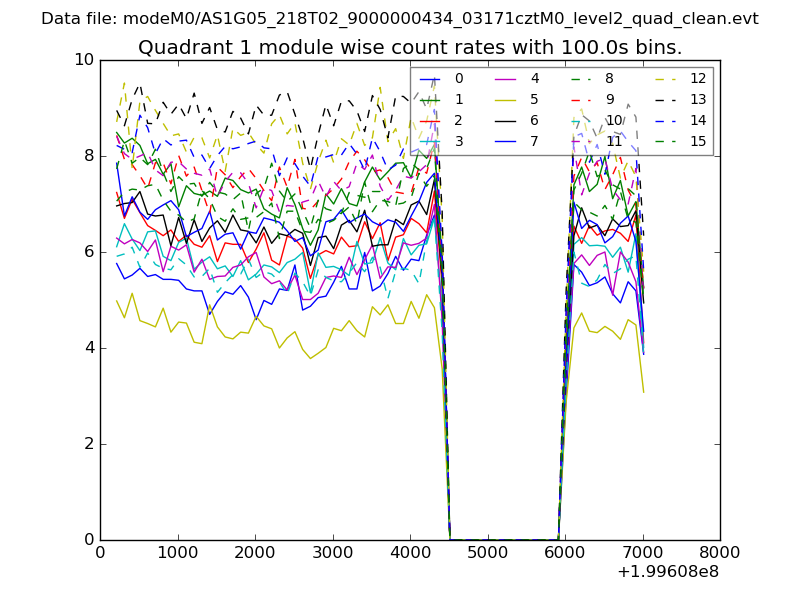 |
 |
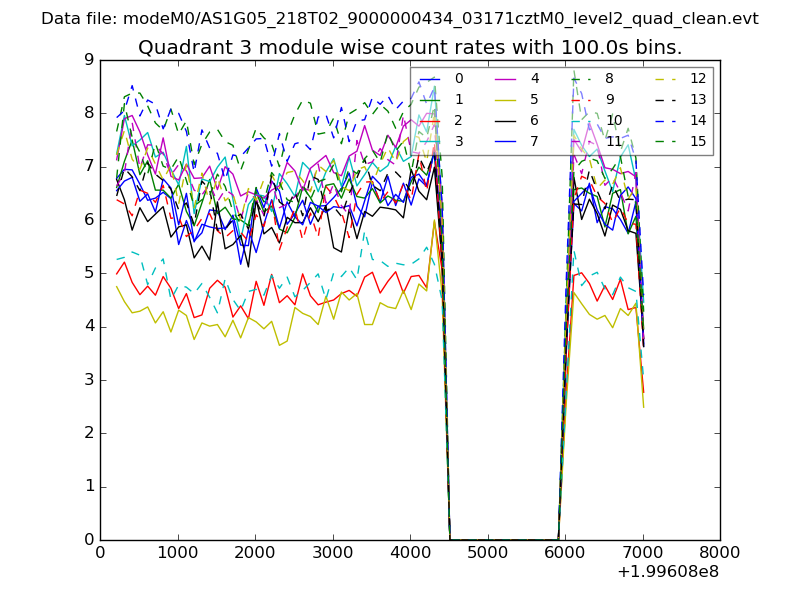
| Module-wise count rates for Quadrant C Data is divided into 100 sec bins |
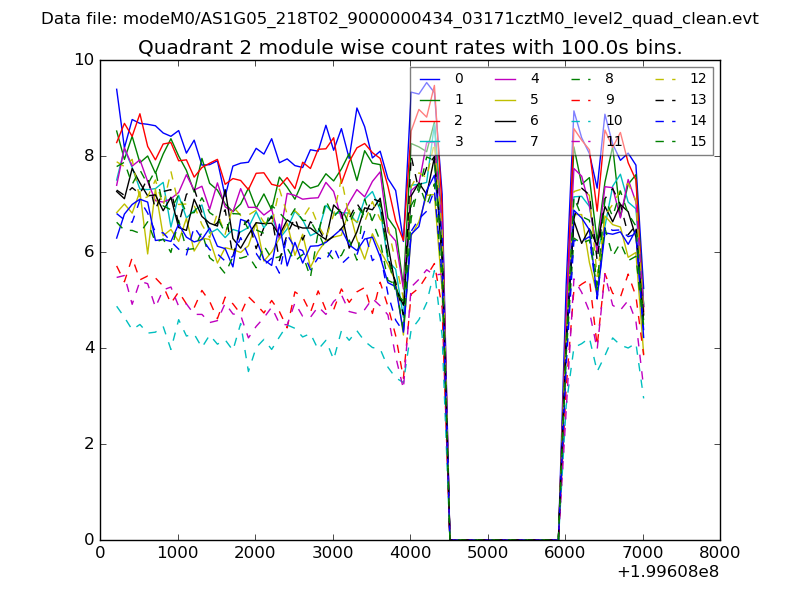 |
 |
| Module-wise count rates for Quadrant D Data is divided into 100 sec bins |
 |
 |
| Parameter | Plot |
|---|---|
| CZT HV Monitor | 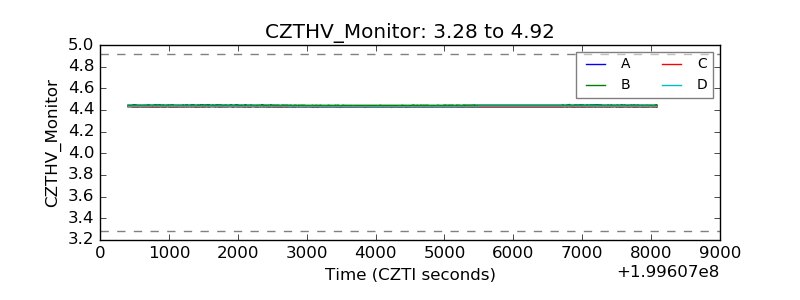 |
| D_VDD | 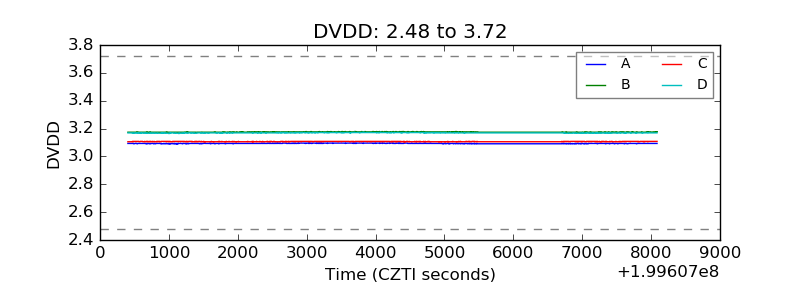 |
| Temperature 1 | 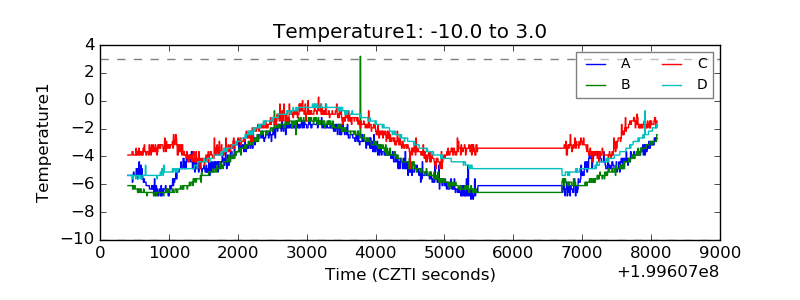 |
| Veto HV Monitor | 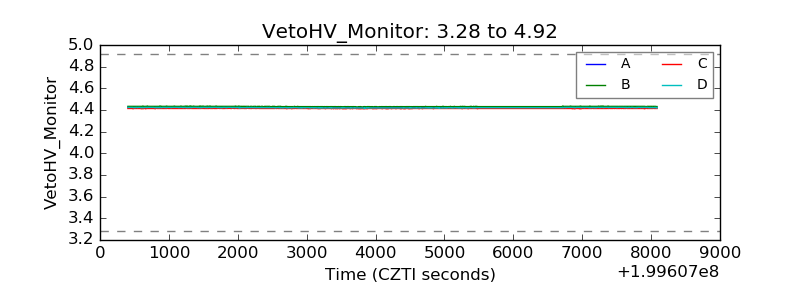 |
| Veto LLD |  |
| Alpha Counter | 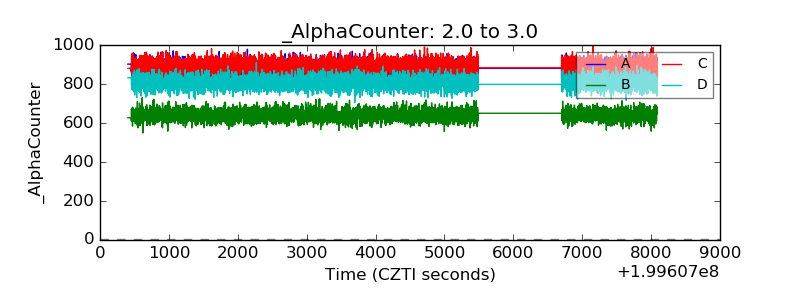 |
| _CPM_Rate | 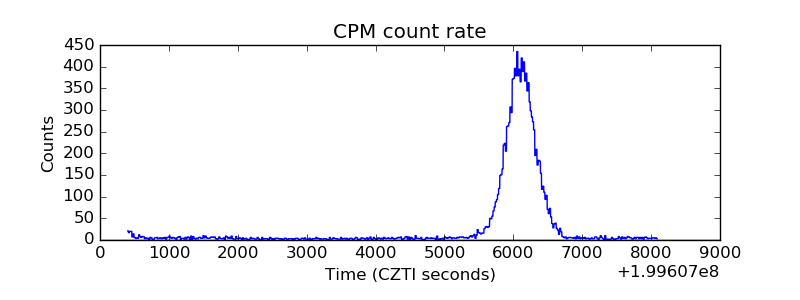 |
| CZT Counter | 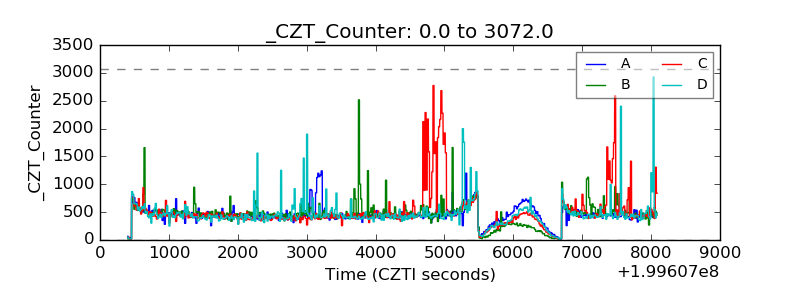 |
| +2.5 Volts monitor |  |
| +5 Volts monitor |  |
| Veto Counter | 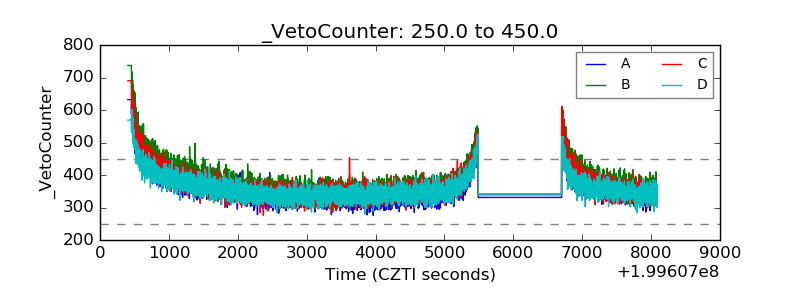 |