| Param | Original file | Final file |
|---|---|---|
| Filename | modeM0/AS1G05_218T02_9000000434_03172cztM0_level2.evt | modeM0/AS1G05_218T02_9000000434_03172cztM0_level2_quad_clean.evt |
| Size (bytes) | 450,066,240 | 96,163,200 |
| Size | 429.2 MB | 91.7 MB |
| Events in quadrant A | 2,747,818 | 636,655 |
| Events in quadrant B | 3,034,108 | 639,555 |
| Events in quadrant C | 3,842,406 | 611,485 |
| Events in quadrant D | 3,590,932 | 598,052 |
| Mode SS | |||
|---|---|---|---|
| Quadrant | BADHDUFLAG | Total packets | Discarded packets |
| A | 0 | 124 | 0 |
| B | 0 | 124 | 0 |
| C | 0 | 124 | 0 |
| D | 0 | 124 | 0 |
| Mode M0 | |||
|---|---|---|---|
| Quadrant | BADHDUFLAG | Total packets | Discarded packets |
| A | 0 | 12599 | 2 |
| B | 0 | 13162 | 1 |
| C | 0 | 15758 | 1 |
| D | 0 | 15127 | 1 |
| Mode M9 | |||
|---|---|---|---|
| Quadrant | BADHDUFLAG | Total packets | Discarded packets |
| A | 0 | 9 | 0 |
| B | 0 | 9 | 0 |
| C | 0 | 9 | 0 |
| D | 0 | 9 | 0 |
| Quadrant | Total seconds | Saturated seconds | Saturation percentage |
|---|---|---|---|
| A | 6104 | 102 | 1.671035% |
| B | 6104 | 140 | 2.293578% |
| C | 6104 | 338 | 5.537353% |
| D | 6104 | 271 | 4.439712% |
Noise dominated data is calculated using 1-second bins in cleaned event files. If a bin has >2000 counts, and if more than 50% of those come from <1% of pixels, then it is considered to be noise-dominated and hence unusable.
| Quadrant | # 1 sec bins | Bins with >0 counts | Bins with >2000 counts | High rate bins dominated by noise | Noise dominated (total time) | Noise dominated (detector-on time) | Marked lightcurve |
|---|---|---|---|---|---|---|---|
| A | 7009 | 6104 | 7 | 7 | 0.10% | 0.11% | 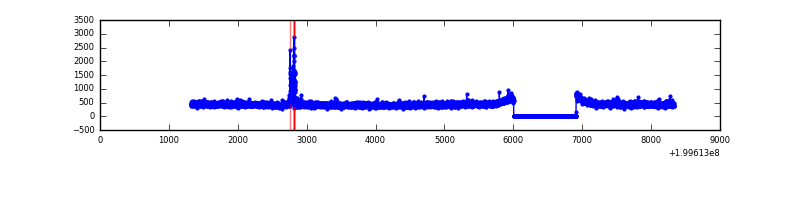 |
| B | 7009 | 6104 | 15 | 15 | 0.21% | 0.25% | 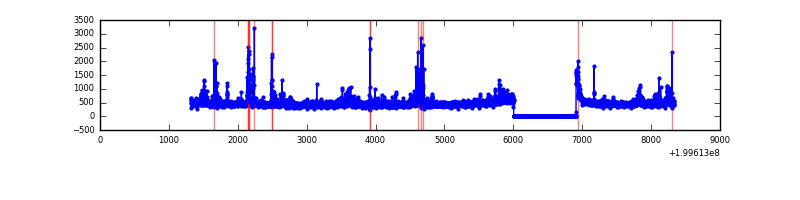 |
| C | 7009 | 6104 | 230 | 230 | 3.28% | 3.77% |  |
| D | 7009 | 6104 | 177 | 177 | 2.53% | 2.90% | 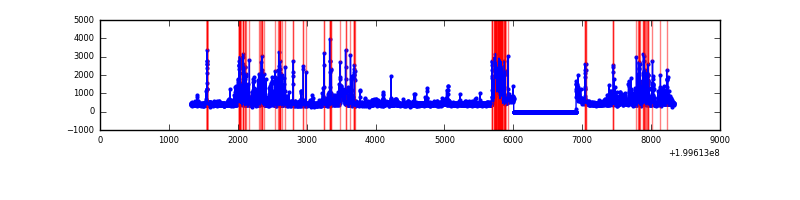 |
Top three noisy pixels from each quadrant. If the there are fewer than three noisy pixels in the level2.evt file, extra rows are filled as -1
| Pixel properties | Quadrant properties | ||||||
|---|---|---|---|---|---|---|---|
| Quadrant | DetID | PixID | Counts | Sigma | Mean | Median | Sigma |
| A | 12 | 247 | 66729 | 469.47 | 692 | 676 | 140.7 |
| A | 0 | 226 | 7939 | 51.62 | 692 | 676 | 140.7 |
| A | 12 | 194 | 7581 | 49.08 | 692 | 676 | 140.7 |
| B | 4 | 80 | 160324 | 1193.07 | 696 | 678 | 133.8 |
| B | 4 | 70 | 40236 | 295.63 | 696 | 678 | 133.8 |
| B | 0 | 219 | 28814 | 210.27 | 696 | 678 | 133.8 |
| C | 1 | 192 | 1078298 | 7092.35 | 653 | 654 | 151.9 |
| C | 14 | 223 | 145884 | 955.81 | 653 | 654 | 151.9 |
| C | 6 | 80 | 50497 | 328.03 | 653 | 654 | 151.9 |
| D | 2 | 136 | 480812 | 3003.01 | 659 | 638 | 159.9 |
| D | 10 | 199 | 340689 | 2126.68 | 659 | 638 | 159.9 |
| D | 7 | 39 | 84589 | 525.03 | 659 | 638 | 159.9 |
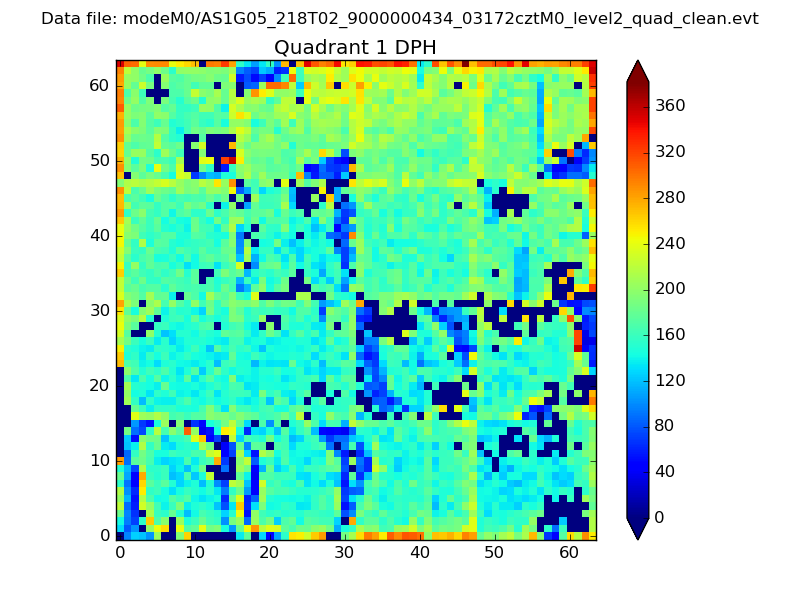
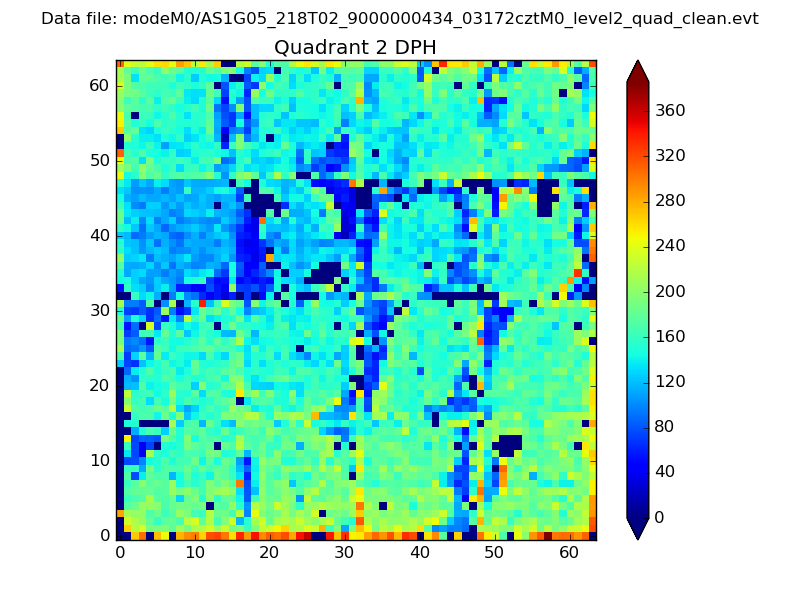
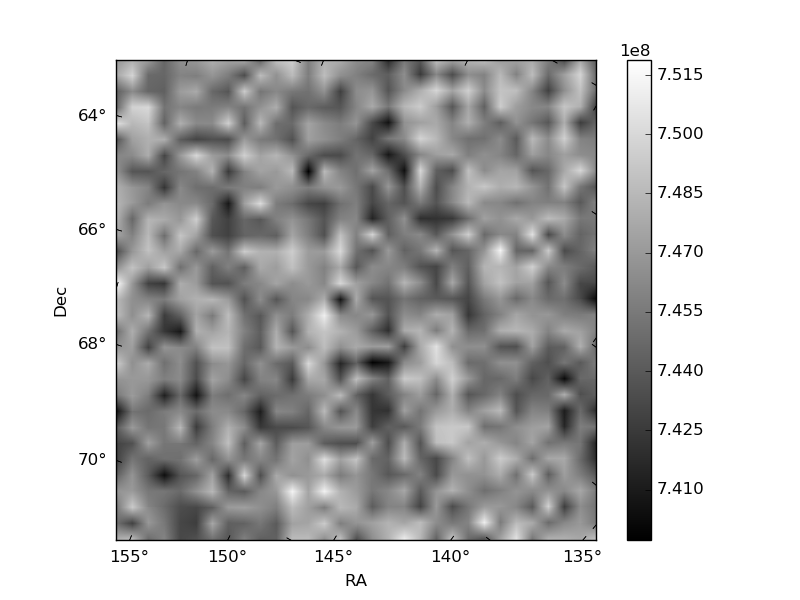
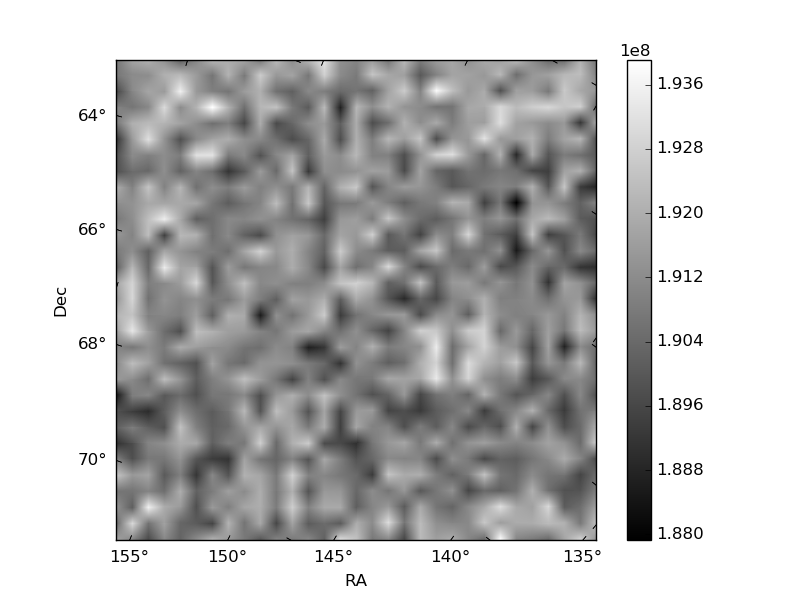
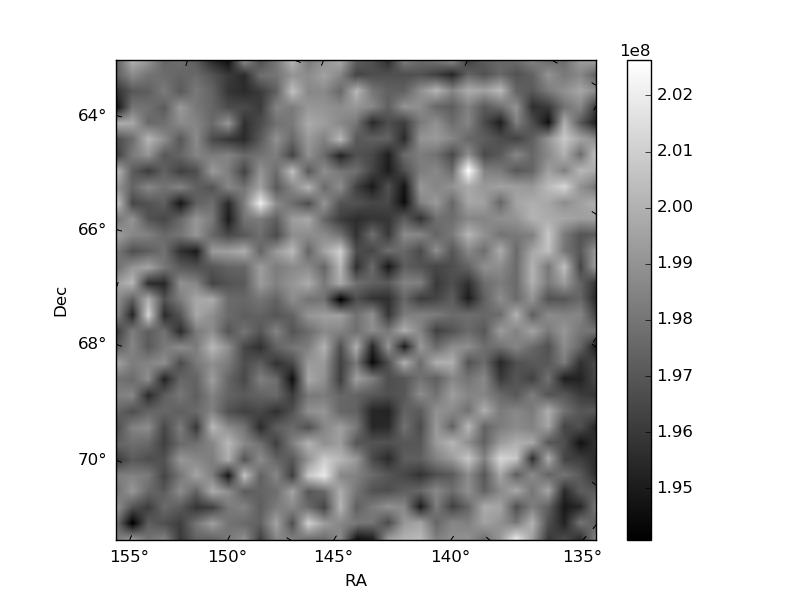
Histogram calculated using DETX and DETY for each event in the final _common_clean file
| Quadrant A | 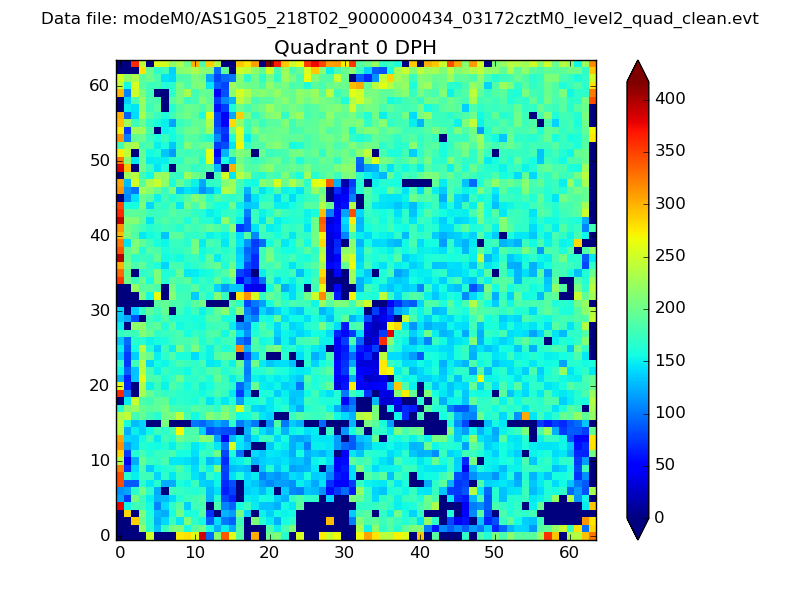 |
 |
Quadrant B |
|---|---|---|---|
| Quadrant D | 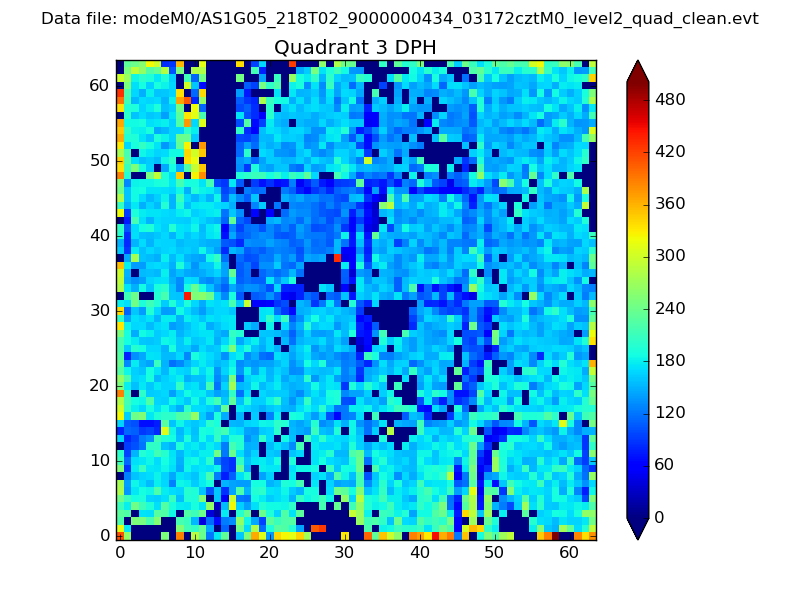 |
 |
Quadrant C |
| Plot type | Count rate plots | Images |
|---|---|---|
| Comparison with Poisson distribution Blue bars denote a histogram of data divided into 1 sec bins. Red curve is a Poisson curve with rate = median count rate of data. |
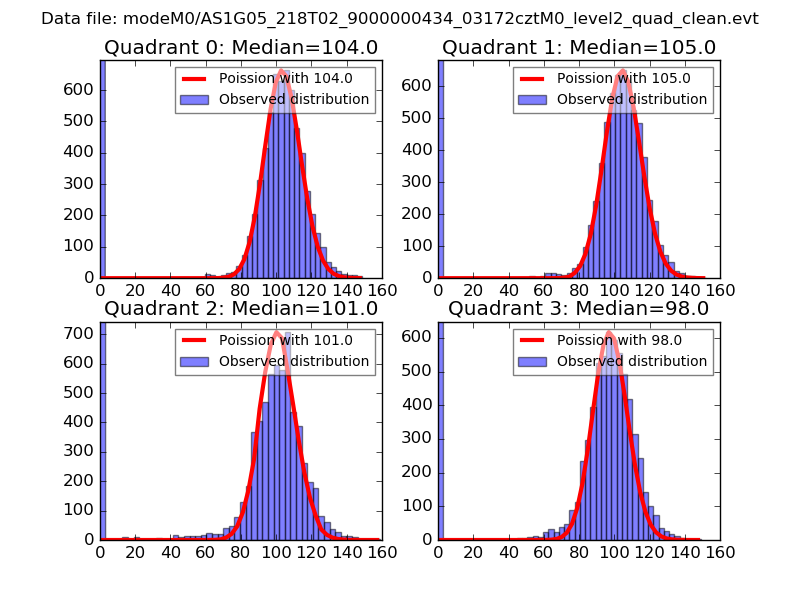 |
 |
| Quadrant-wise count rates Data is divided into 100 sec bins |
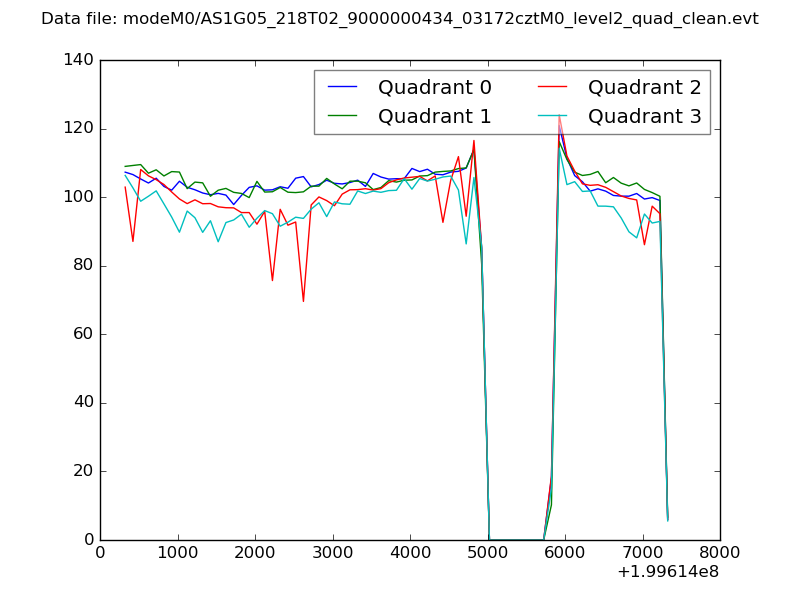 |
|
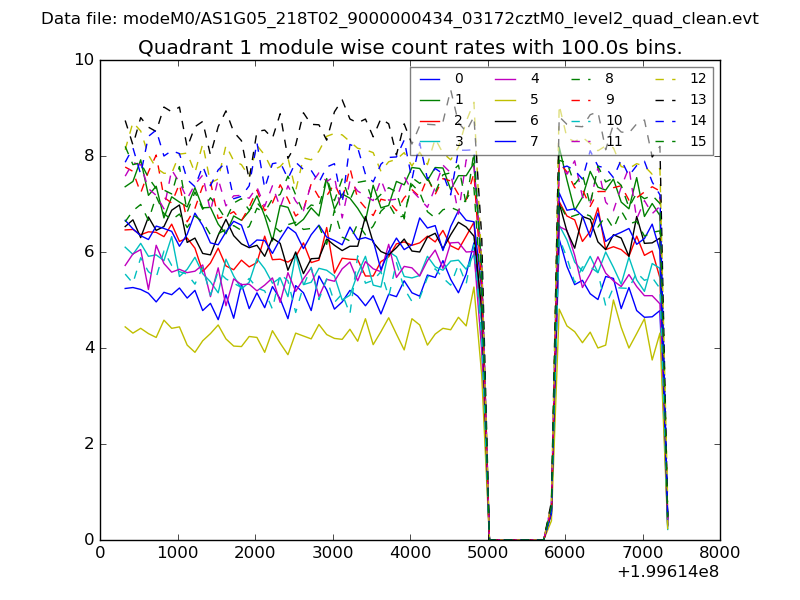
| Module-wise count rates for Quadrant A Data is divided into 100 sec bins |
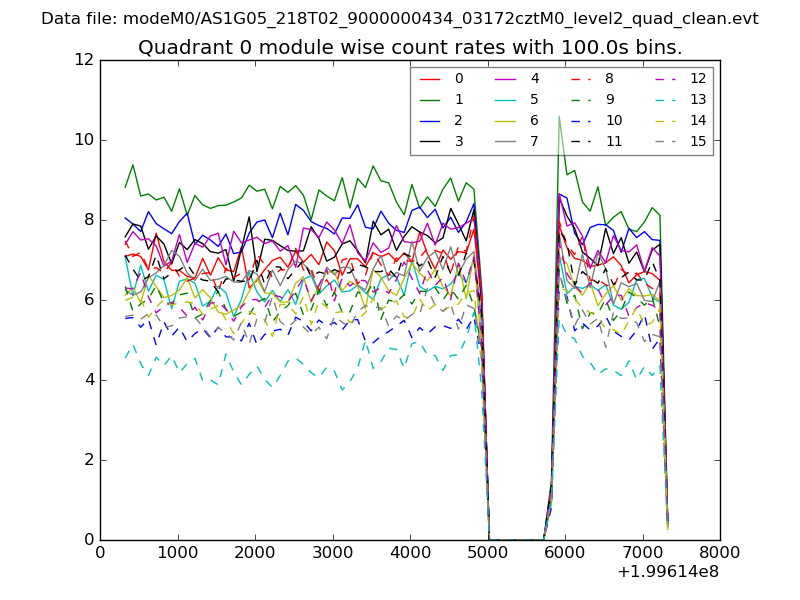 |
 |
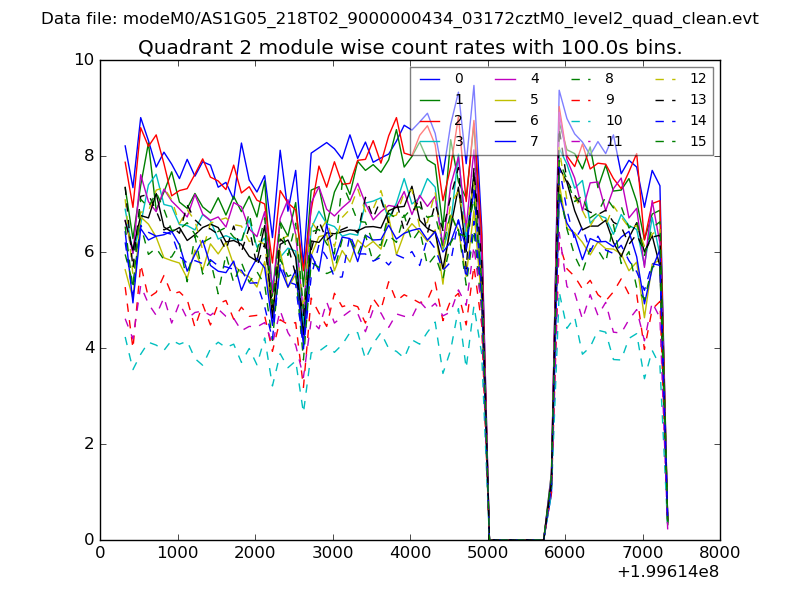
| Module-wise count rates for Quadrant B Data is divided into 100 sec bins |
 |
 |
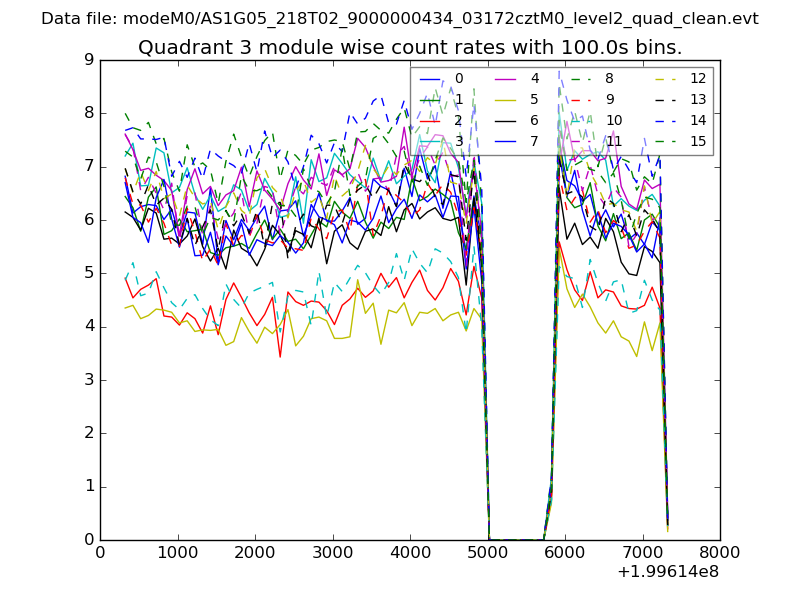
| Module-wise count rates for Quadrant C Data is divided into 100 sec bins |
 |
 |
| Module-wise count rates for Quadrant D Data is divided into 100 sec bins |
 |
 |
| Parameter | Plot |
|---|---|
| CZT HV Monitor | 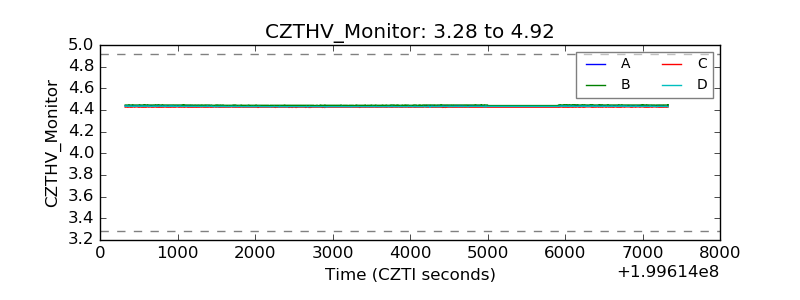 |
| D_VDD | 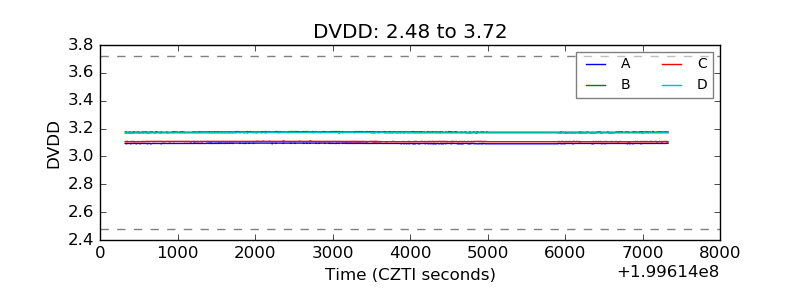 |
| Temperature 1 | 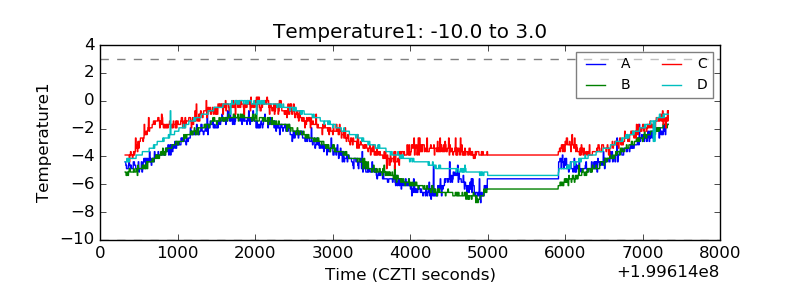 |
| Veto HV Monitor | 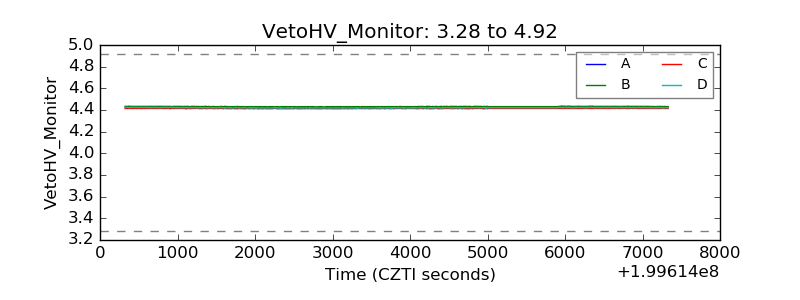 |
| Veto LLD | 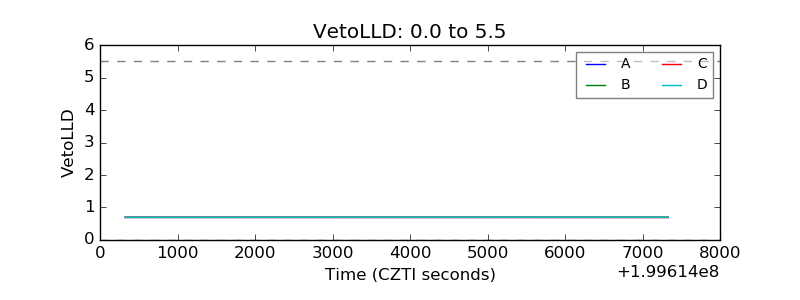 |
| Alpha Counter | 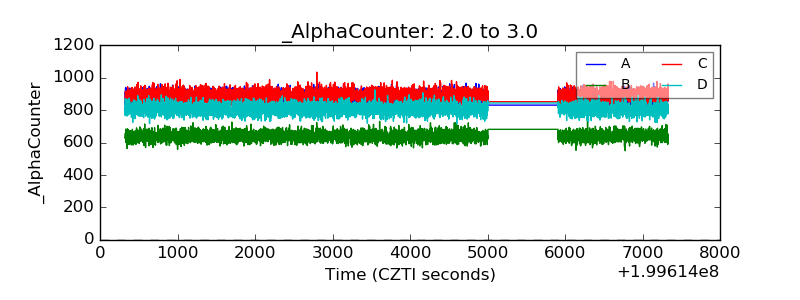 |
| _CPM_Rate | 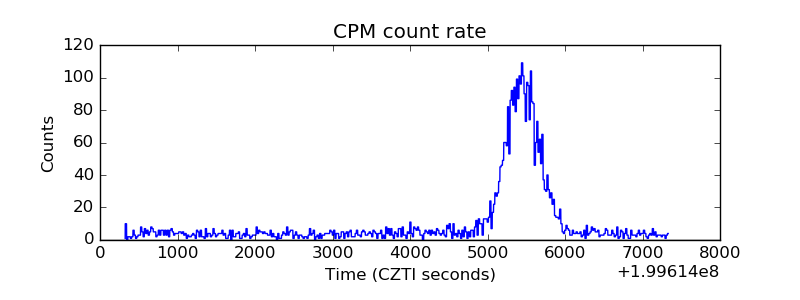 |
| CZT Counter | 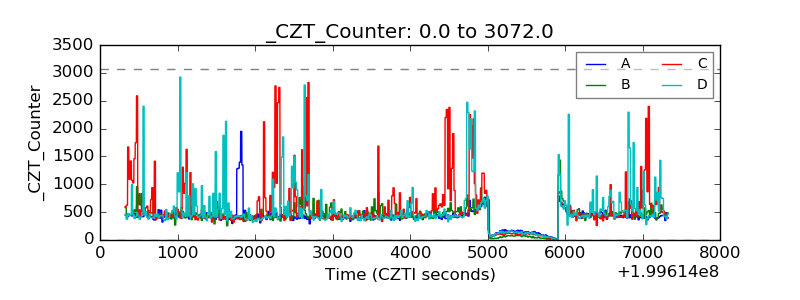 |
| +2.5 Volts monitor | 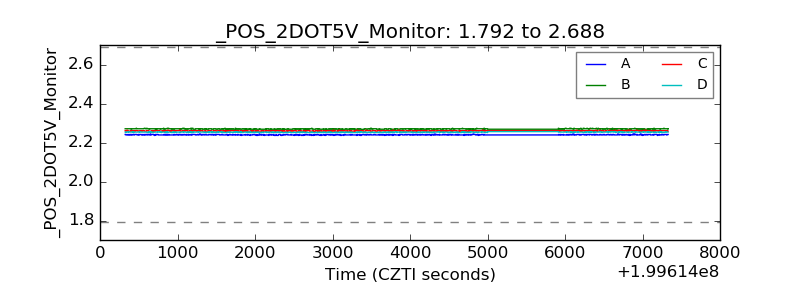 |
| +5 Volts monitor |  |
| _ROLL_ROT | 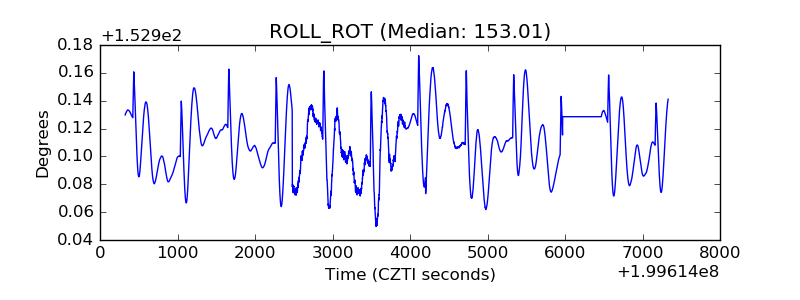 |
| _Roll_DEC | 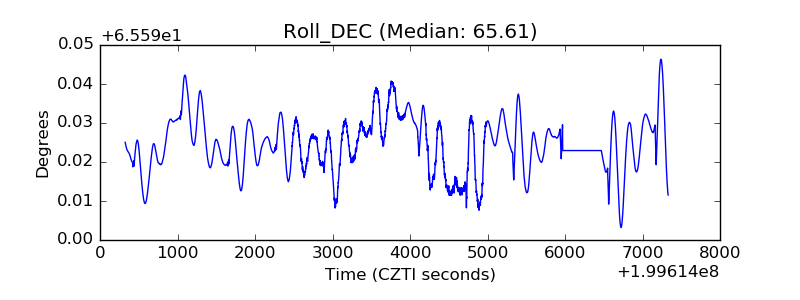 |
| _Roll_RA | 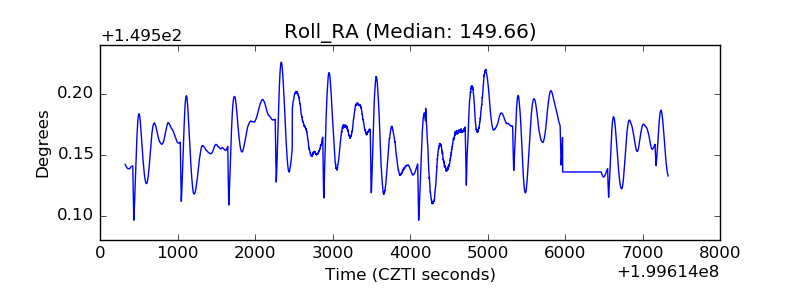 |
| Veto Counter | 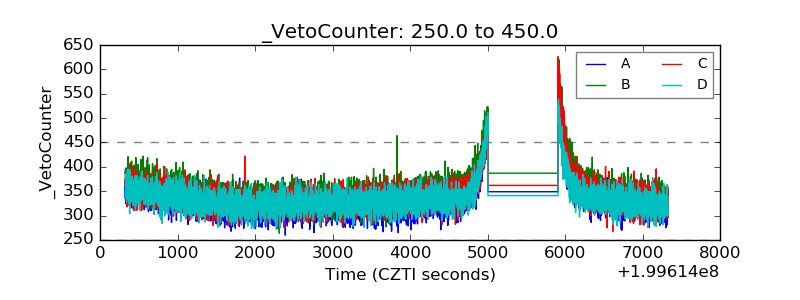 |