| Param | Original file | Final file |
|---|---|---|
| Filename | modeM0/AS1G05_218T02_9000000434_03173cztM0_level2.evt | modeM0/AS1G05_218T02_9000000434_03173cztM0_level2_quad_clean.evt |
| Size (bytes) | 521,303,040 | 96,701,760 |
| Size | 497.2 MB | 92.2 MB |
| Events in quadrant A | 3,269,685 | 625,590 |
| Events in quadrant B | 3,439,216 | 631,183 |
| Events in quadrant C | 3,694,876 | 607,746 |
| Events in quadrant D | 4,904,787 | 572,590 |
| Mode SS | |||
|---|---|---|---|
| Quadrant | BADHDUFLAG | Total packets | Discarded packets |
| A | 0 | 144 | 0 |
| B | 0 | 144 | 0 |
| C | 0 | 144 | 0 |
| D | 0 | 144 | 0 |
| Mode M0 | |||
|---|---|---|---|
| Quadrant | BADHDUFLAG | Total packets | Discarded packets |
| A | 0 | 14867 | 2 |
| B | 0 | 15207 | 1 |
| C | 0 | 16040 | 1 |
| D | 0 | 19649 | 1 |
| Mode M9 | |||
|---|---|---|---|
| Quadrant | BADHDUFLAG | Total packets | Discarded packets |
| A | 0 | 4 | 0 |
| B | 0 | 4 | 0 |
| C | 0 | 4 | 0 |
| D | 0 | 4 | 0 |
| Quadrant | Total seconds | Saturated seconds | Saturation percentage |
|---|---|---|---|
| A | 7050 | 147 | 2.085106% |
| B | 7050 | 118 | 1.673759% |
| C | 7050 | 192 | 2.723404% |
| D | 7050 | 570 | 8.085106% |
Noise dominated data is calculated using 1-second bins in cleaned event files. If a bin has >2000 counts, and if more than 50% of those come from <1% of pixels, then it is considered to be noise-dominated and hence unusable.
| Quadrant | # 1 sec bins | Bins with >0 counts | Bins with >2000 counts | High rate bins dominated by noise | Noise dominated (total time) | Noise dominated (detector-on time) | Marked lightcurve |
|---|---|---|---|---|---|---|---|
| A | 7460 | 7050 | 5 | 5 | 0.07% | 0.07% | 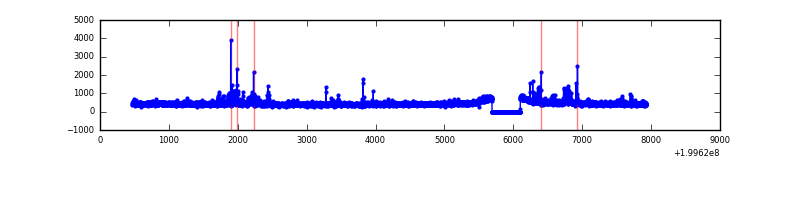 |
| B | 7460 | 7051 | 14 | 14 | 0.19% | 0.20% |  |
| C | 7460 | 7051 | 78 | 78 | 1.05% | 1.11% |  |
| D | 7460 | 7050 | 393 | 393 | 5.27% | 5.57% | 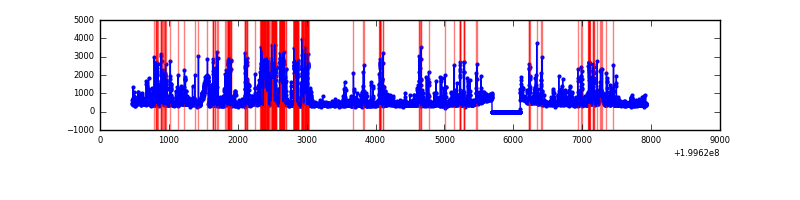 |
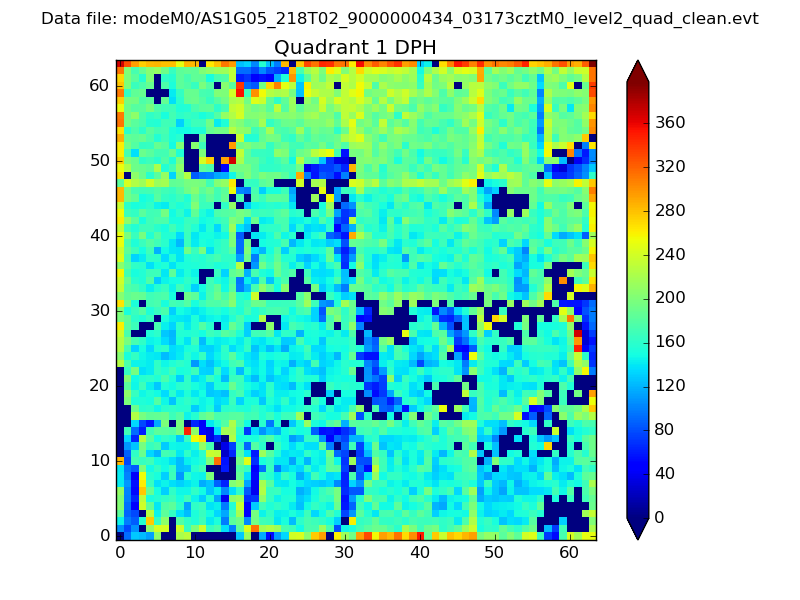
Top three noisy pixels from each quadrant. If the there are fewer than three noisy pixels in the level2.evt file, extra rows are filled as -1
| Pixel properties | Quadrant properties | ||||||
|---|---|---|---|---|---|---|---|
| Quadrant | DetID | PixID | Counts | Sigma | Mean | Median | Sigma |
| A | 14 | 249 | 158680 | 975.75 | 792 | 773 | 161.8 |
| A | 12 | 247 | 30684 | 184.83 | 792 | 773 | 161.8 |
| A | 3 | 1 | 16645 | 98.08 | 792 | 773 | 161.8 |
| B | 4 | 80 | 168308 | 1081.54 | 800 | 781 | 154.9 |
| B | 2 | 249 | 45765 | 290.41 | 800 | 781 | 154.9 |
| B | 0 | 219 | 33118 | 208.77 | 800 | 781 | 154.9 |
| C | 1 | 192 | 634437 | 3563.13 | 762 | 762 | 177.8 |
| C | 6 | 80 | 39058 | 215.34 | 762 | 762 | 177.8 |
| C | 14 | 223 | 28503 | 155.99 | 762 | 762 | 177.8 |
| D | 5 | 233 | 847603 | 4444.07 | 741 | 720 | 190.6 |
| D | 2 | 136 | 570765 | 2991.35 | 741 | 720 | 190.6 |
| D | 10 | 199 | 326442 | 1709.25 | 741 | 720 | 190.6 |
Histogram calculated using DETX and DETY for each event in the final _common_clean file
| Quadrant A | 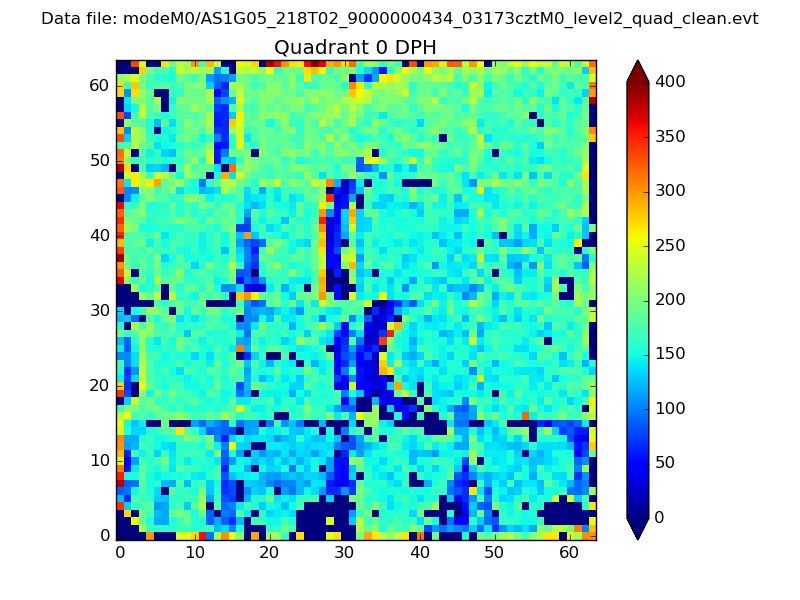 |
 |
Quadrant B |
|---|---|---|---|
| Quadrant D |  |
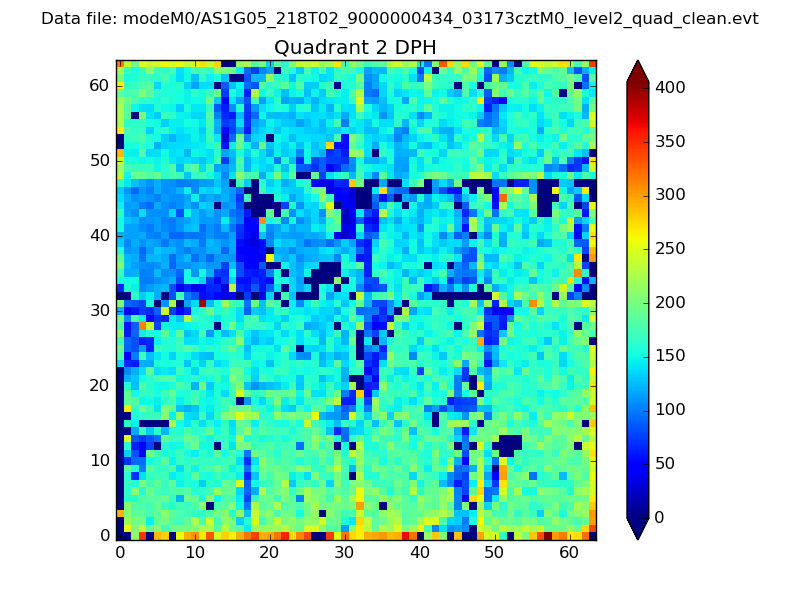 |
Quadrant C |
| Plot type | Count rate plots | Images |
|---|---|---|
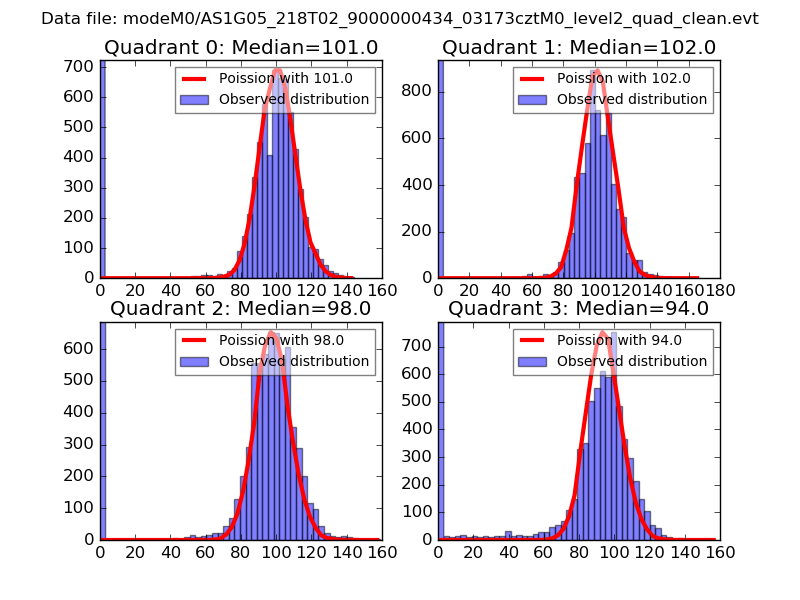
| Comparison with Poisson distribution Blue bars denote a histogram of data divided into 1 sec bins. Red curve is a Poisson curve with rate = median count rate of data. |
 |
 |
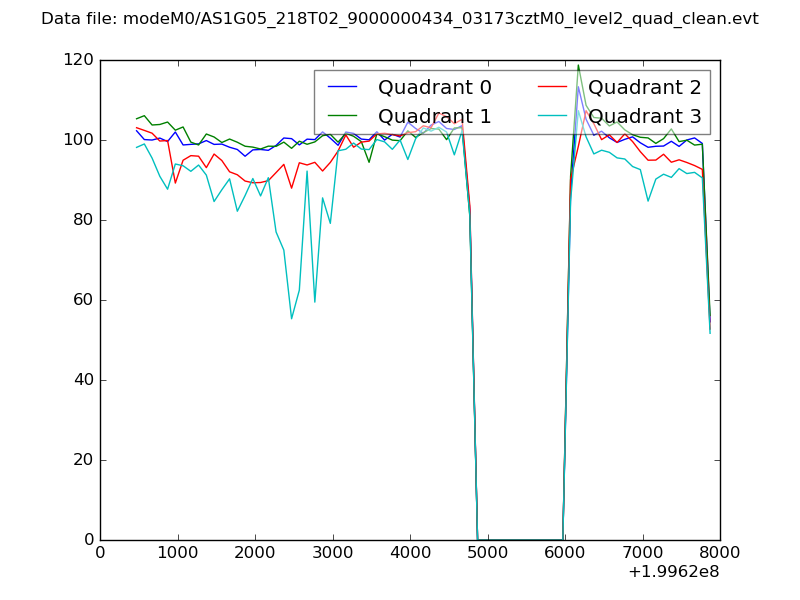
| Quadrant-wise count rates Data is divided into 100 sec bins |
 |
|
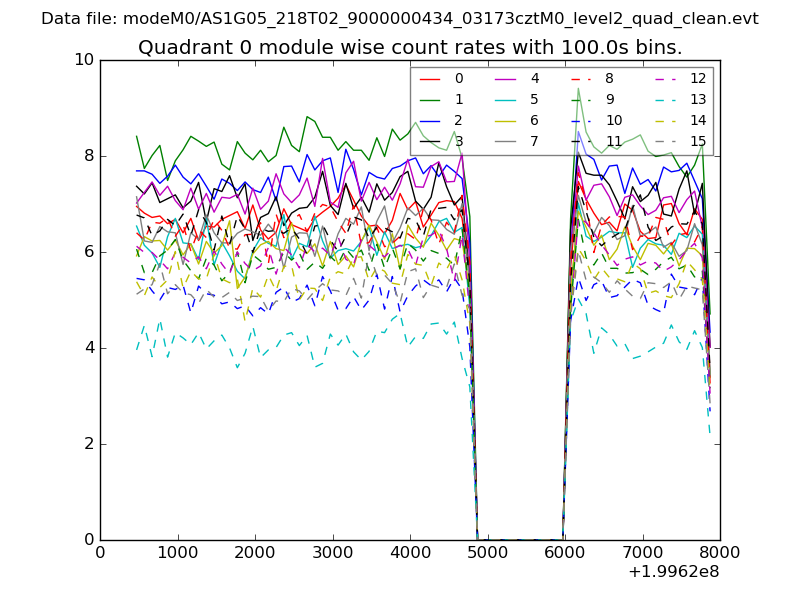
| Module-wise count rates for Quadrant A Data is divided into 100 sec bins |
 |
 |
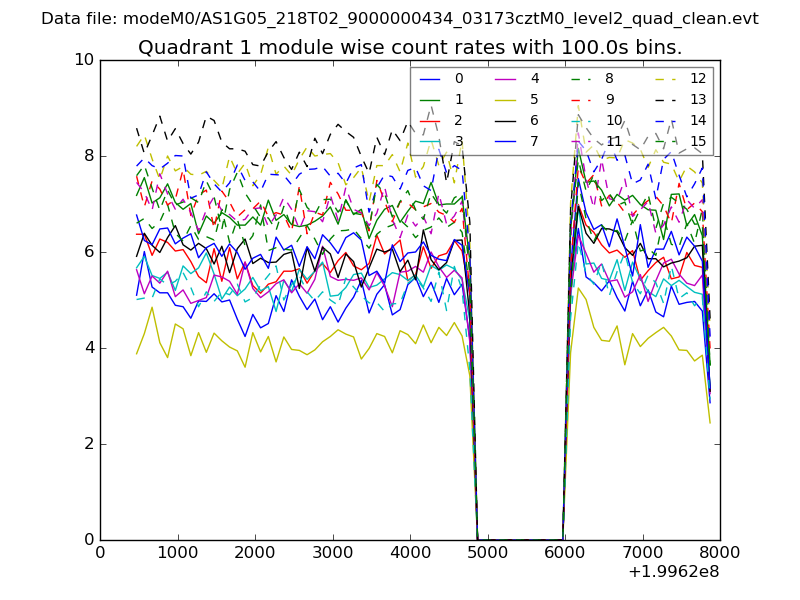
| Module-wise count rates for Quadrant B Data is divided into 100 sec bins |
 |
 |
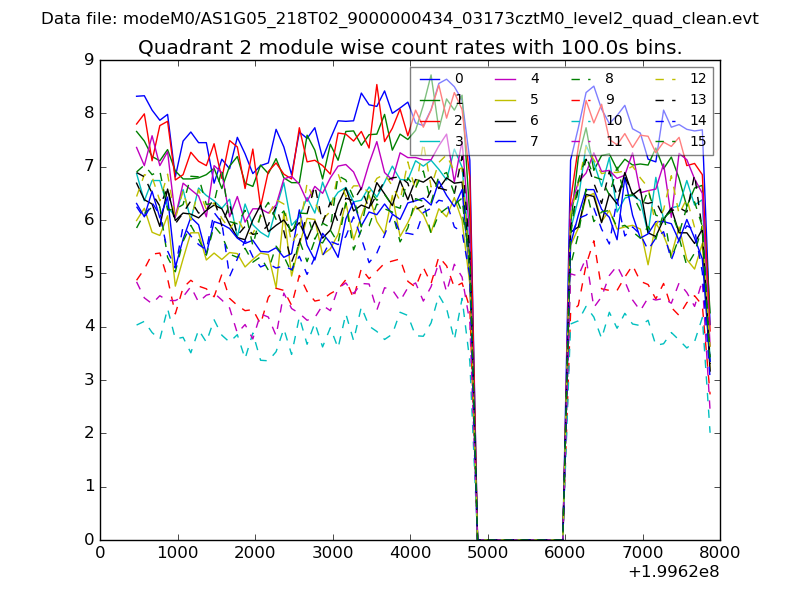
| Module-wise count rates for Quadrant C Data is divided into 100 sec bins |
 |
 |
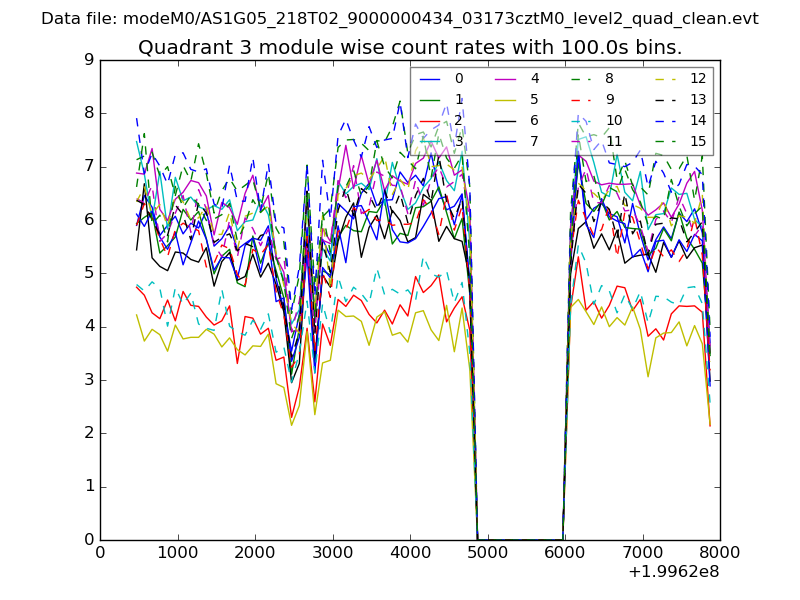
| Module-wise count rates for Quadrant D Data is divided into 100 sec bins |
 |
 |
| Parameter | Plot |
|---|---|
| CZT HV Monitor | 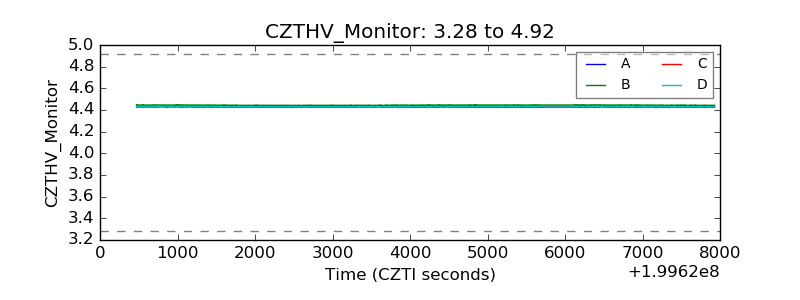 |
| D_VDD | 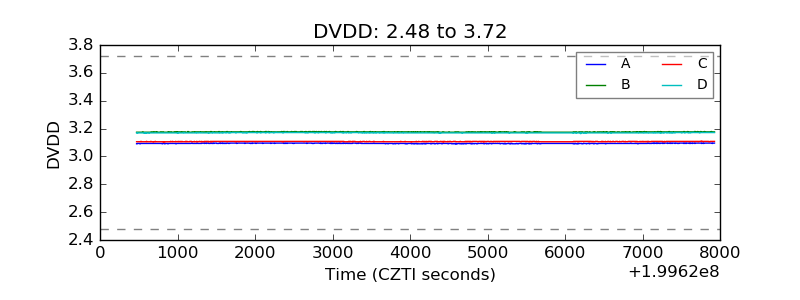 |
| Temperature 1 | 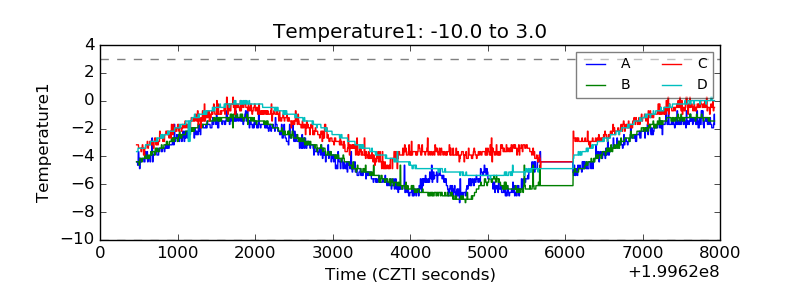 |
| Veto HV Monitor | 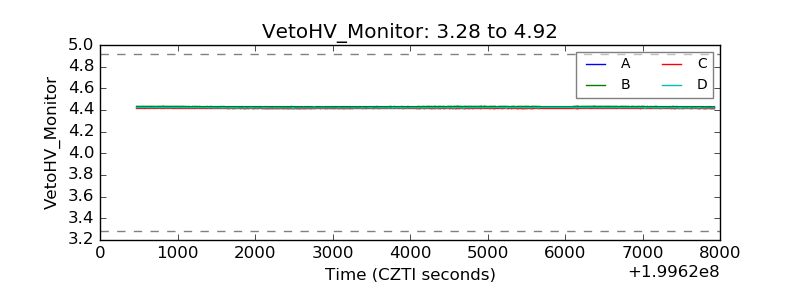 |
| Veto LLD | 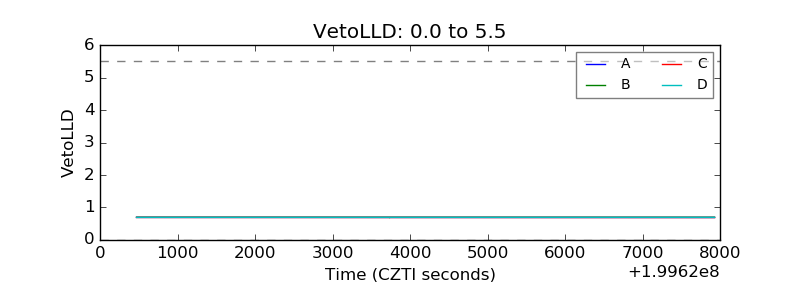 |
| Alpha Counter | 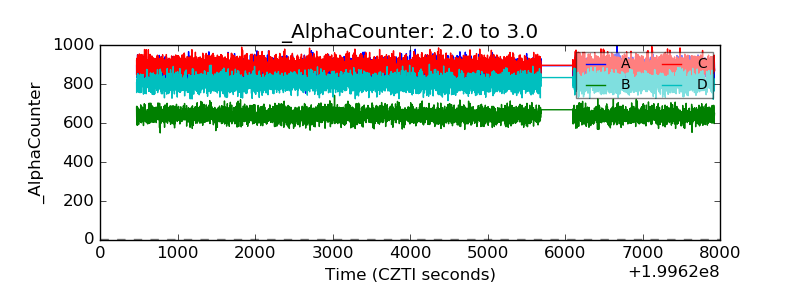 |
| _CPM_Rate | 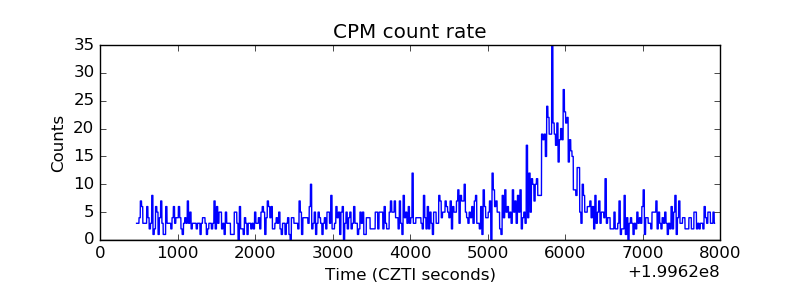 |
| CZT Counter | 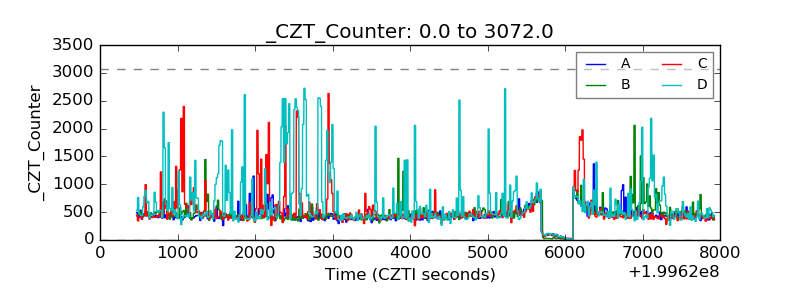 |
| +2.5 Volts monitor |  |
| +5 Volts monitor |  |
| _ROLL_ROT | 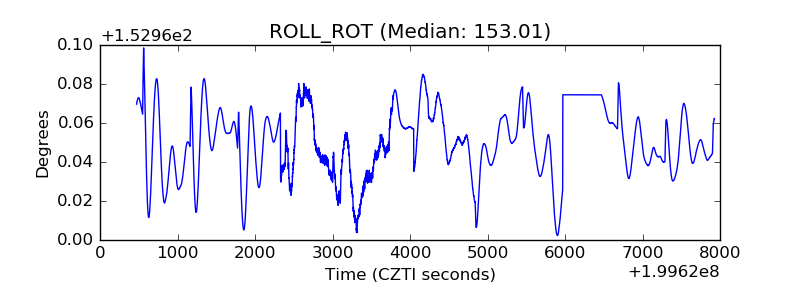 |
| _Roll_DEC | 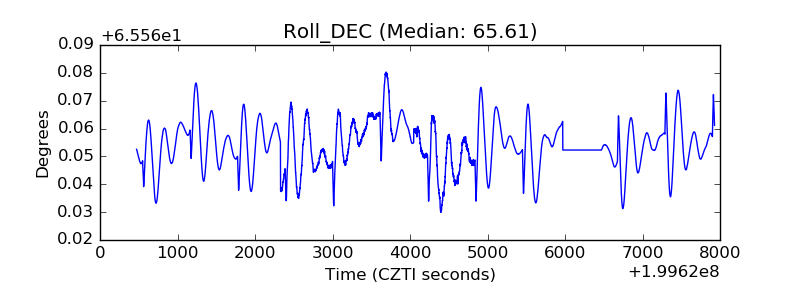 |
| _Roll_RA | 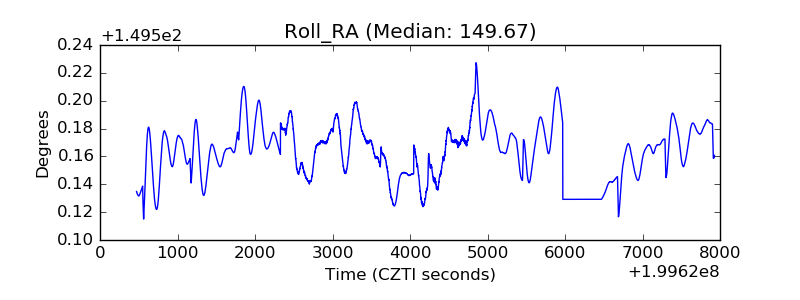 |
| Veto Counter | 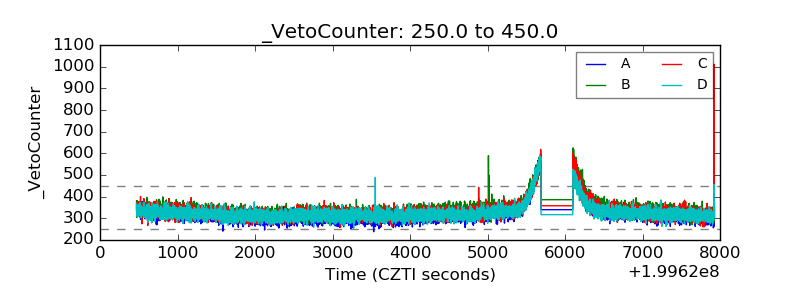 |