| Param | Original file | Final file |
|---|---|---|
| Filename | modeM0/AS1G05_218T02_9000000434_03174cztM0_level2.evt | modeM0/AS1G05_218T02_9000000434_03174cztM0_level2_quad_clean.evt |
| Size (bytes) | 576,146,880 | 104,618,880 |
| Size | 549.5 MB | 99.8 MB |
| Events in quadrant A | 4,070,908 | 669,310 |
| Events in quadrant B | 3,976,802 | 683,018 |
| Events in quadrant C | 3,649,552 | 666,439 |
| Events in quadrant D | 5,234,965 | 619,761 |
| Mode SS | |||
|---|---|---|---|
| Quadrant | BADHDUFLAG | Total packets | Discarded packets |
| A | 0 | 152 | 0 |
| B | 0 | 152 | 0 |
| C | 0 | 152 | 0 |
| D | 0 | 152 | 0 |
| Mode M0 | |||
|---|---|---|---|
| Quadrant | BADHDUFLAG | Total packets | Discarded packets |
| A | 0 | 17577 | 1 |
| B | 0 | 17199 | 0 |
| C | 0 | 16442 | 0 |
| D | 0 | 21030 | 0 |
| Quadrant | Total seconds | Saturated seconds | Saturation percentage |
|---|---|---|---|
| A | 7611 | 320 | 4.204441% |
| B | 7611 | 200 | 2.627776% |
| C | 7611 | 95 | 1.248193% |
| D | 7611 | 604 | 7.935882% |
Noise dominated data is calculated using 1-second bins in cleaned event files. If a bin has >2000 counts, and if more than 50% of those come from <1% of pixels, then it is considered to be noise-dominated and hence unusable.
| Quadrant | # 1 sec bins | Bins with >0 counts | Bins with >2000 counts | High rate bins dominated by noise | Noise dominated (total time) | Noise dominated (detector-on time) | Marked lightcurve |
|---|---|---|---|---|---|---|---|
| A | 7611 | 7611 | 193 | 193 | 2.54% | 2.54% |  |
| B | 7611 | 7611 | 14 | 14 | 0.18% | 0.18% |  |
| C | 7611 | 7611 | 28 | 28 | 0.37% | 0.37% | 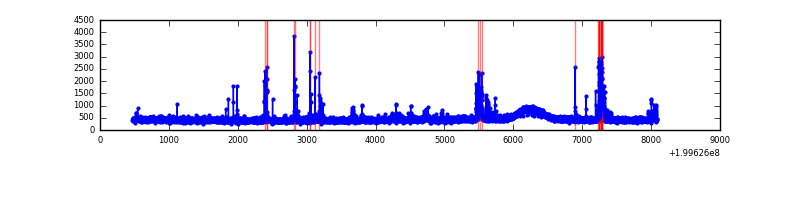 |
| D | 7610 | 7610 | 469 | 469 | 6.16% | 6.16% |  |
Top three noisy pixels from each quadrant. If the there are fewer than three noisy pixels in the level2.evt file, extra rows are filled as -1
| Pixel properties | Quadrant properties | ||||||
|---|---|---|---|---|---|---|---|
| Quadrant | DetID | PixID | Counts | Sigma | Mean | Median | Sigma |
| A | 0 | 149 | 547658 | 3083.95 | 863 | 840 | 177.3 |
| A | 14 | 249 | 62124 | 345.63 | 863 | 840 | 177.3 |
| A | 0 | 226 | 59065 | 328.38 | 863 | 840 | 177.3 |
| B | 4 | 80 | 295779 | 1734.4 | 879 | 858 | 170.0 |
| B | 0 | 219 | 104560 | 609.86 | 879 | 858 | 170.0 |
| B | 2 | 249 | 51807 | 299.63 | 879 | 858 | 170.0 |
| C | 1 | 192 | 275006 | 1386.09 | 845 | 847 | 197.8 |
| C | 6 | 80 | 47839 | 237.58 | 845 | 847 | 197.8 |
| C | 14 | 223 | 14428 | 68.66 | 845 | 847 | 197.8 |
| D | 5 | 233 | 1355705 | 6825.9 | 821 | 795 | 198.5 |
| D | 2 | 136 | 331397 | 1665.54 | 821 | 795 | 198.5 |
| D | 13 | 239 | 122430 | 612.79 | 821 | 795 | 198.5 |
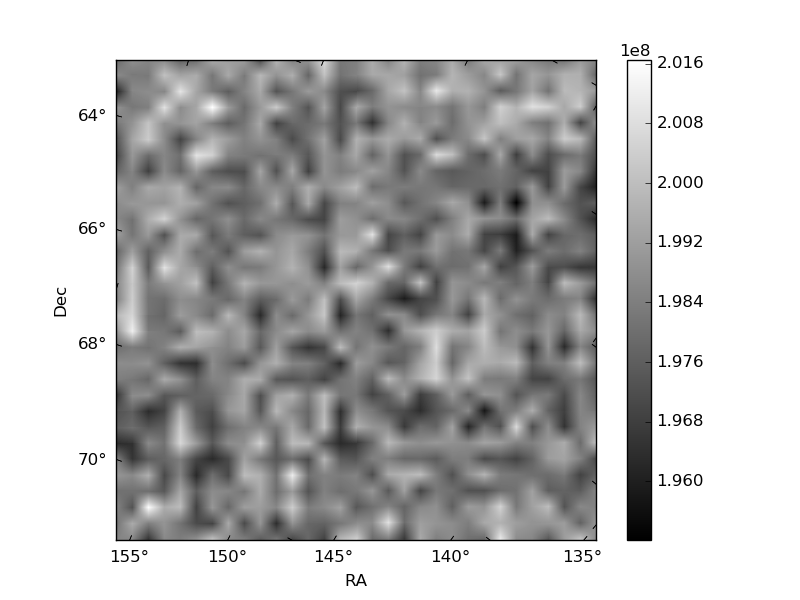
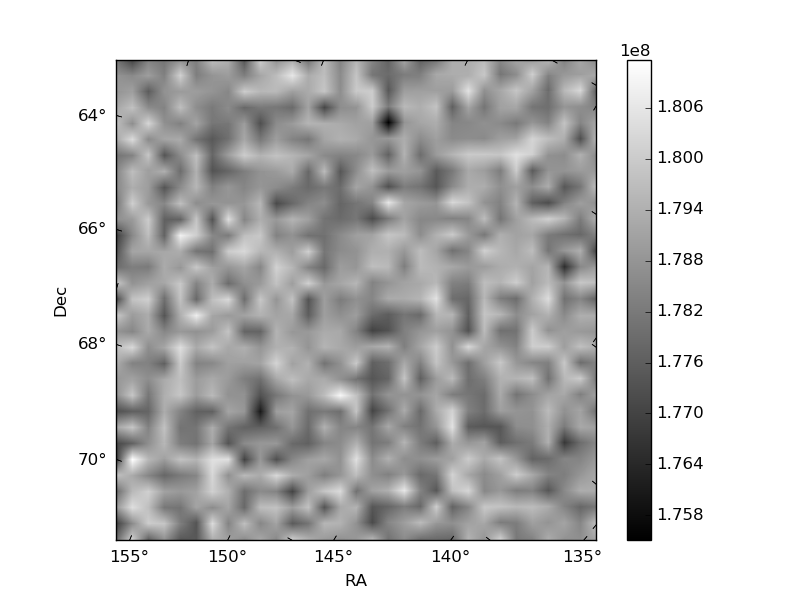
Histogram calculated using DETX and DETY for each event in the final _common_clean file
| Quadrant A | 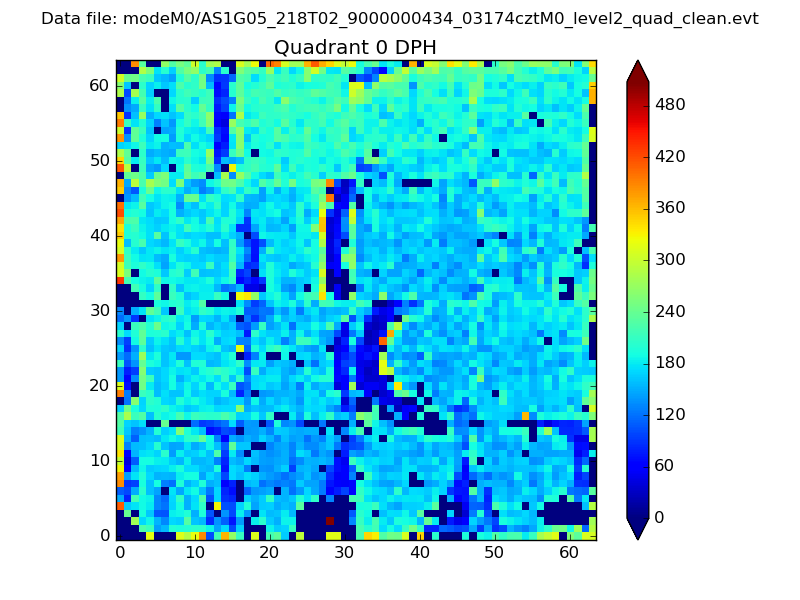 |
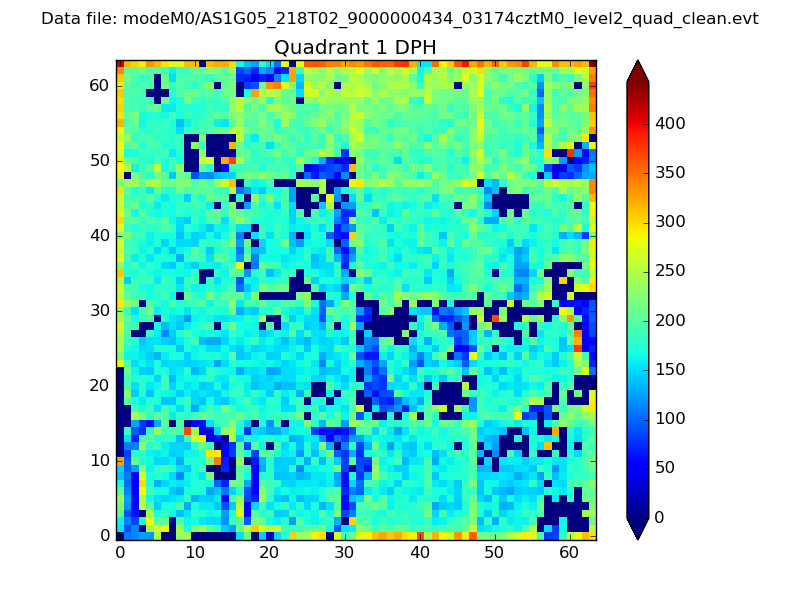 |
Quadrant B |
|---|---|---|---|
| Quadrant D | 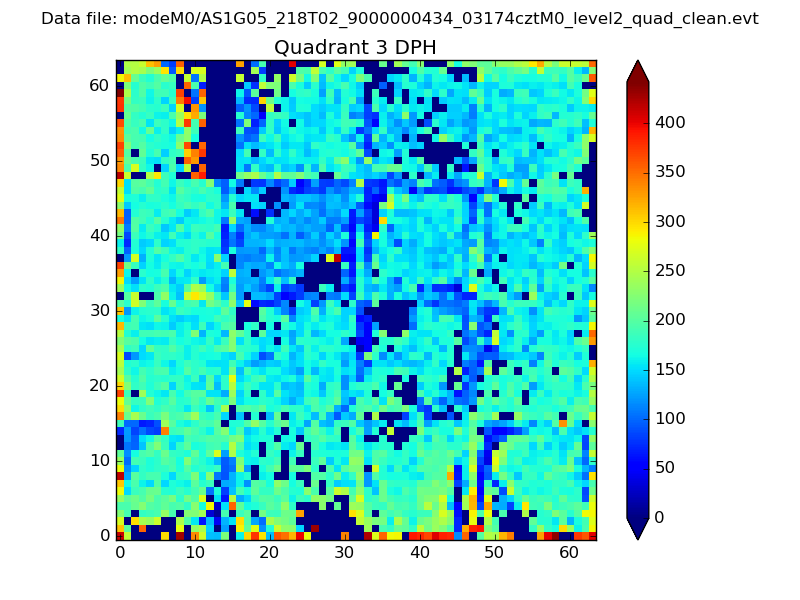 |
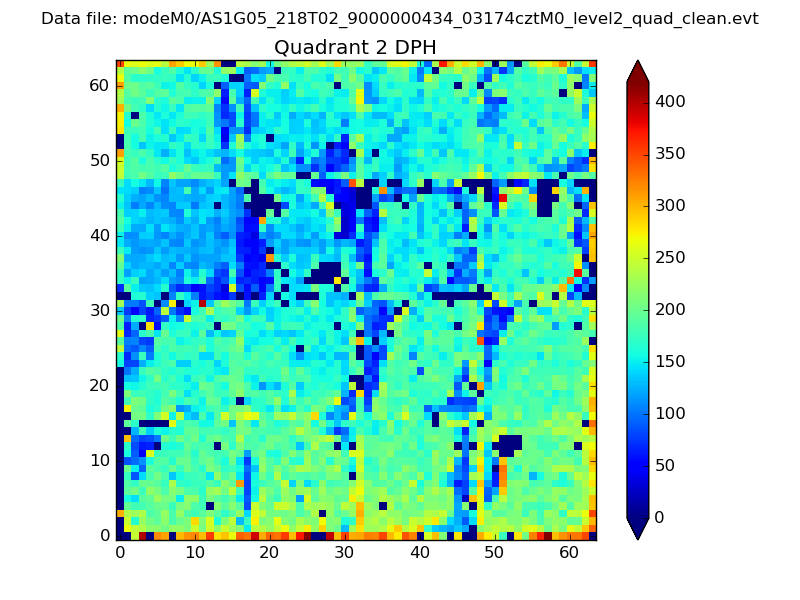 |
Quadrant C |
| Plot type | Count rate plots | Images |
|---|---|---|
| Comparison with Poisson distribution Blue bars denote a histogram of data divided into 1 sec bins. Red curve is a Poisson curve with rate = median count rate of data. |
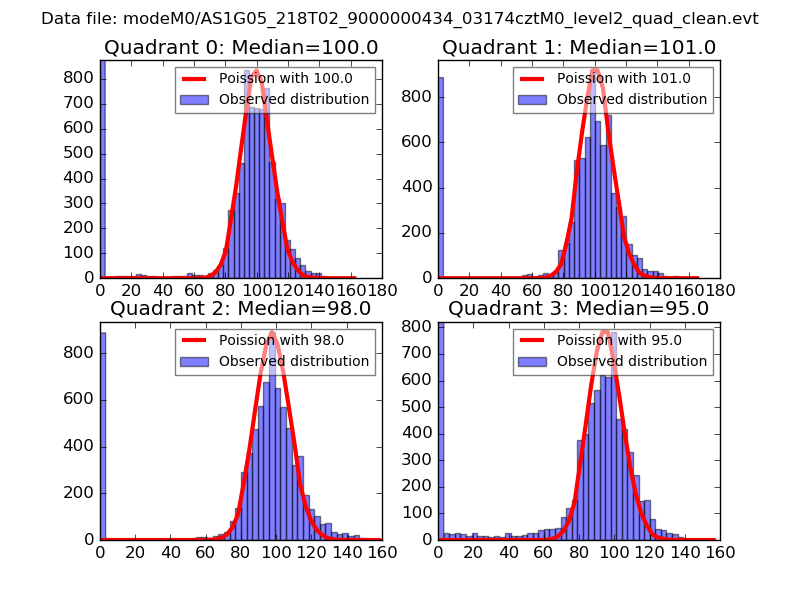 |
 |
| Quadrant-wise count rates Data is divided into 100 sec bins |
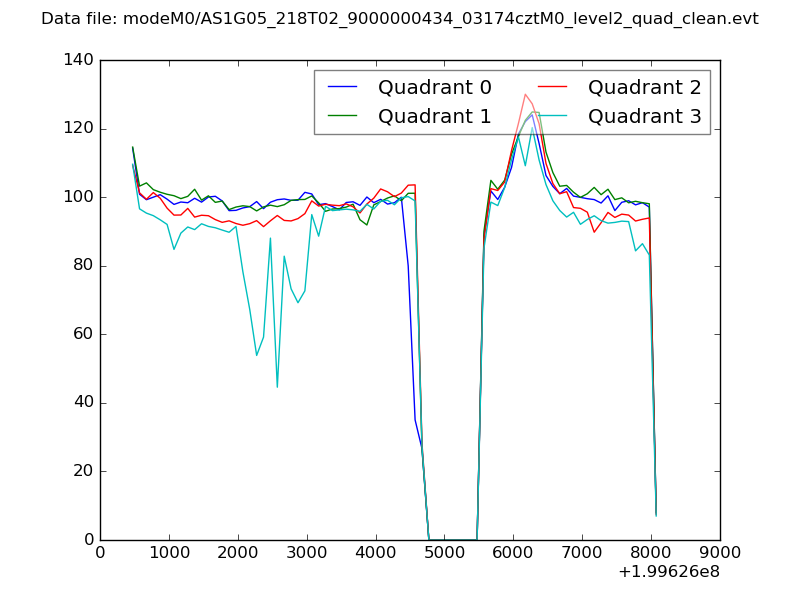 |
|
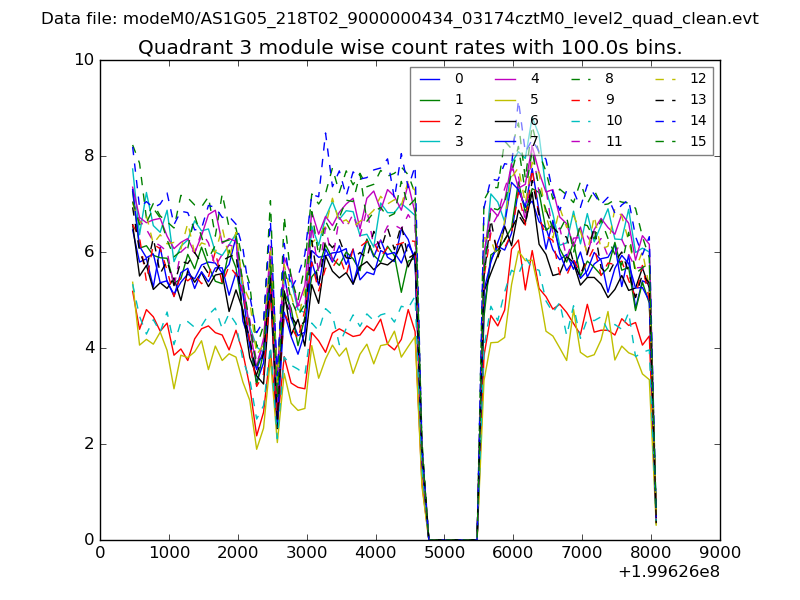
| Module-wise count rates for Quadrant A Data is divided into 100 sec bins |
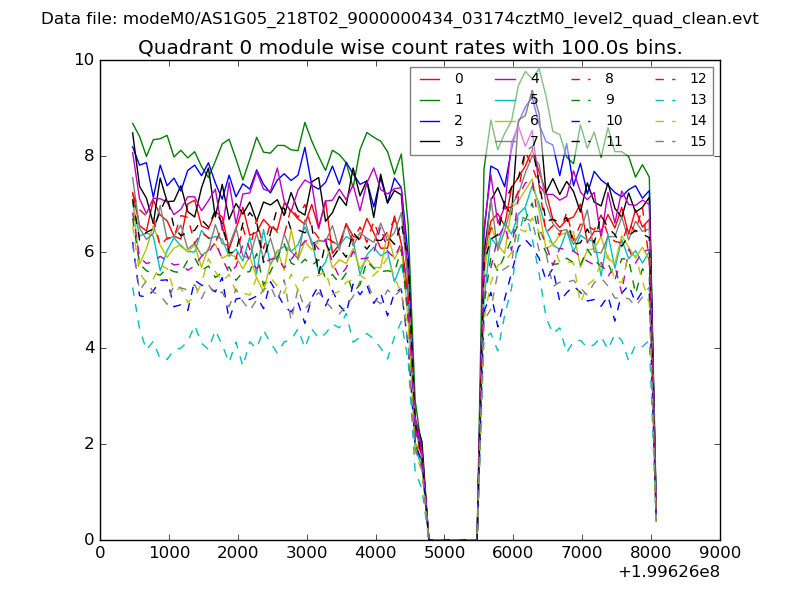 |
 |
| Module-wise count rates for Quadrant B Data is divided into 100 sec bins |
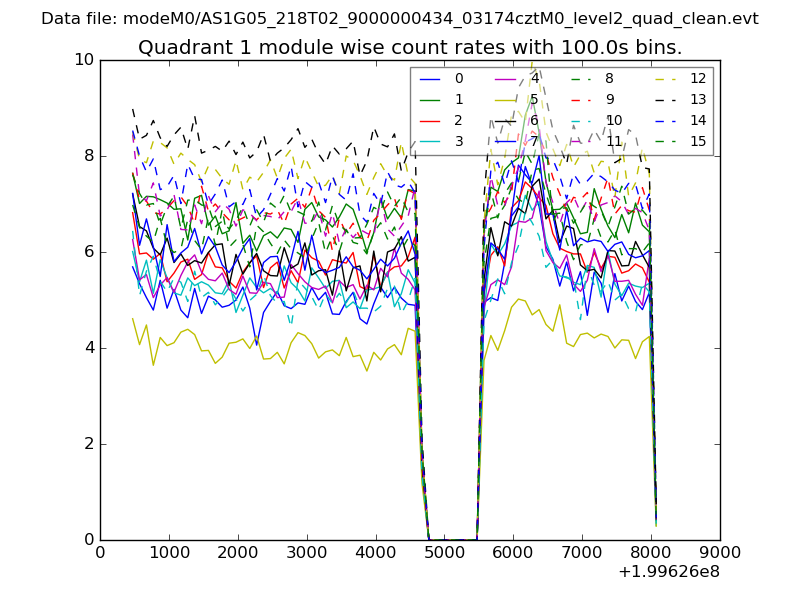 |
 |
| Module-wise count rates for Quadrant C Data is divided into 100 sec bins |
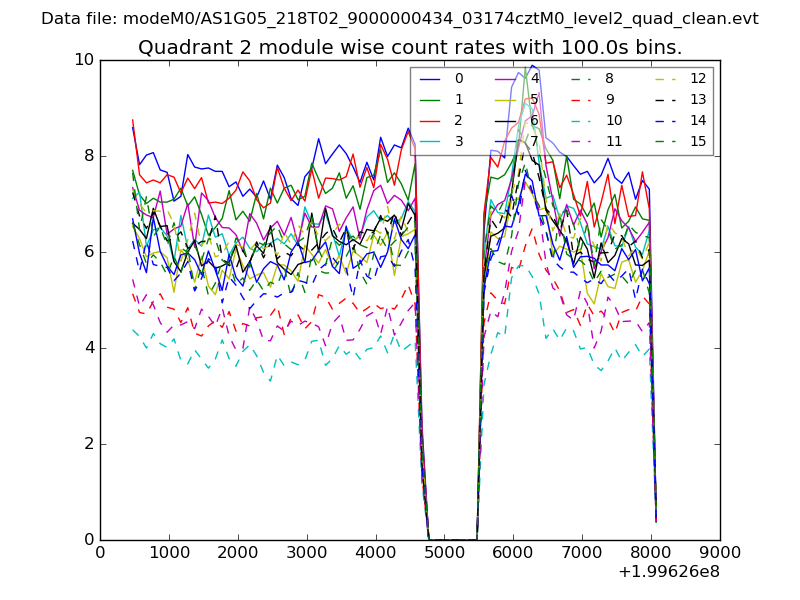 |
 |
| Module-wise count rates for Quadrant D Data is divided into 100 sec bins |
 |
 |
| Parameter | Plot |
|---|---|
| CZT HV Monitor | 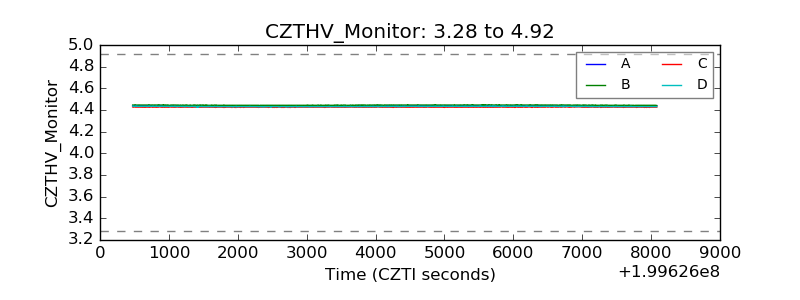 |
| D_VDD | 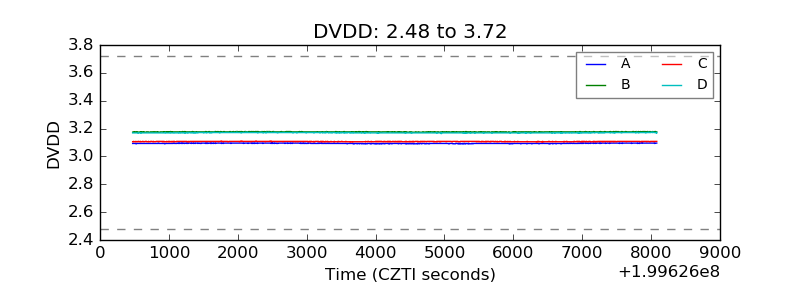 |
| Temperature 1 | 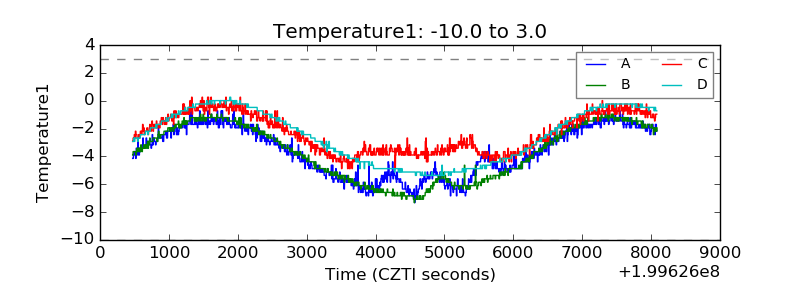 |
| Veto HV Monitor | 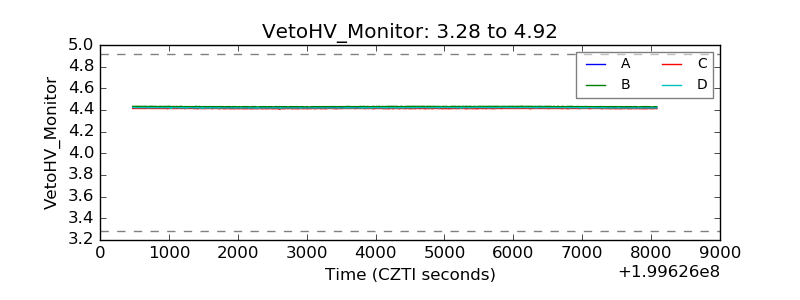 |
| Veto LLD | 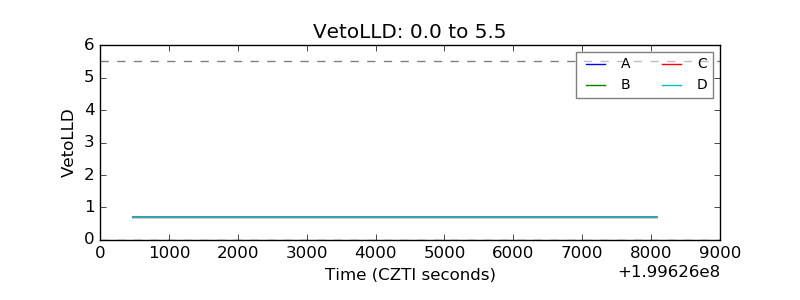 |
| Alpha Counter | 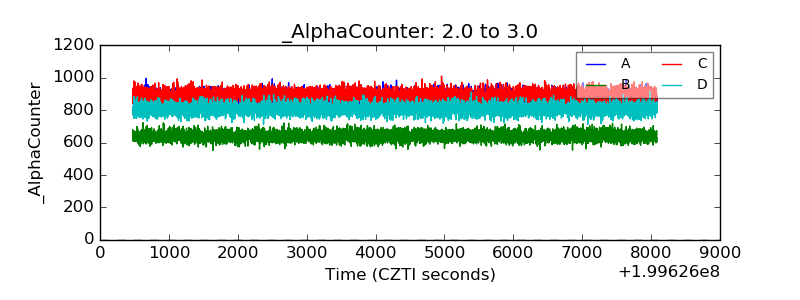 |
| _CPM_Rate | 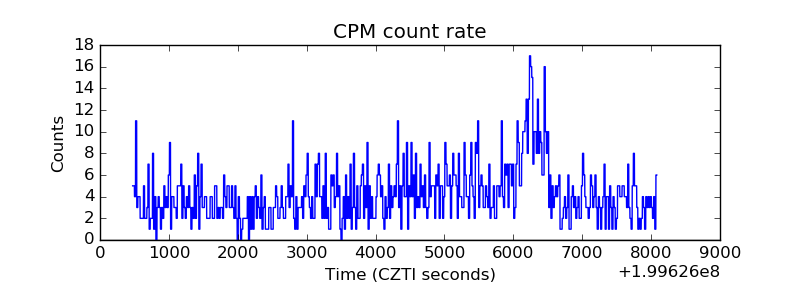 |
| CZT Counter | 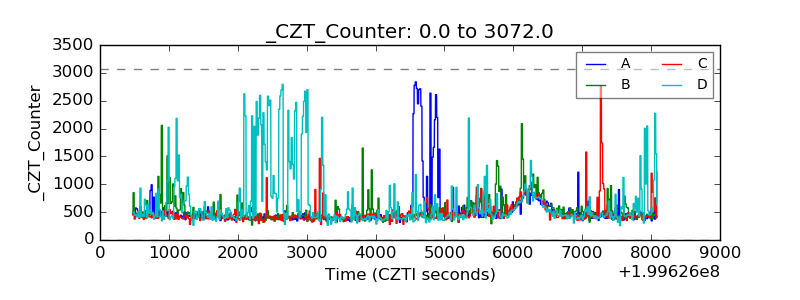 |
| +2.5 Volts monitor |  |
| +5 Volts monitor | 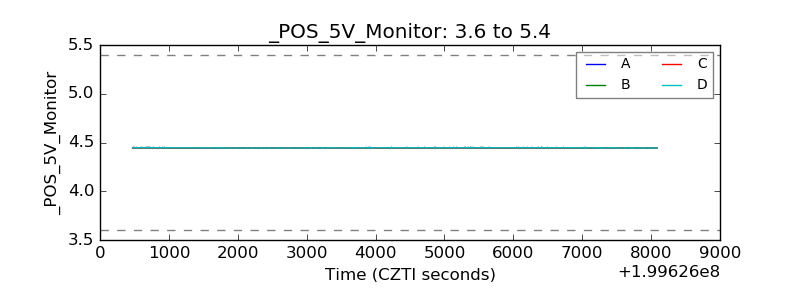 |
| _ROLL_ROT | 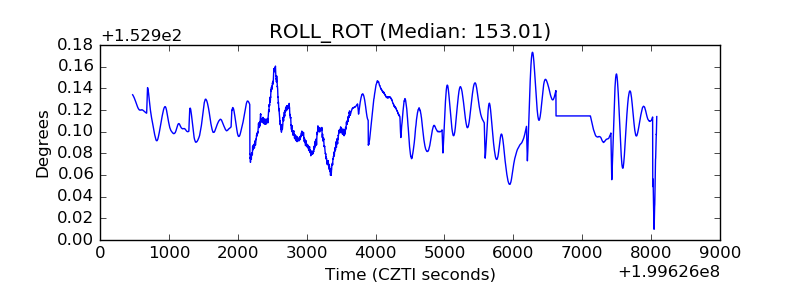 |
| _Roll_DEC | 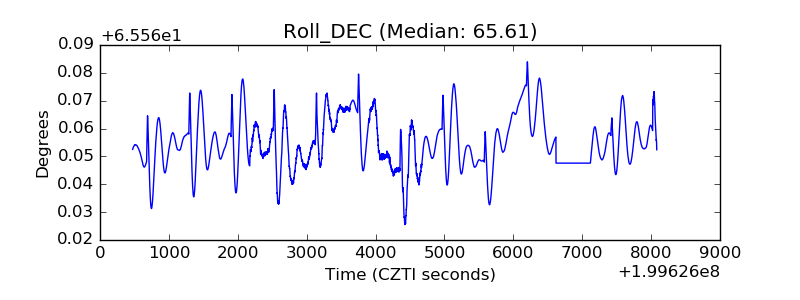 |
| _Roll_RA | 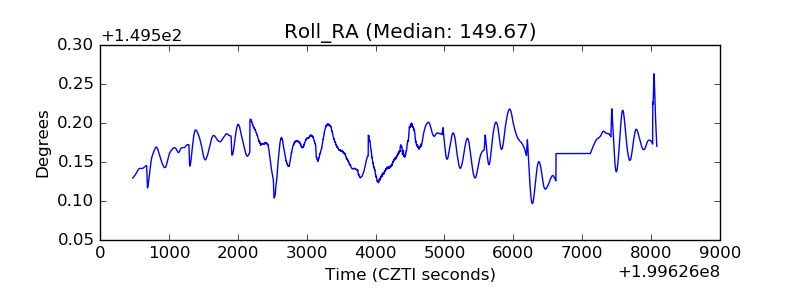 |
| Veto Counter | 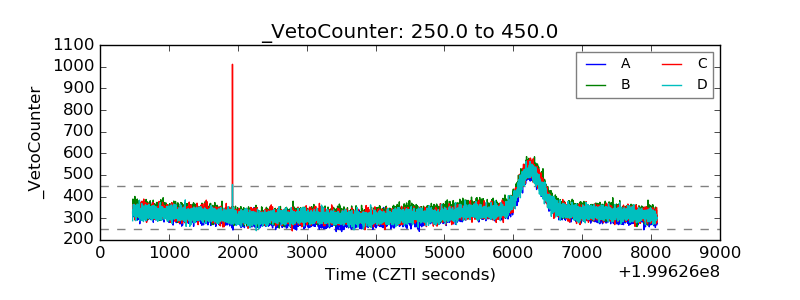 |