| Param | Original file | Final file |
|---|---|---|
| Filename | modeM0/AS1G05_218T02_9000000434_03175cztM0_level2.evt | modeM0/AS1G05_218T02_9000000434_03175cztM0_level2_quad_clean.evt |
| Size (bytes) | 546,649,920 | 96,661,440 |
| Size | 521.3 MB | 92.2 MB |
| Events in quadrant A | 3,817,890 | 617,026 |
| Events in quadrant B | 3,671,742 | 626,769 |
| Events in quadrant C | 4,130,525 | 606,713 |
| Events in quadrant D | 4,453,203 | 581,995 |
| Mode SS | |||
|---|---|---|---|
| Quadrant | BADHDUFLAG | Total packets | Discarded packets |
| A | 0 | 144 | 0 |
| B | 0 | 144 | 0 |
| C | 0 | 144 | 0 |
| D | 0 | 144 | 0 |
| Mode M0 | |||
|---|---|---|---|
| Quadrant | BADHDUFLAG | Total packets | Discarded packets |
| A | 0 | 16541 | 2 |
| B | 0 | 15921 | 1 |
| C | 0 | 17441 | 1 |
| D | 0 | 18348 | 1 |
| Mode M9 | |||
|---|---|---|---|
| Quadrant | BADHDUFLAG | Total packets | Discarded packets |
| A | 0 | 1 | 0 |
| B | 0 | 1 | 0 |
| C | 0 | 1 | 0 |
| D | 0 | 1 | 0 |
| Quadrant | Total seconds | Saturated seconds | Saturation percentage |
|---|---|---|---|
| A | 7100 | 291 | 4.098592% |
| B | 7100 | 172 | 2.422535% |
| C | 7100 | 285 | 4.014085% |
| D | 7100 | 420 | 5.915493% |
Noise dominated data is calculated using 1-second bins in cleaned event files. If a bin has >2000 counts, and if more than 50% of those come from <1% of pixels, then it is considered to be noise-dominated and hence unusable.
| Quadrant | # 1 sec bins | Bins with >0 counts | Bins with >2000 counts | High rate bins dominated by noise | Noise dominated (total time) | Noise dominated (detector-on time) | Marked lightcurve |
|---|---|---|---|---|---|---|---|
| A | 7185 | 7102 | 125 | 125 | 1.74% | 1.76% | 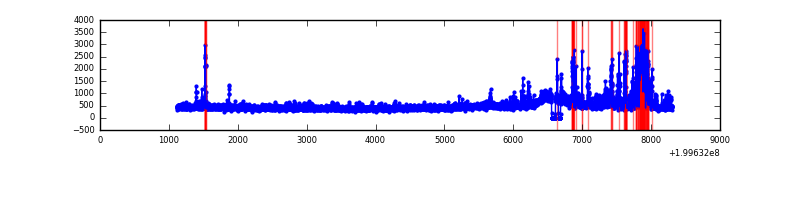 |
| B | 7185 | 7102 | 8 | 8 | 0.11% | 0.11% | 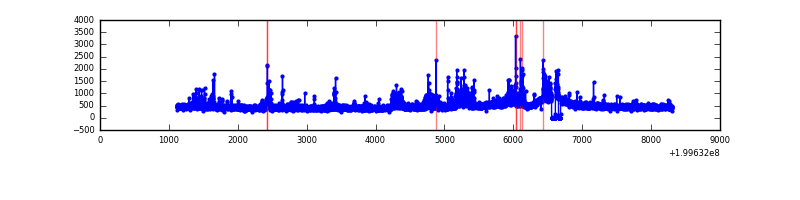 |
| C | 7185 | 7102 | 165 | 165 | 2.30% | 2.32% | 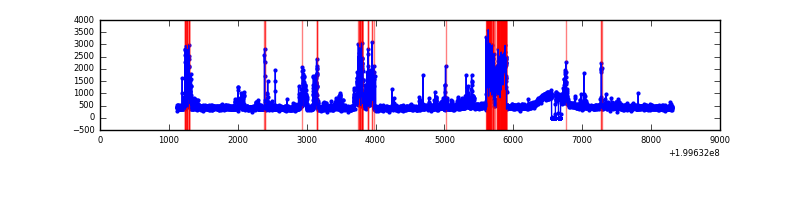 |
| D | 7185 | 7102 | 265 | 265 | 3.69% | 3.73% | 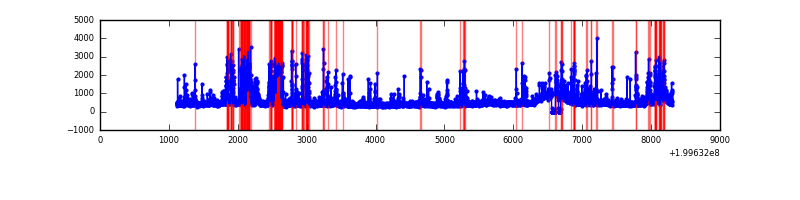 |
Top three noisy pixels from each quadrant. If the there are fewer than three noisy pixels in the level2.evt file, extra rows are filled as -1
| Pixel properties | Quadrant properties | ||||||
|---|---|---|---|---|---|---|---|
| Quadrant | DetID | PixID | Counts | Sigma | Mean | Median | Sigma |
| A | 14 | 249 | 442733 | 2719.17 | 799 | 779 | 162.5 |
| A | 12 | 247 | 143781 | 879.84 | 799 | 779 | 162.5 |
| A | 8 | 15 | 110549 | 675.37 | 799 | 779 | 162.5 |
| B | 4 | 80 | 224565 | 1415.43 | 816 | 794 | 158.1 |
| B | 4 | 81 | 116024 | 728.87 | 816 | 794 | 158.1 |
| B | 2 | 249 | 38748 | 240.07 | 816 | 794 | 158.1 |
| C | 1 | 192 | 999867 | 5418.65 | 783 | 785 | 184.4 |
| C | 6 | 80 | 37291 | 198.0 | 783 | 785 | 184.4 |
| C | 14 | 223 | 17532 | 90.83 | 783 | 785 | 184.4 |
| D | 5 | 233 | 879548 | 4607.46 | 778 | 751 | 190.7 |
| D | 2 | 136 | 224672 | 1174.0 | 778 | 751 | 190.7 |
| D | 13 | 114 | 78988 | 410.19 | 778 | 751 | 190.7 |
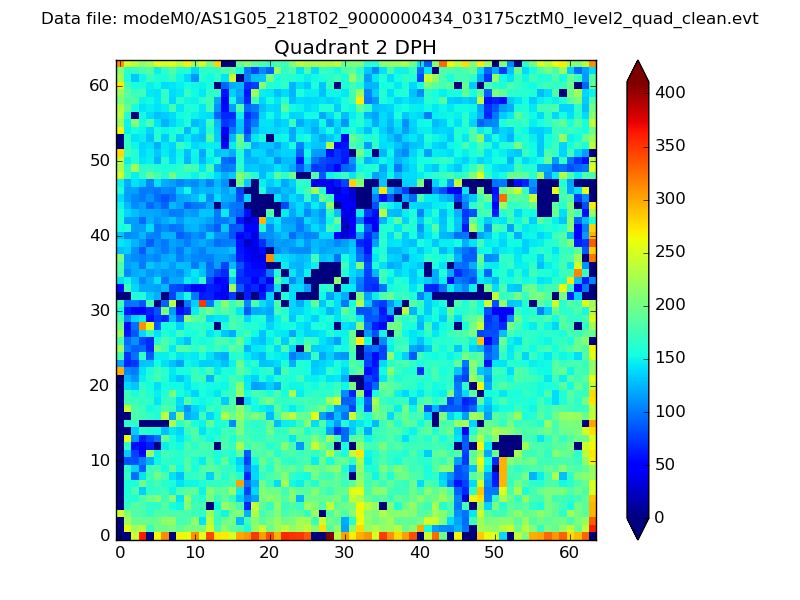
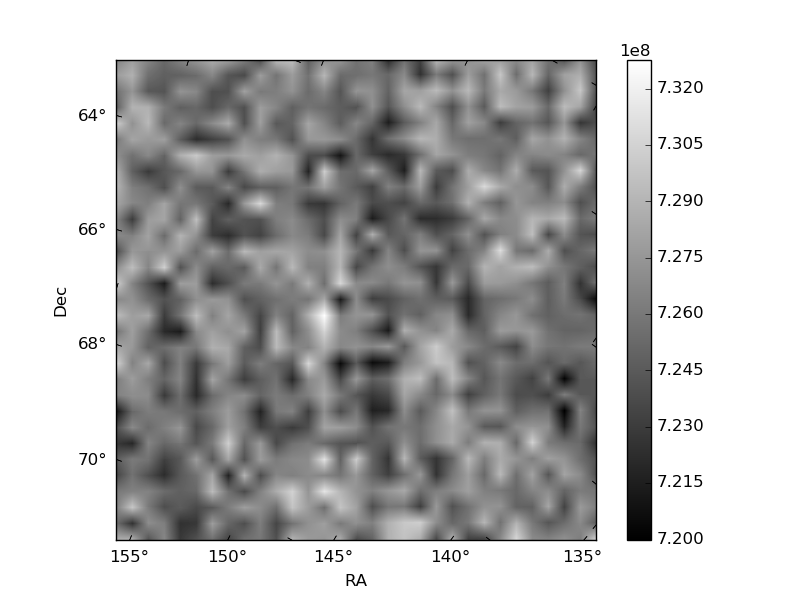
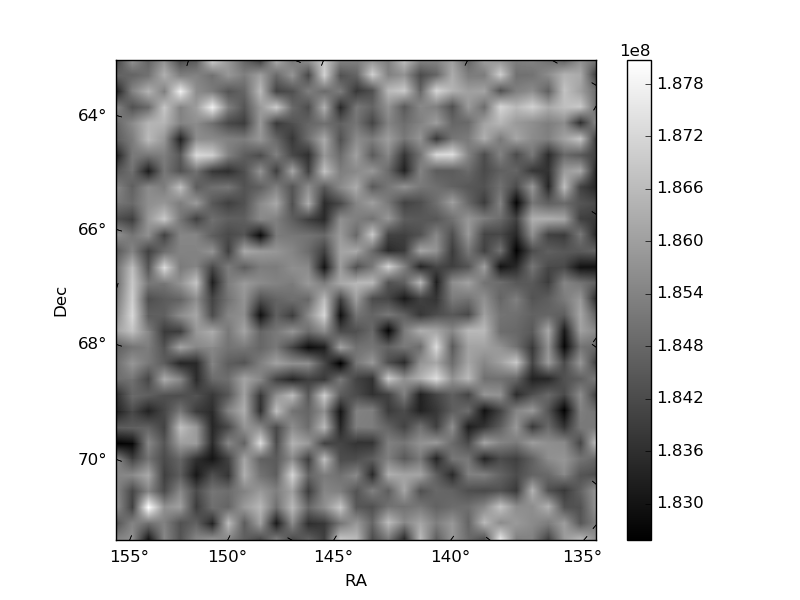
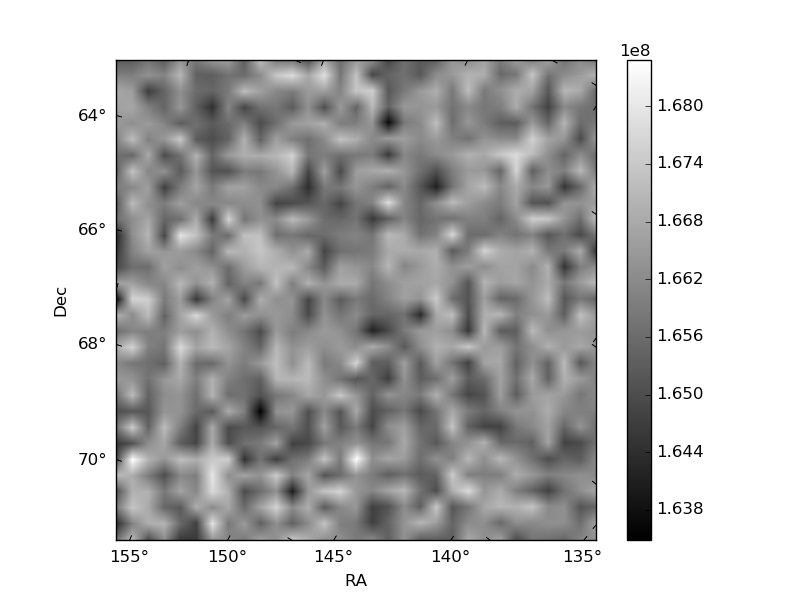
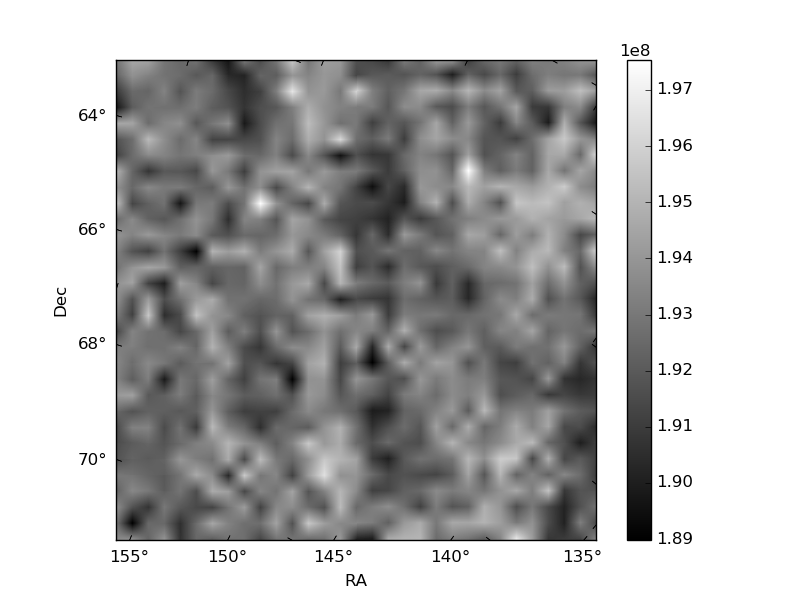
Histogram calculated using DETX and DETY for each event in the final _common_clean file
| Quadrant A | 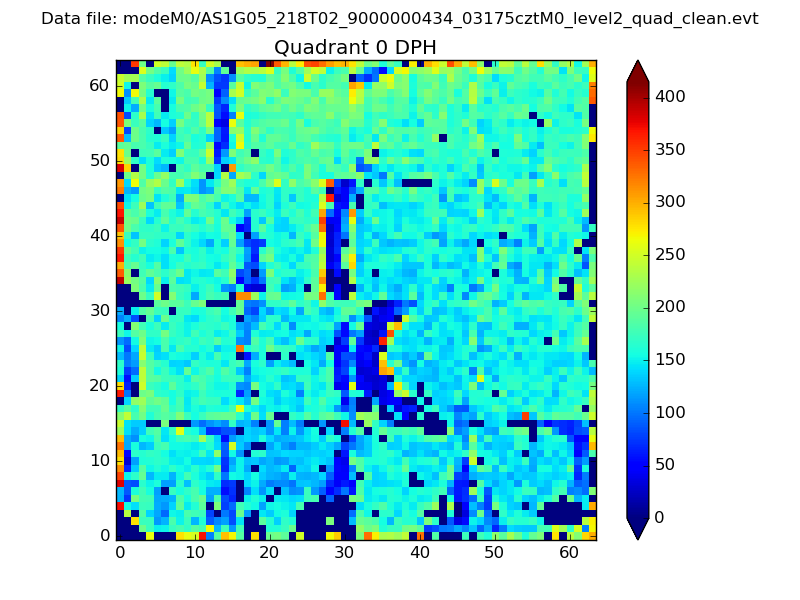 |
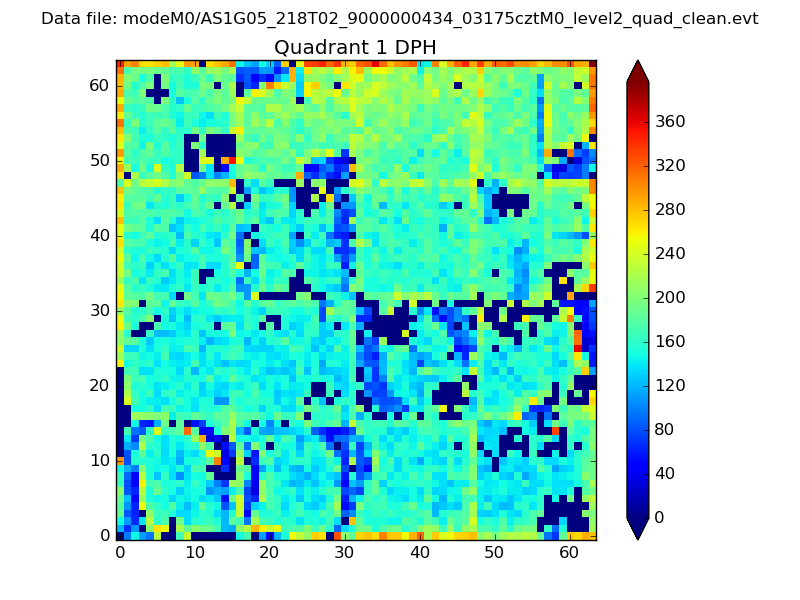 |
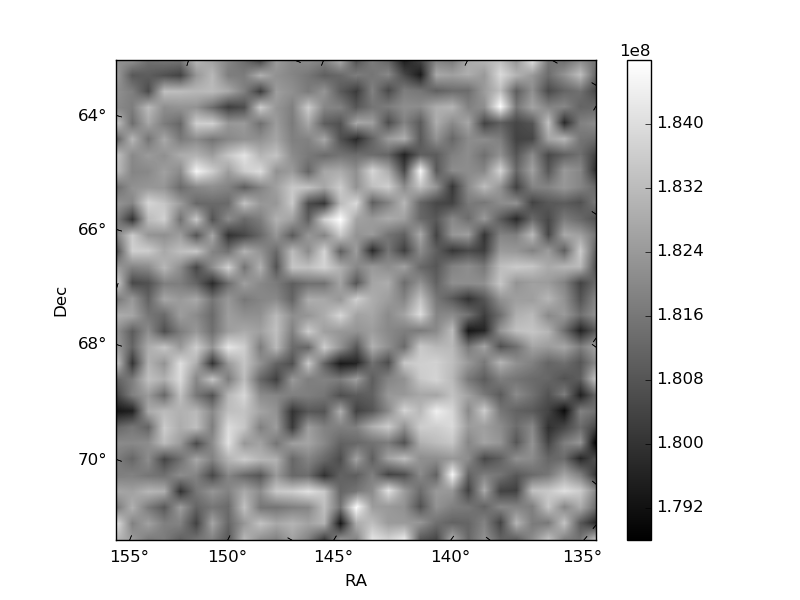
Quadrant B |
|---|---|---|---|
| Quadrant D | 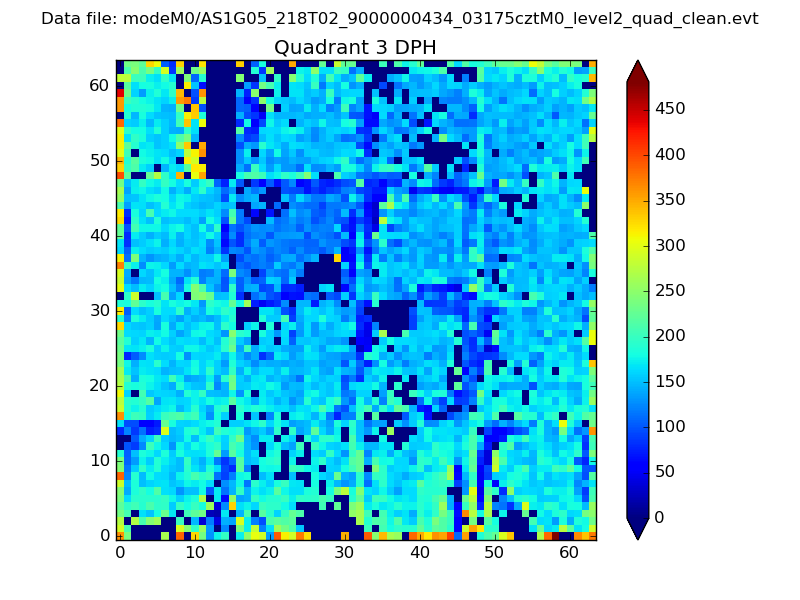 |
 |
Quadrant C |
| Plot type | Count rate plots | Images |
|---|---|---|
| Comparison with Poisson distribution Blue bars denote a histogram of data divided into 1 sec bins. Red curve is a Poisson curve with rate = median count rate of data. |
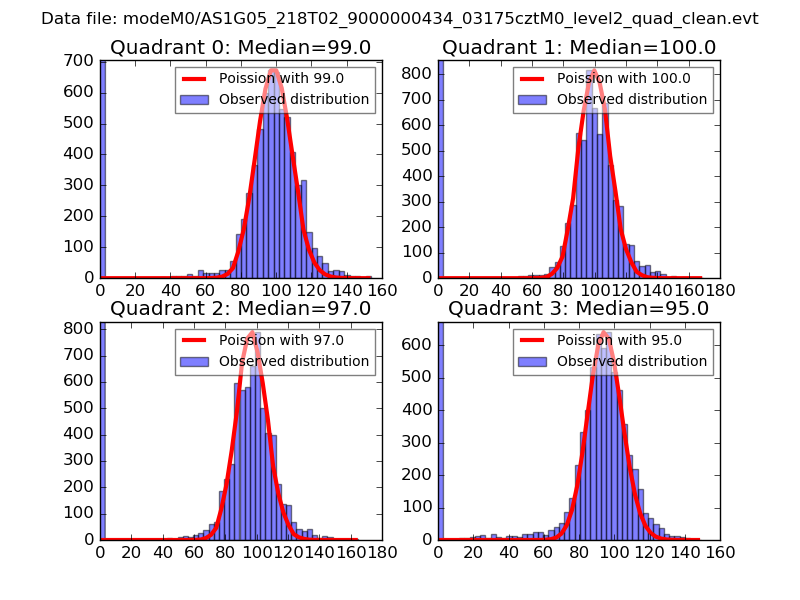 |
 |
| Quadrant-wise count rates Data is divided into 100 sec bins |
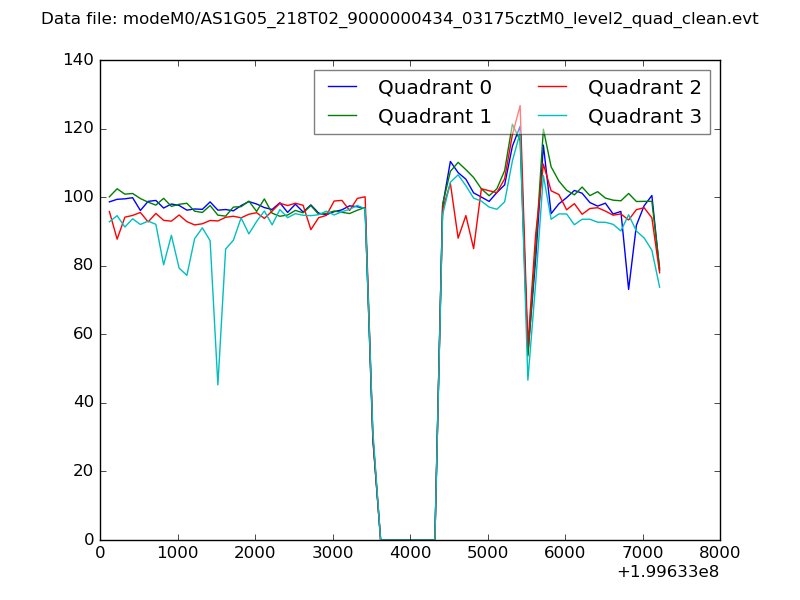 |
|
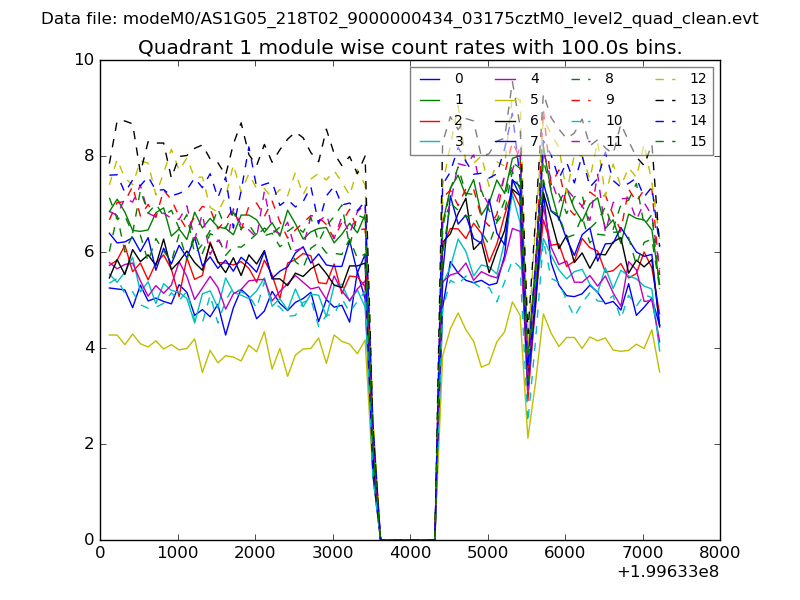
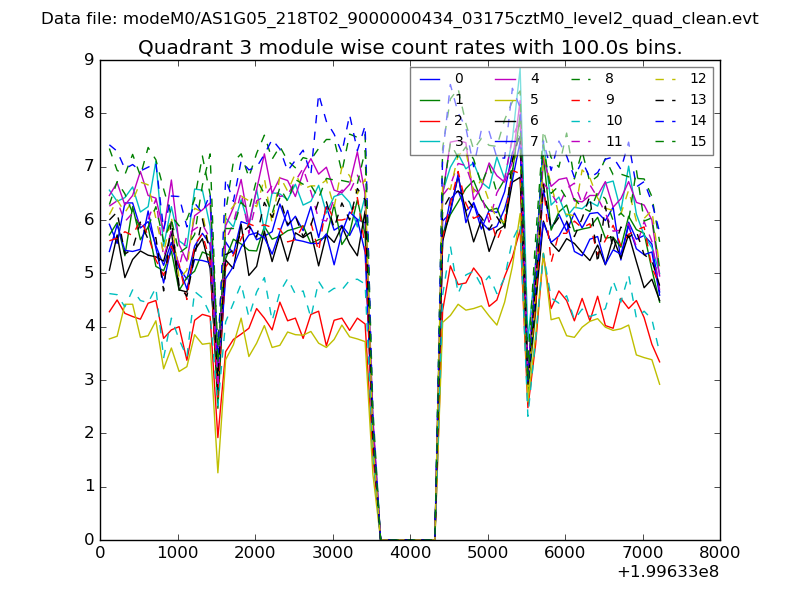
| Module-wise count rates for Quadrant A Data is divided into 100 sec bins |
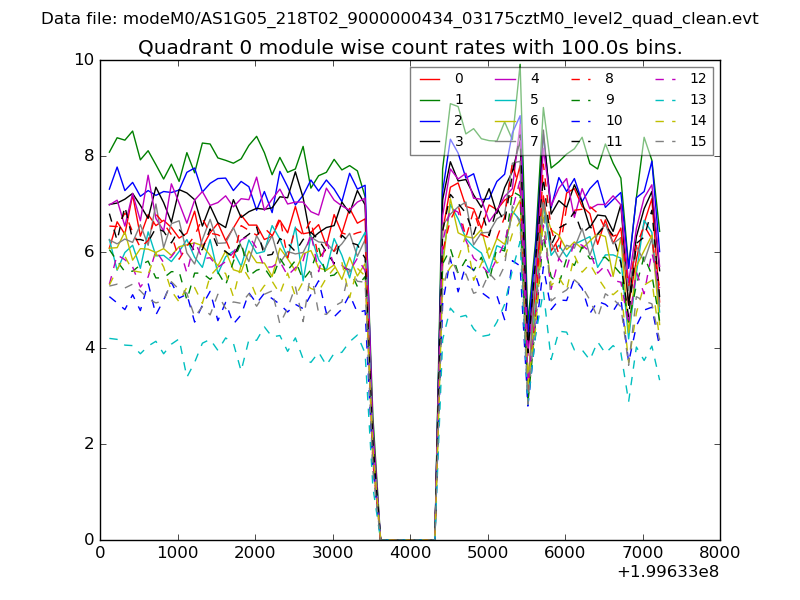 |
 |
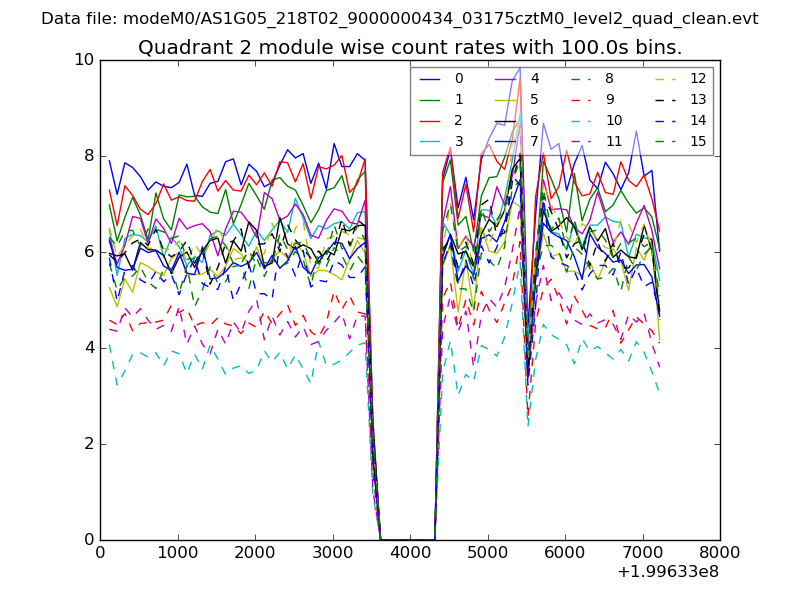
| Module-wise count rates for Quadrant B Data is divided into 100 sec bins |
 |
 |
| Module-wise count rates for Quadrant C Data is divided into 100 sec bins |
 |
 |
| Module-wise count rates for Quadrant D Data is divided into 100 sec bins |
 |
 |
| Parameter | Plot |
|---|---|
| CZT HV Monitor | 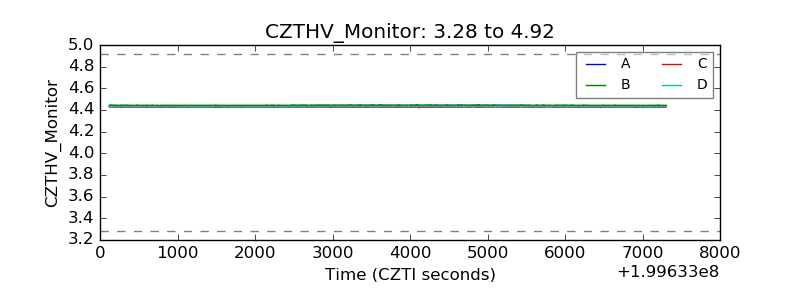 |
| D_VDD | 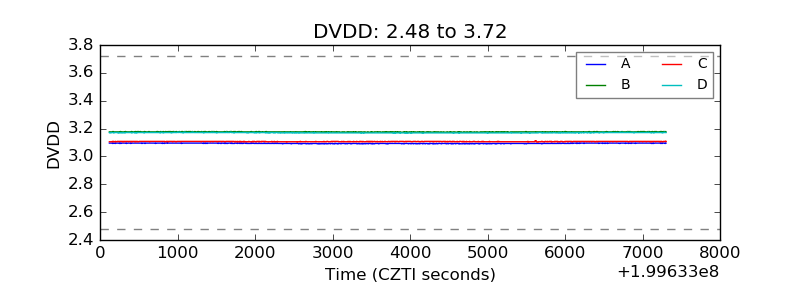 |
| Temperature 1 | 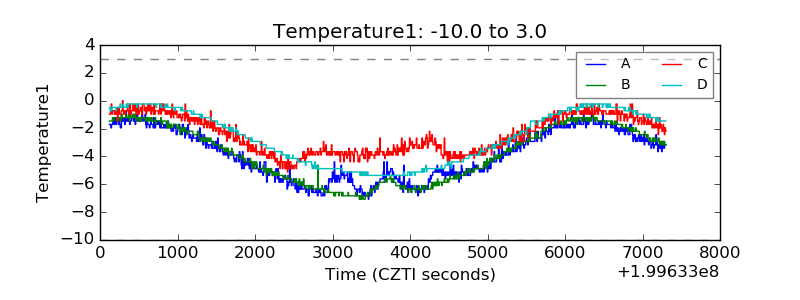 |
| Veto HV Monitor | 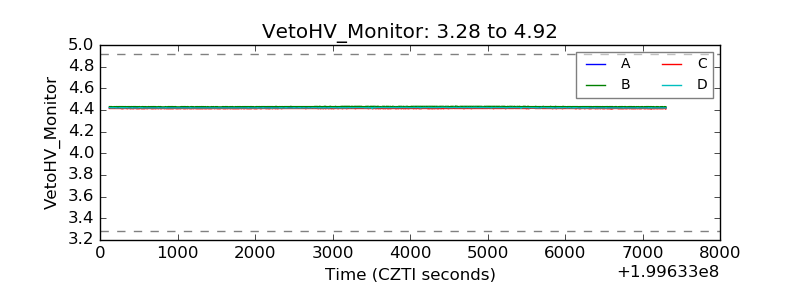 |
| Veto LLD | 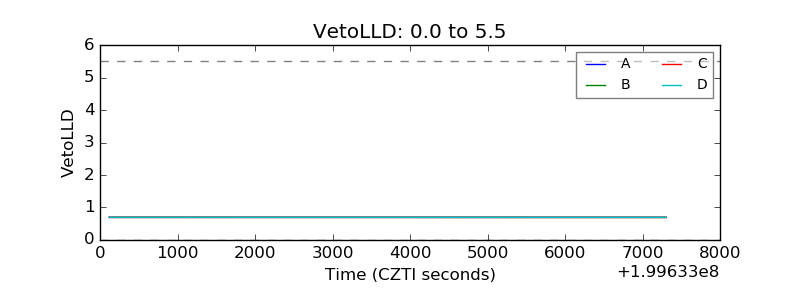 |
| Alpha Counter | 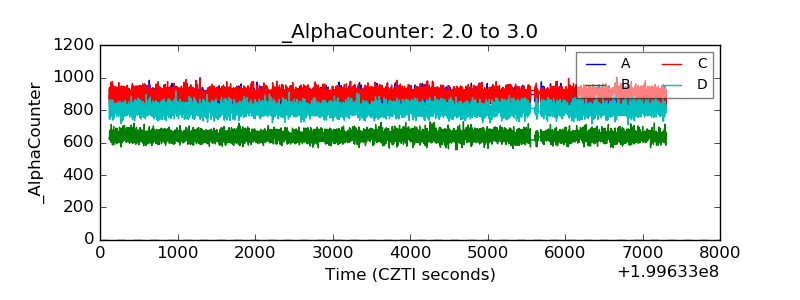 |
| _CPM_Rate | 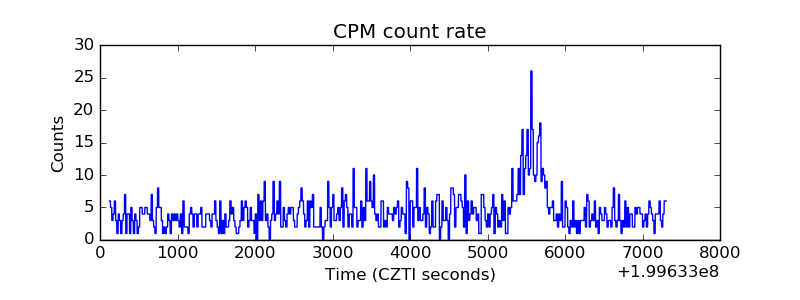 |
| CZT Counter | 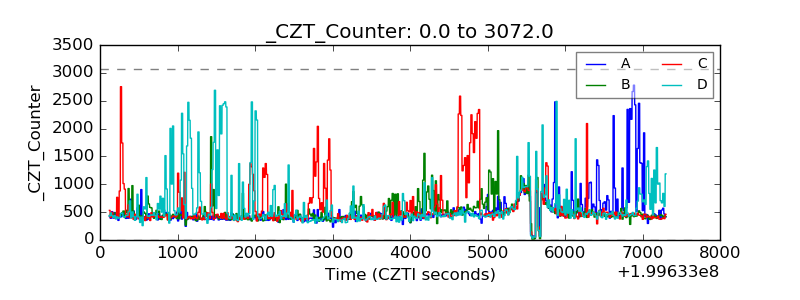 |
| +2.5 Volts monitor |  |
| +5 Volts monitor | 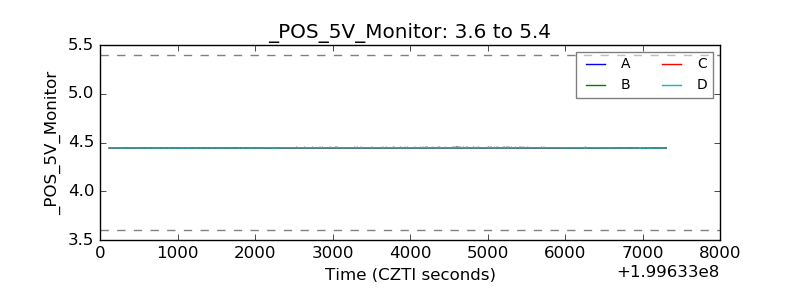 |
| _ROLL_ROT | 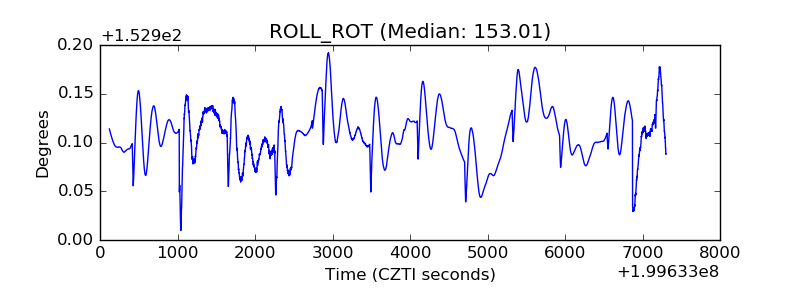 |
| _Roll_DEC | 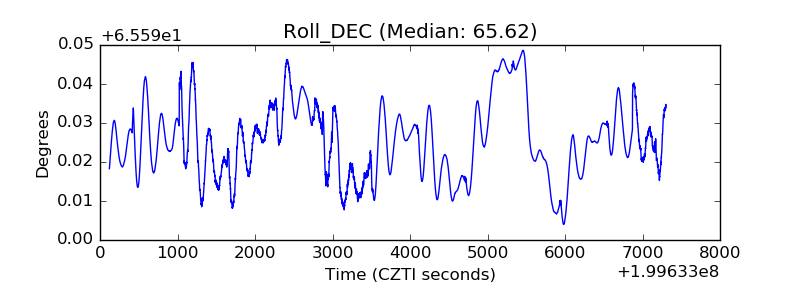 |
| _Roll_RA | 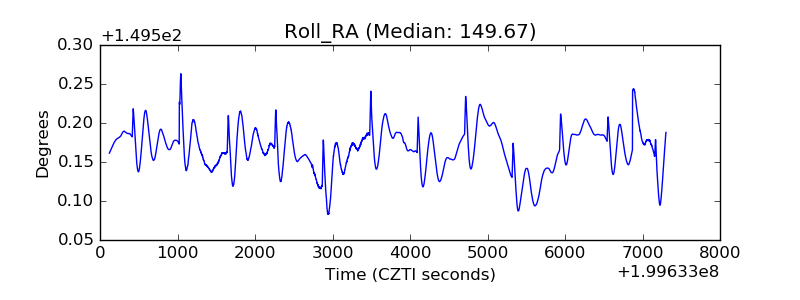 |
| Veto Counter | 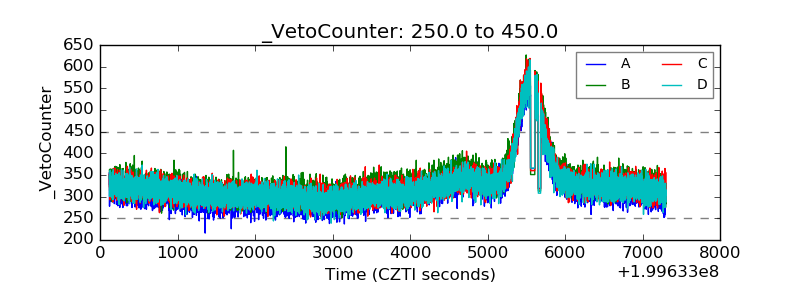 |