| Param | Original file | Final file |
|---|---|---|
| Filename | modeM0/AS1G05_218T02_9000000434_03178cztM0_level2.evt | modeM0/AS1G05_218T02_9000000434_03178cztM0_level2_quad_clean.evt |
| Size (bytes) | 803,522,880 | 115,680,960 |
| Size | 766.3 MB | 110.3 MB |
| Events in quadrant A | 5,618,492 | 763,406 |
| Events in quadrant B | 4,617,043 | 770,478 |
| Events in quadrant C | 8,335,190 | 621,267 |
| Events in quadrant D | 5,172,660 | 740,386 |
| Mode SS | |||
|---|---|---|---|
| Quadrant | BADHDUFLAG | Total packets | Discarded packets |
| A | 0 | 176 | 0 |
| B | 0 | 176 | 0 |
| C | 0 | 176 | 0 |
| D | 0 | 176 | 0 |
| Mode M0 | |||
|---|---|---|---|
| Quadrant | BADHDUFLAG | Total packets | Discarded packets |
| A | 0 | 22830 | 1 |
| B | 0 | 19824 | 1 |
| C | 0 | 30870 | 1 |
| D | 0 | 21714 | 1 |
| Mode M9 | |||
|---|---|---|---|
| Quadrant | BADHDUFLAG | Total packets | Discarded packets |
| A | 0 | 4 | 0 |
| B | 0 | 4 | 0 |
| C | 0 | 4 | 0 |
| D | 0 | 4 | 0 |
| Quadrant | Total seconds | Saturated seconds | Saturation percentage |
|---|---|---|---|
| A | 8741 | 350 | 4.004119% |
| B | 8741 | 282 | 3.226175% |
| C | 8741 | 1800 | 20.592610% |
| D | 8741 | 311 | 3.557945% |
Noise dominated data is calculated using 1-second bins in cleaned event files. If a bin has >2000 counts, and if more than 50% of those come from <1% of pixels, then it is considered to be noise-dominated and hence unusable.
| Quadrant | # 1 sec bins | Bins with >0 counts | Bins with >2000 counts | High rate bins dominated by noise | Noise dominated (total time) | Noise dominated (detector-on time) | Marked lightcurve |
|---|---|---|---|---|---|---|---|
| A | 9141 | 8742 | 267 | 267 | 2.92% | 3.05% |  |
| B | 9141 | 8742 | 185 | 185 | 2.02% | 2.12% | 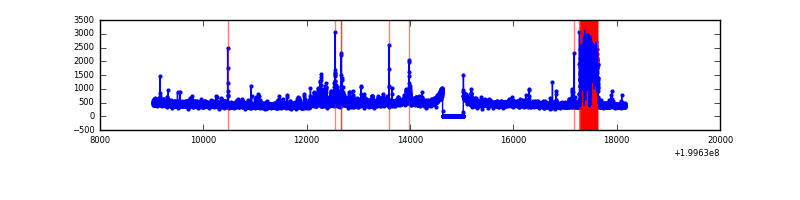 |
| C | 9140 | 8741 | 1502 | 1502 | 16.43% | 17.18% | 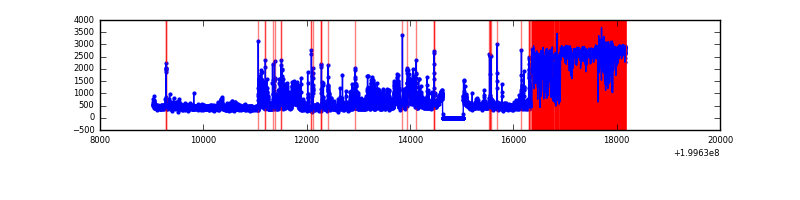 |
| D | 9141 | 8742 | 236 | 236 | 2.58% | 2.70% |  |
Top three noisy pixels from each quadrant. If the there are fewer than three noisy pixels in the level2.evt file, extra rows are filled as -1
| Pixel properties | Quadrant properties | ||||||
|---|---|---|---|---|---|---|---|
| Quadrant | DetID | PixID | Counts | Sigma | Mean | Median | Sigma |
| A | 14 | 249 | 1682828 | 8781.63 | 938 | 914 | 191.5 |
| A | 12 | 247 | 207888 | 1080.66 | 938 | 914 | 191.5 |
| A | 8 | 15 | 87373 | 451.42 | 938 | 914 | 191.5 |
| B | 4 | 80 | 583631 | 3141.91 | 958 | 934 | 185.5 |
| B | 4 | 81 | 195610 | 1049.7 | 958 | 934 | 185.5 |
| B | 2 | 249 | 25987 | 135.09 | 958 | 934 | 185.5 |
| C | 12 | 206 | 4155412 | 22391.02 | 791 | 791 | 185.5 |
| C | 1 | 192 | 959659 | 5167.75 | 791 | 791 | 185.5 |
| C | 6 | 80 | 50010 | 265.26 | 791 | 791 | 185.5 |
| D | 5 | 233 | 732013 | 3253.26 | 919 | 890 | 224.7 |
| D | 10 | 199 | 251301 | 1114.25 | 919 | 890 | 224.7 |
| D | 2 | 136 | 217076 | 961.96 | 919 | 890 | 224.7 |
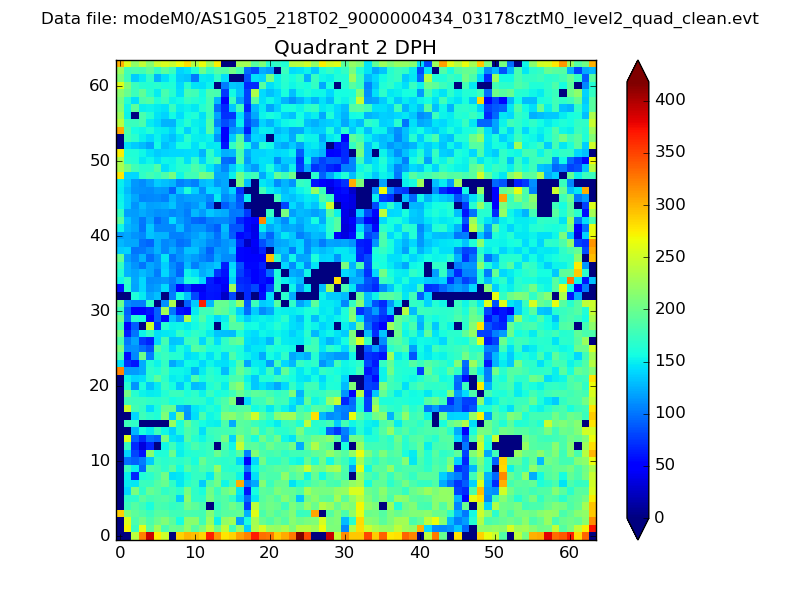
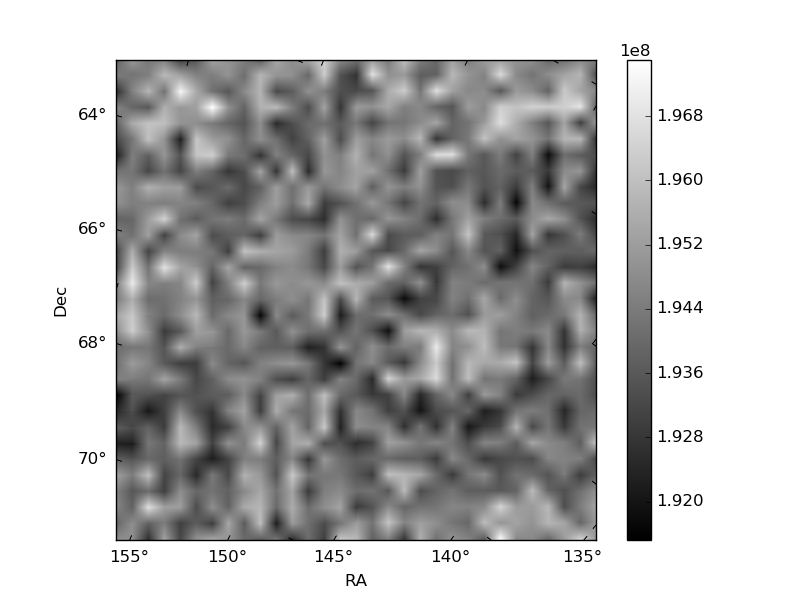
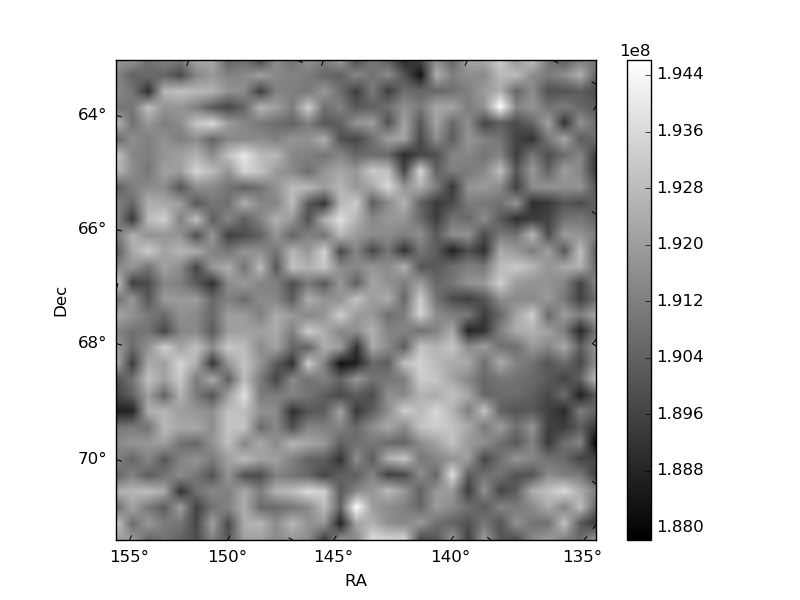
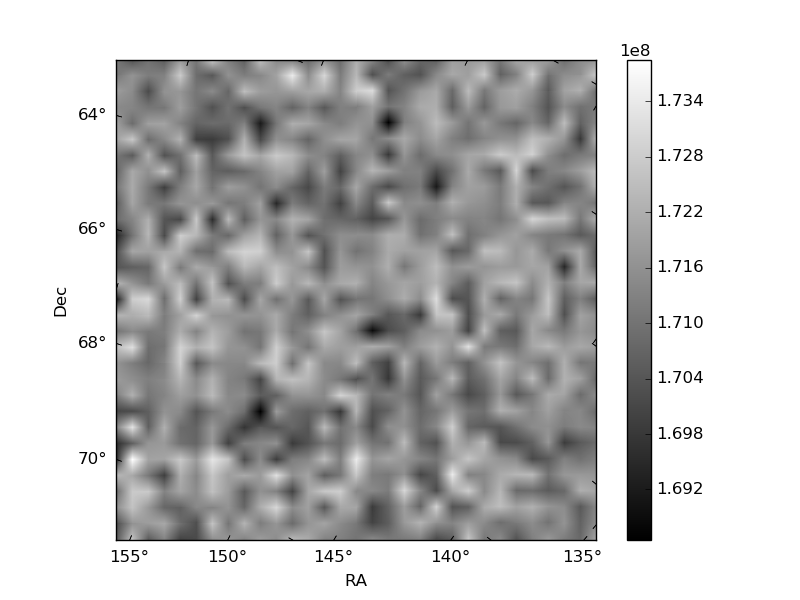
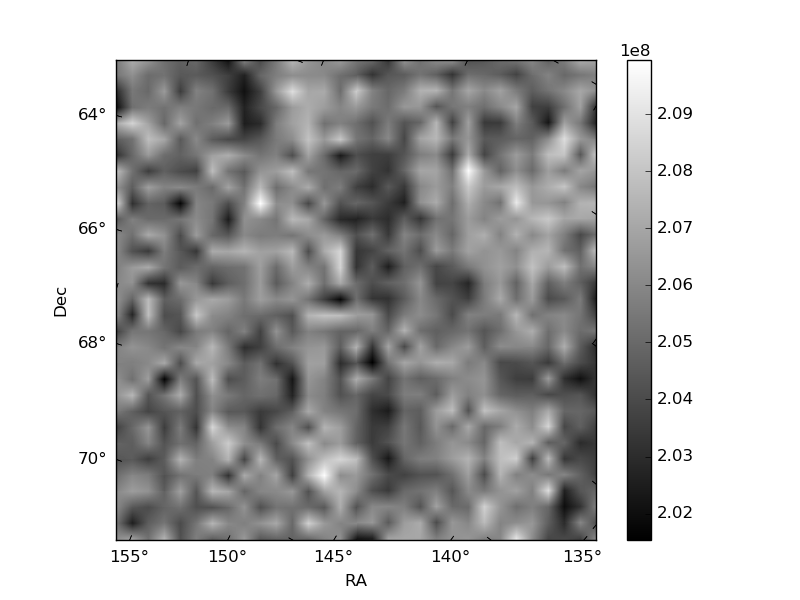
Histogram calculated using DETX and DETY for each event in the final _common_clean file
| Quadrant A | 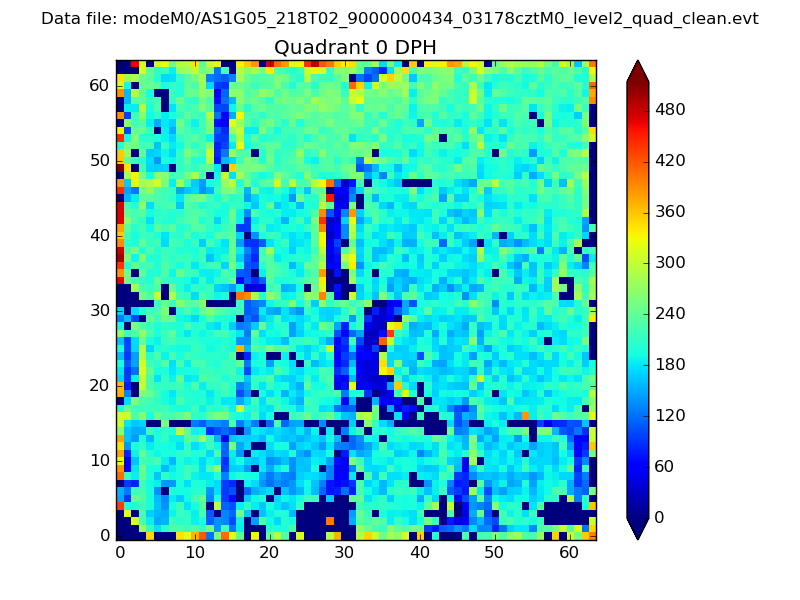 |
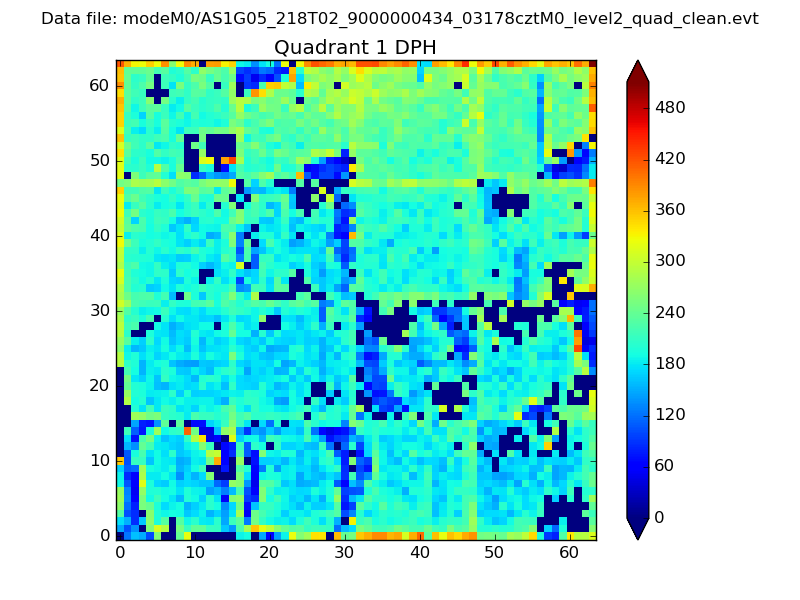 |
Quadrant B |
|---|---|---|---|
| Quadrant D | 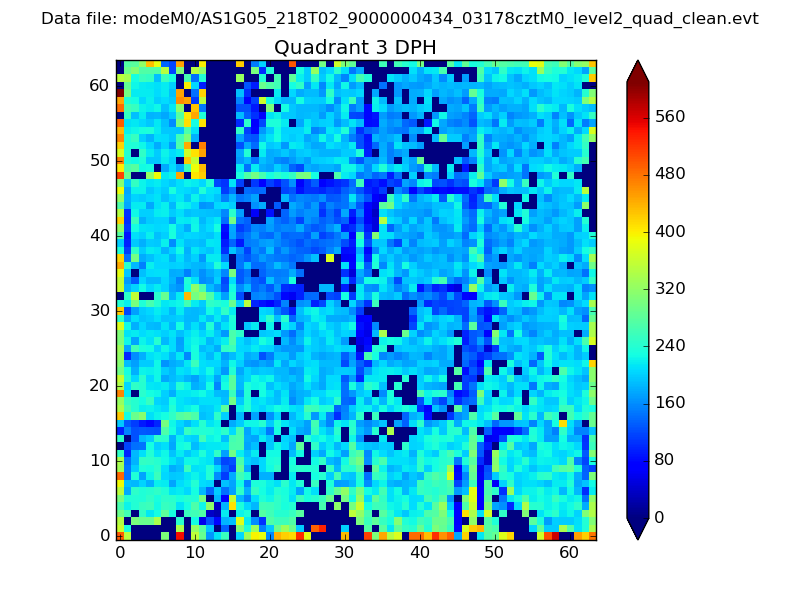 |
 |
Quadrant C |
| Plot type | Count rate plots | Images |
|---|---|---|
| Comparison with Poisson distribution Blue bars denote a histogram of data divided into 1 sec bins. Red curve is a Poisson curve with rate = median count rate of data. |
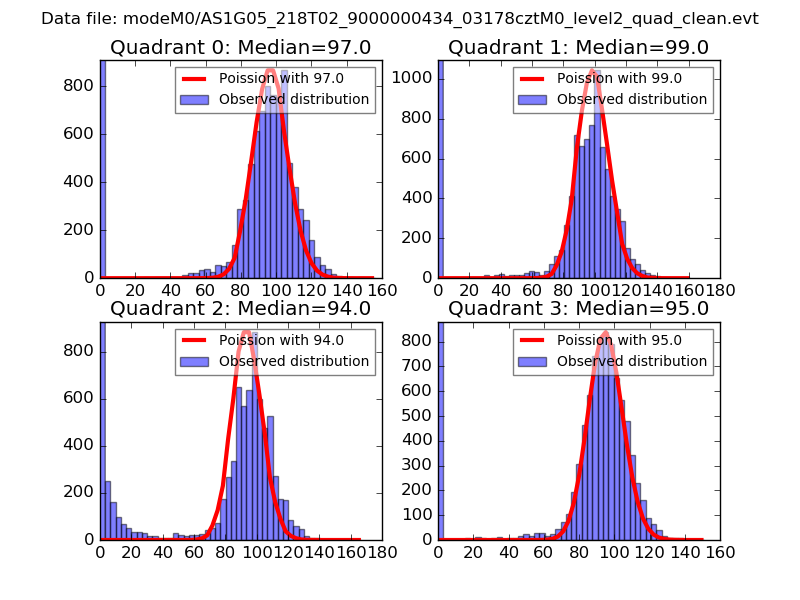 |
 |
| Quadrant-wise count rates Data is divided into 100 sec bins |
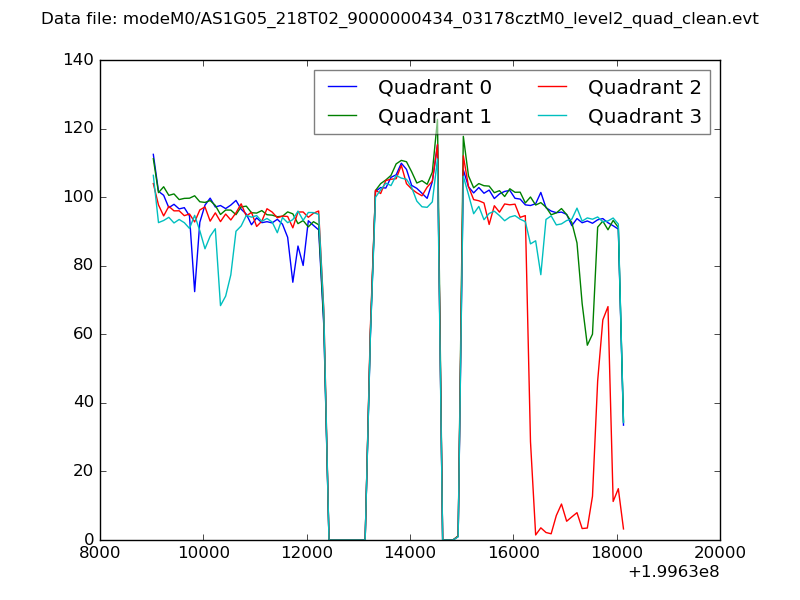 |
|
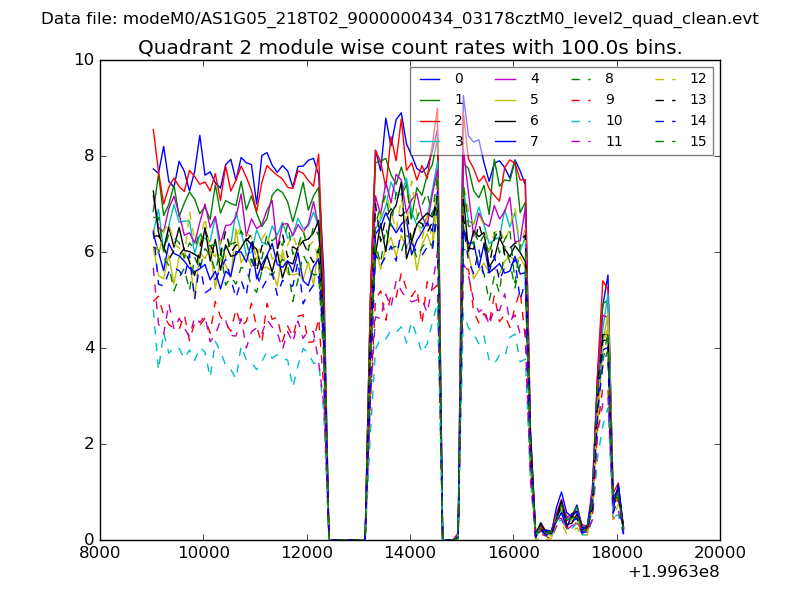
| Module-wise count rates for Quadrant A Data is divided into 100 sec bins |
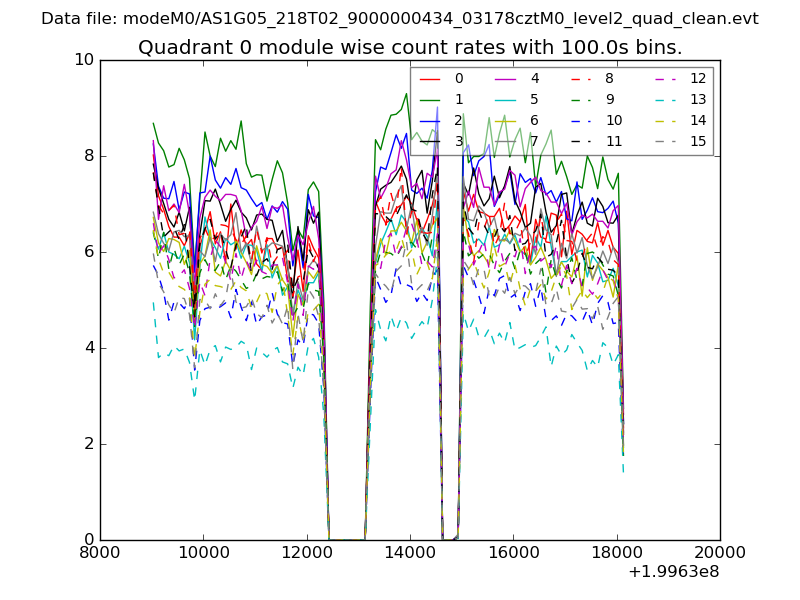 |
 |
| Module-wise count rates for Quadrant B Data is divided into 100 sec bins |
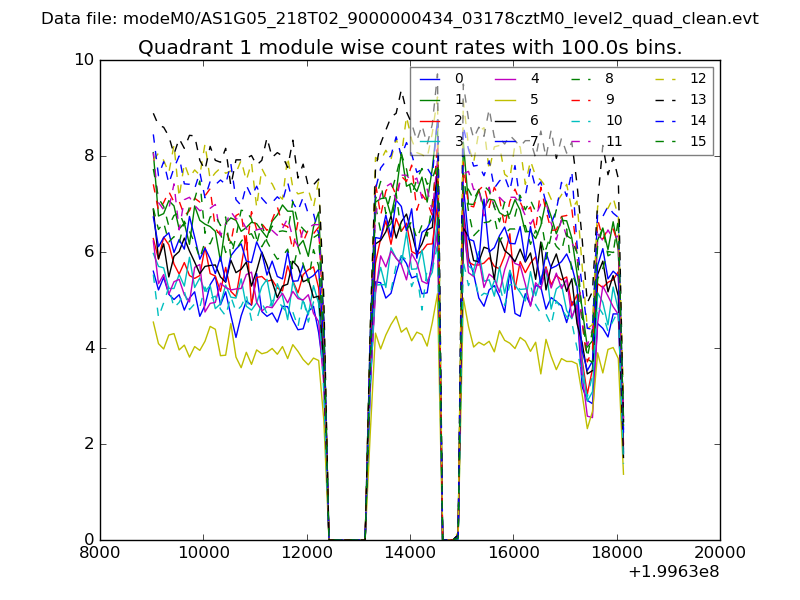 |
 |
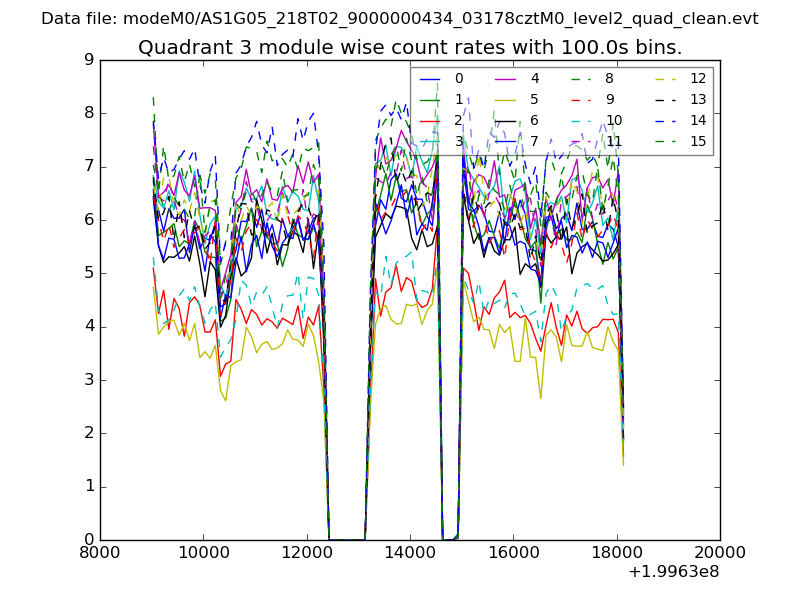
| Module-wise count rates for Quadrant C Data is divided into 100 sec bins |
 |
 |
| Module-wise count rates for Quadrant D Data is divided into 100 sec bins |
 |
 |
| Parameter | Plot |
|---|---|
| CZT HV Monitor | 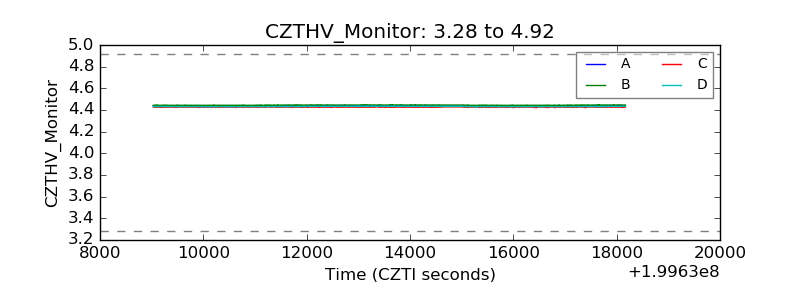 |
| D_VDD | 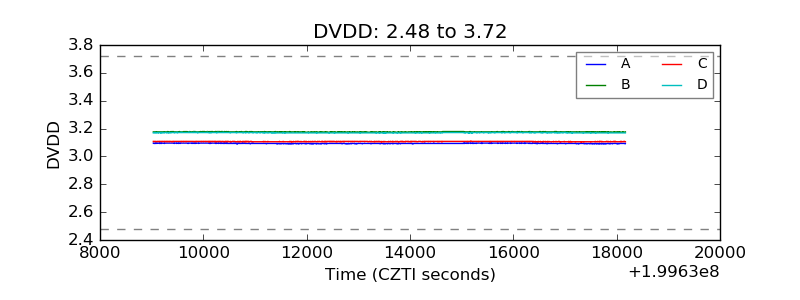 |
| Temperature 1 | 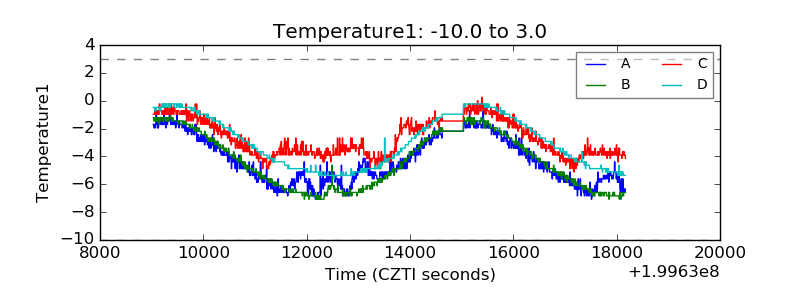 |
| Veto HV Monitor | 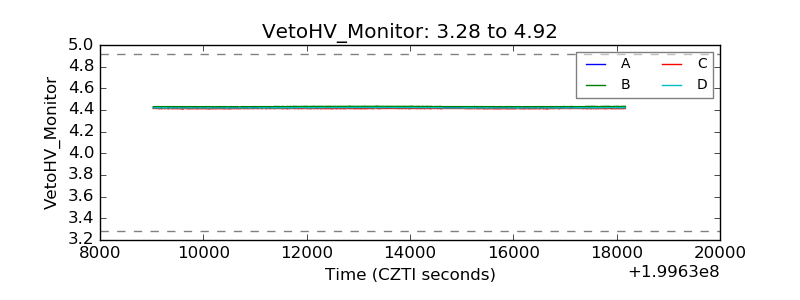 |
| Veto LLD | 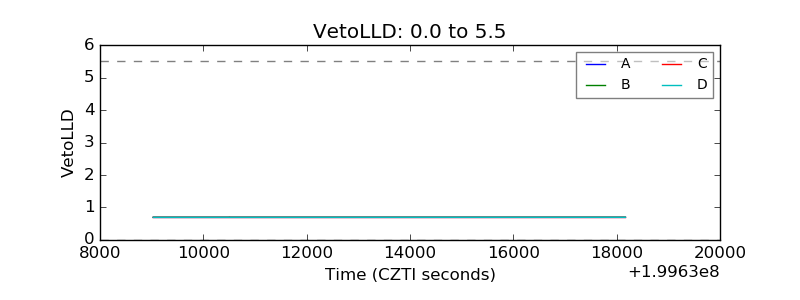 |
| Alpha Counter | 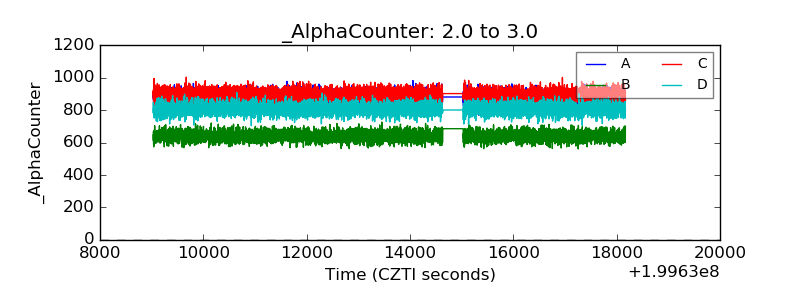 |
| _CPM_Rate | 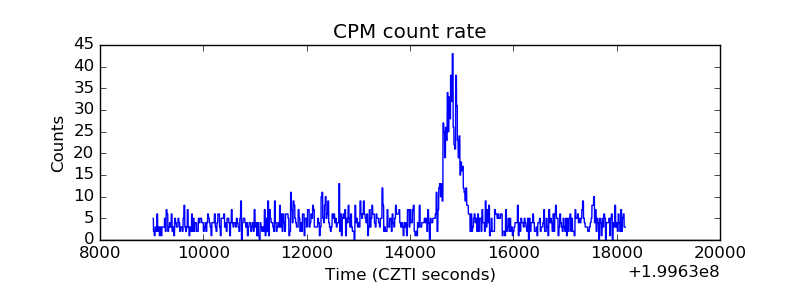 |
| CZT Counter | 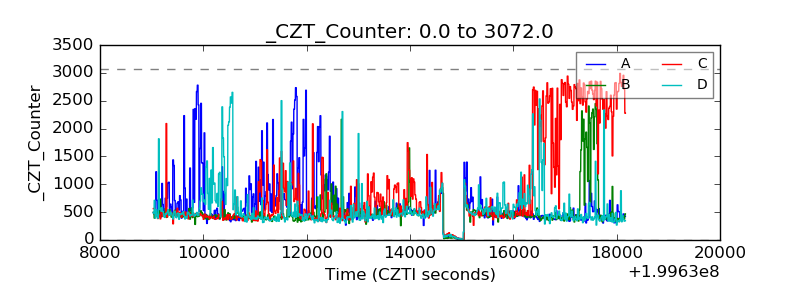 |
| +2.5 Volts monitor | 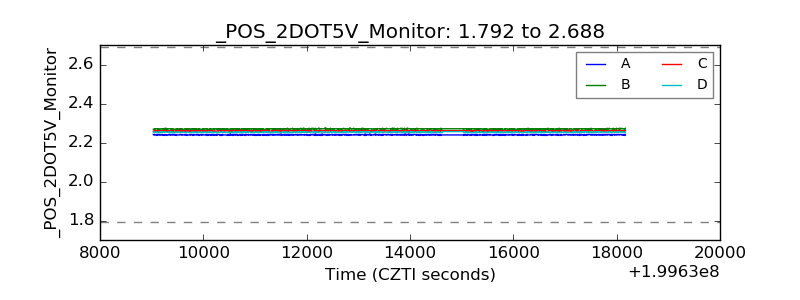 |
| +5 Volts monitor |  |
| Veto Counter | 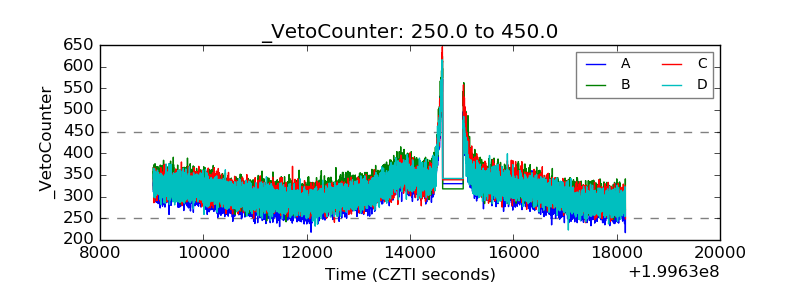 |