| Param | Original file | Final file |
|---|---|---|
| Filename | modeM0/AS1G05_127T01_9000000436_03179cztM0_level2.evt | modeM0/AS1G05_127T01_9000000436_03179cztM0_level2_quad_clean.evt |
| Size (bytes) | 592,208,640 | 87,108,480 |
| Size | 564.8 MB | 83.1 MB |
| Events in quadrant A | 3,993,657 | 542,503 |
| Events in quadrant B | 3,638,982 | 552,818 |
| Events in quadrant C | 6,208,421 | 541,110 |
| Events in quadrant D | 3,636,083 | 530,234 |
| Mode M9 | |||
|---|---|---|---|
| Quadrant | BADHDUFLAG | Total packets | Discarded packets |
| A | 0 | 10 | 0 |
| B | 0 | 10 | 0 |
| C | 0 | 10 | 0 |
| D | 0 | 11 | 0 |
| Mode SS | |||
|---|---|---|---|
| Quadrant | BADHDUFLAG | Total packets | Discarded packets |
| A | 0 | 138 | 0 |
| B | 0 | 138 | 0 |
| C | 0 | 138 | 0 |
| D | 0 | 138 | 0 |
| Mode M0 | |||
|---|---|---|---|
| Quadrant | BADHDUFLAG | Total packets | Discarded packets |
| A | 0 | 16562 | 3 |
| B | 0 | 15217 | 2 |
| C | 0 | 23159 | 2 |
| D | 0 | 15631 | 2 |
| Quadrant | Total seconds | Saturated seconds | Saturation percentage |
|---|---|---|---|
| A | 6756 | 261 | 3.863233% |
| B | 6756 | 121 | 1.791001% |
| C | 6756 | 711 | 10.523979% |
| D | 6756 | 128 | 1.894612% |
Noise dominated data is calculated using 1-second bins in cleaned event files. If a bin has >2000 counts, and if more than 50% of those come from <1% of pixels, then it is considered to be noise-dominated and hence unusable.
| Quadrant | # 1 sec bins | Bins with >0 counts | Bins with >2000 counts | High rate bins dominated by noise | Noise dominated (total time) | Noise dominated (detector-on time) | Marked lightcurve |
|---|---|---|---|---|---|---|---|
| A | 7656 | 6757 | 154 | 154 | 2.01% | 2.28% | 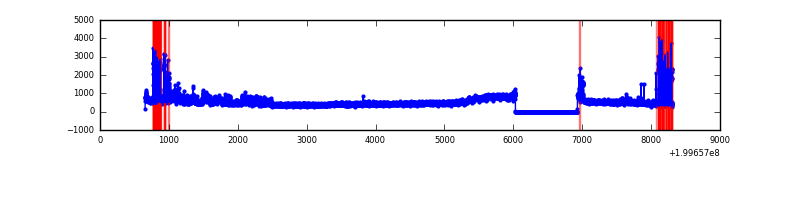 |
| B | 7656 | 6756 | 43 | 43 | 0.56% | 0.64% | 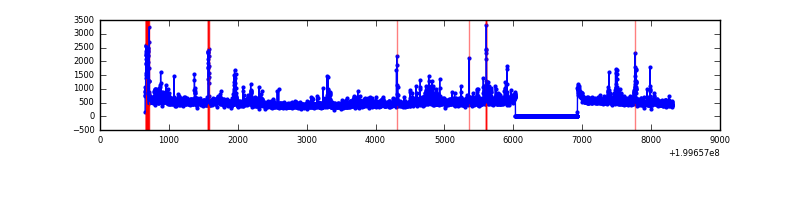 |
| C | 7656 | 6756 | 576 | 576 | 7.52% | 8.53% | 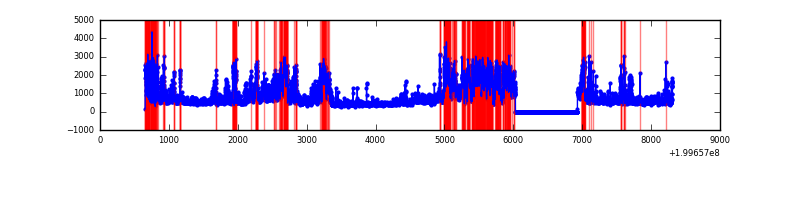 |
| D | 7656 | 6756 | 79 | 79 | 1.03% | 1.17% | 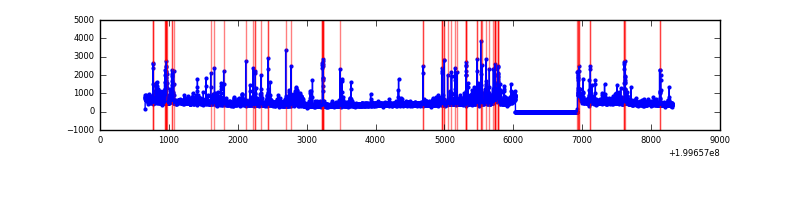 |
Top three noisy pixels from each quadrant. If the there are fewer than three noisy pixels in the level2.evt file, extra rows are filled as -1
| Pixel properties | Quadrant properties | ||||||
|---|---|---|---|---|---|---|---|
| Quadrant | DetID | PixID | Counts | Sigma | Mean | Median | Sigma |
| A | 14 | 249 | 917237 | 5666.86 | 781 | 764 | 161.7 |
| A | 8 | 15 | 30137 | 181.62 | 781 | 764 | 161.7 |
| A | 12 | 247 | 16473 | 97.13 | 781 | 764 | 161.7 |
| B | 5 | 70 | 201366 | 1282.8 | 808 | 792 | 156.4 |
| B | 4 | 80 | 87037 | 551.59 | 808 | 792 | 156.4 |
| B | 2 | 249 | 58167 | 366.95 | 808 | 792 | 156.4 |
| C | 1 | 192 | 2408941 | 13691.37 | 754 | 760 | 175.9 |
| C | 12 | 206 | 643486 | 3654.13 | 754 | 760 | 175.9 |
| C | 14 | 223 | 108552 | 612.84 | 754 | 760 | 175.9 |
| D | 13 | 223 | 230303 | 1226.94 | 768 | 745 | 187.1 |
| D | 5 | 233 | 157485 | 837.74 | 768 | 745 | 187.1 |
| D | 13 | 120 | 103180 | 547.49 | 768 | 745 | 187.1 |
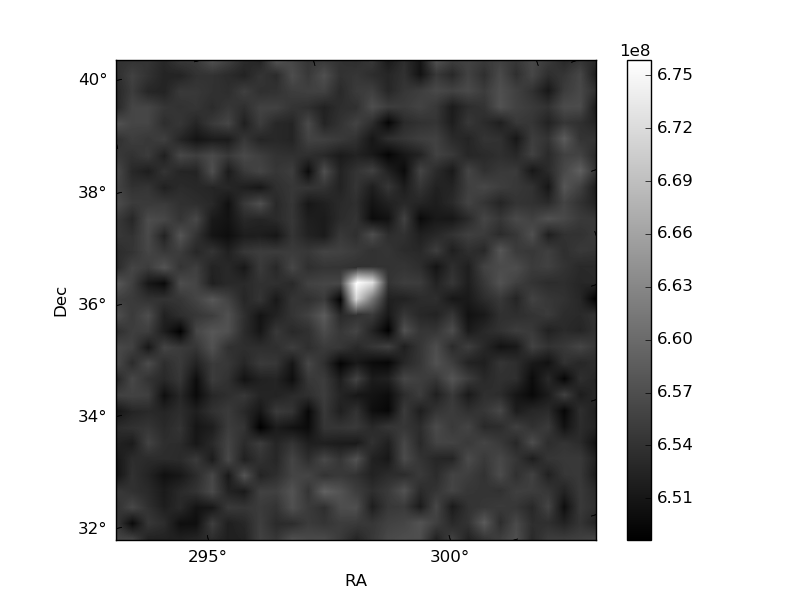
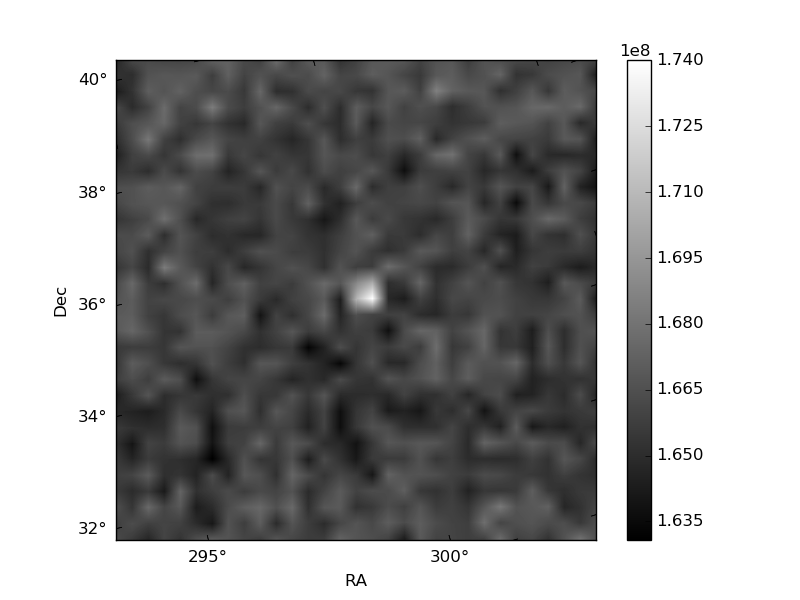
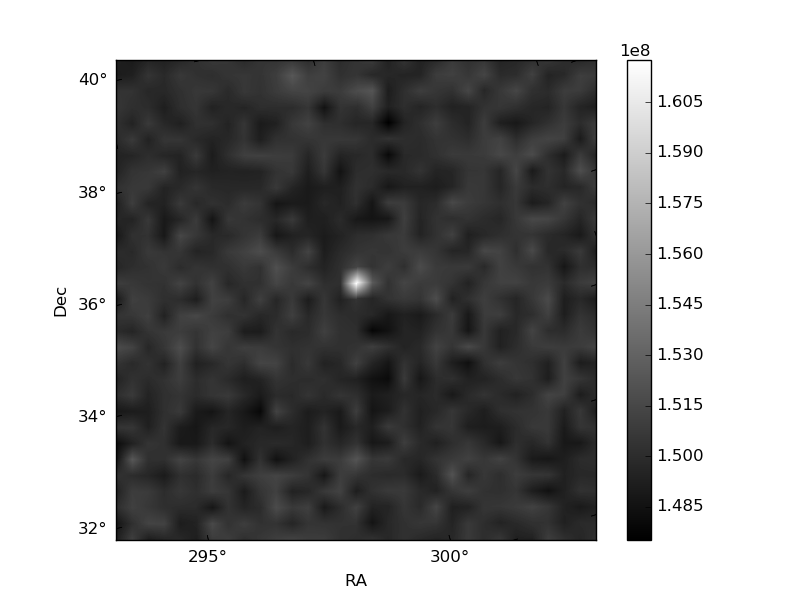
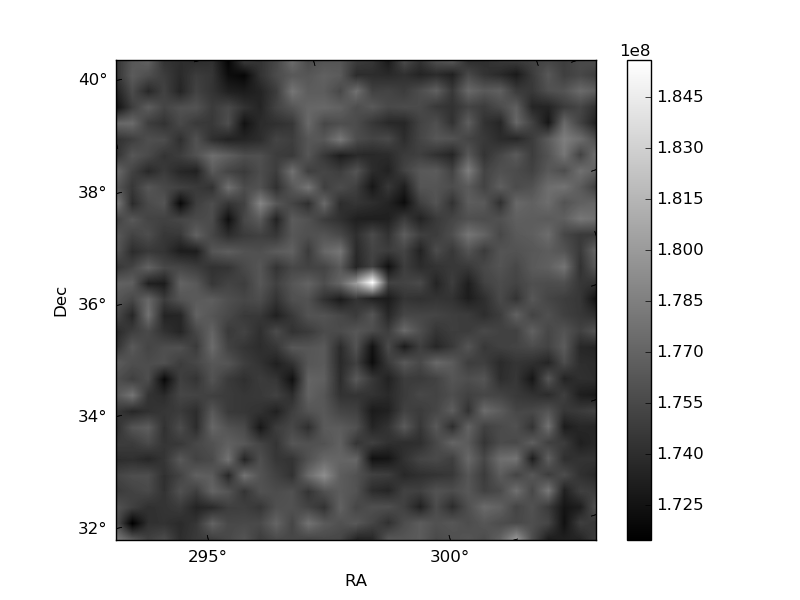
Histogram calculated using DETX and DETY for each event in the final _common_clean file
| Quadrant A | 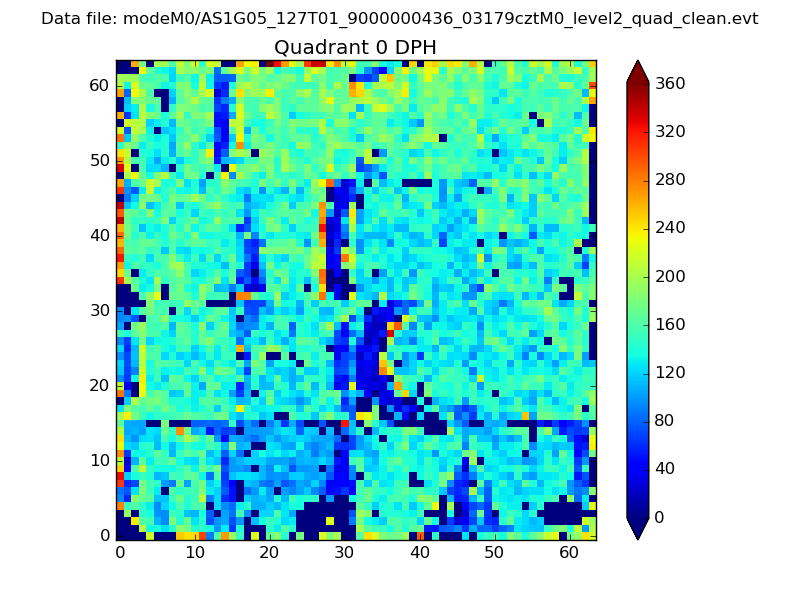 |
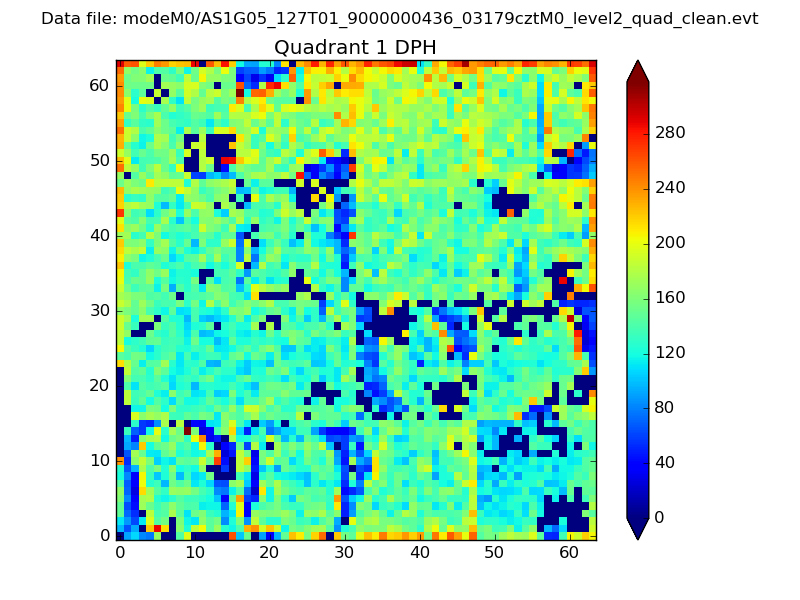 |
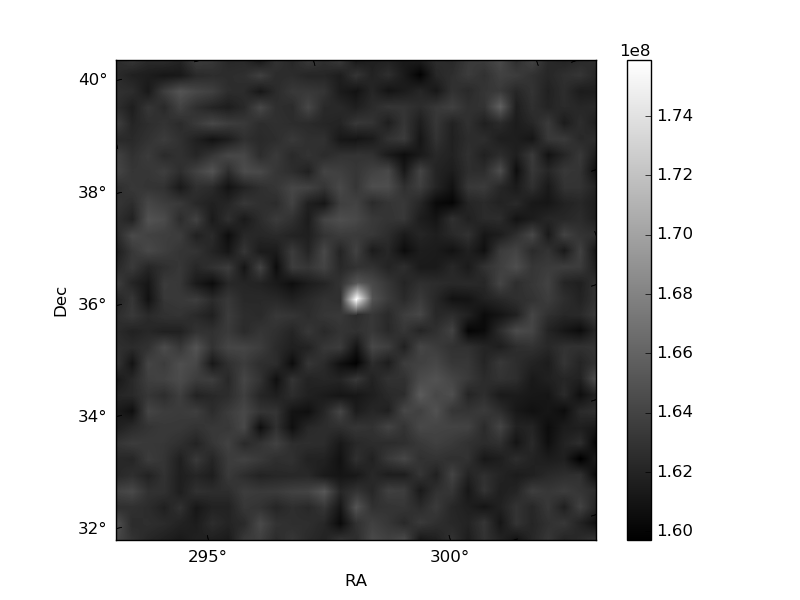
Quadrant B |
|---|---|---|---|
| Quadrant D | 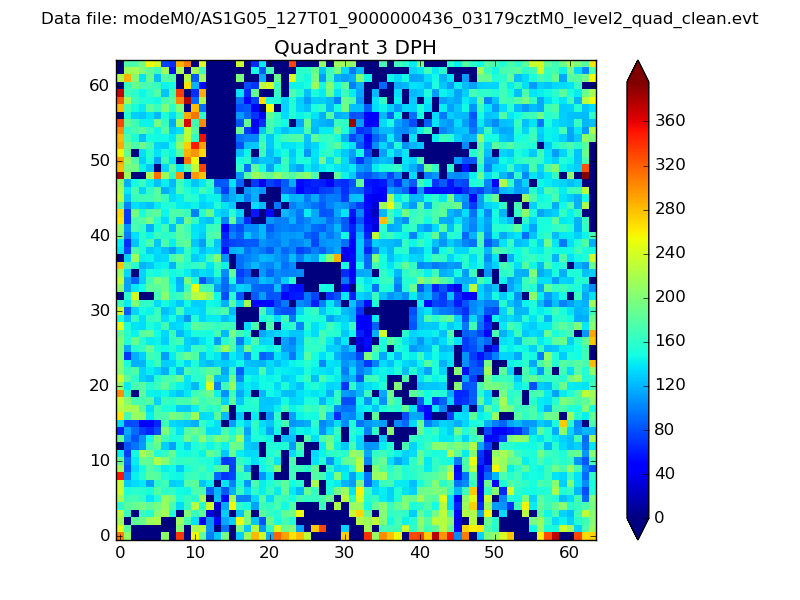 |
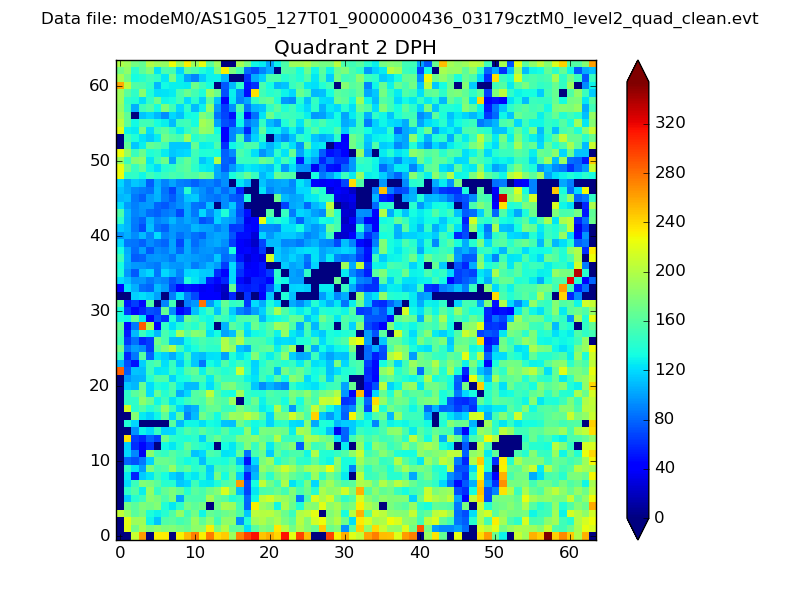 |
Quadrant C |
| Plot type | Count rate plots | Images |
|---|---|---|
| Comparison with Poisson distribution Blue bars denote a histogram of data divided into 1 sec bins. Red curve is a Poisson curve with rate = median count rate of data. |
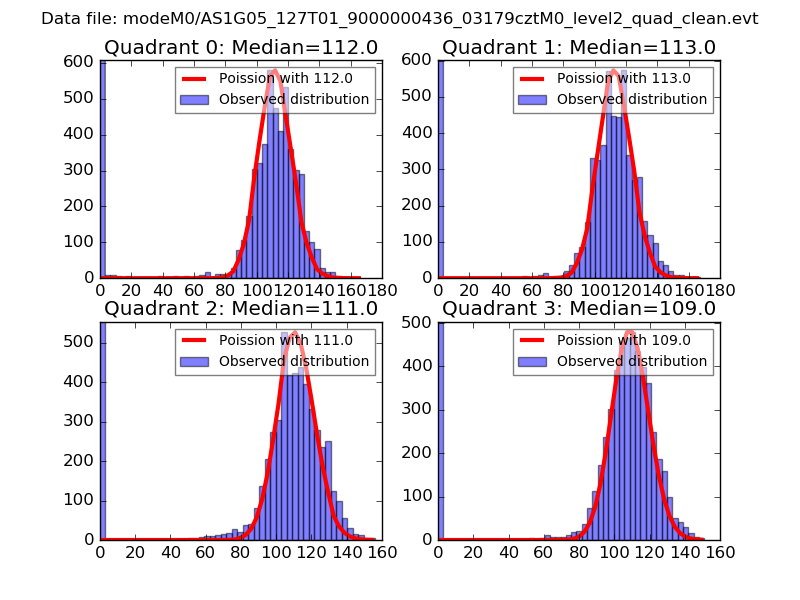 |
 |
| Quadrant-wise count rates Data is divided into 100 sec bins |
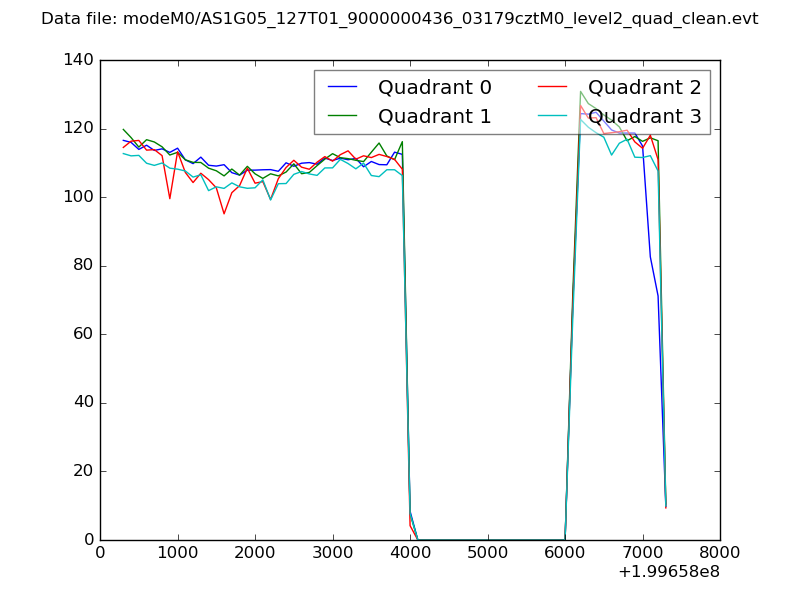 |
|
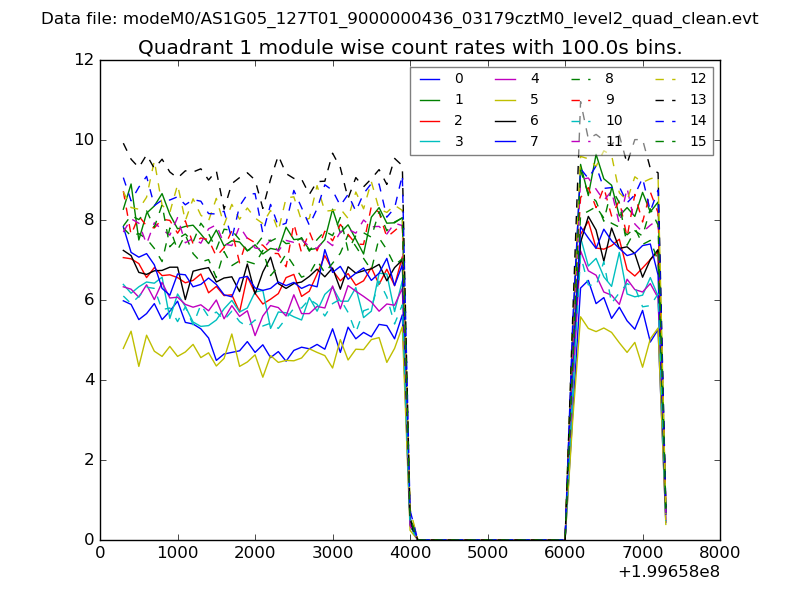
| Module-wise count rates for Quadrant A Data is divided into 100 sec bins |
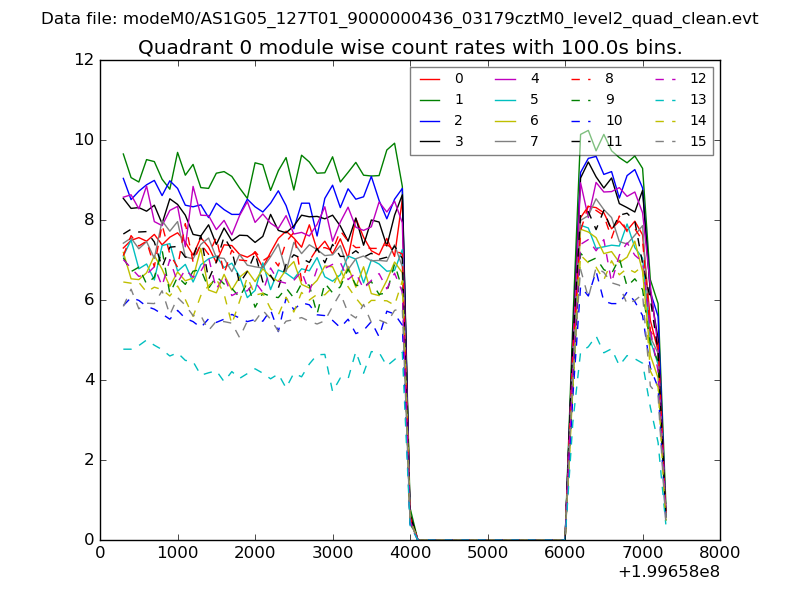 |
 |
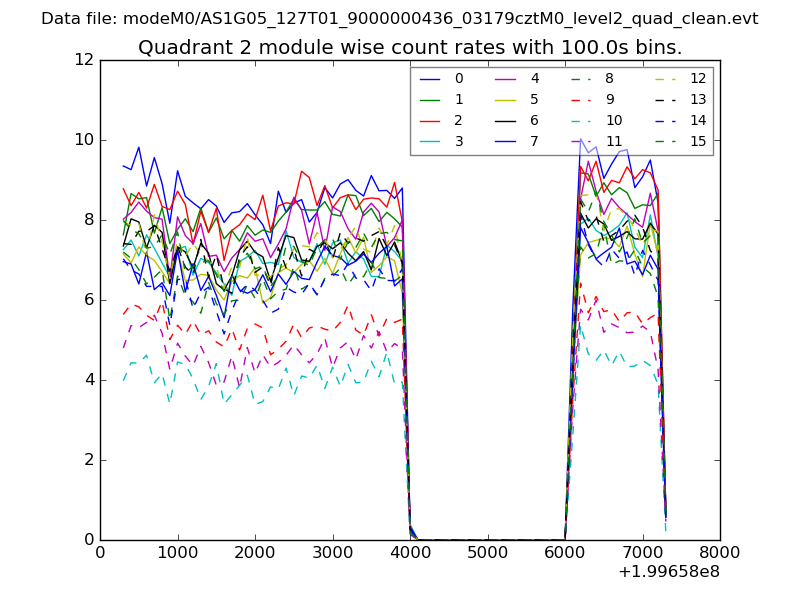
| Module-wise count rates for Quadrant B Data is divided into 100 sec bins |
 |
 |
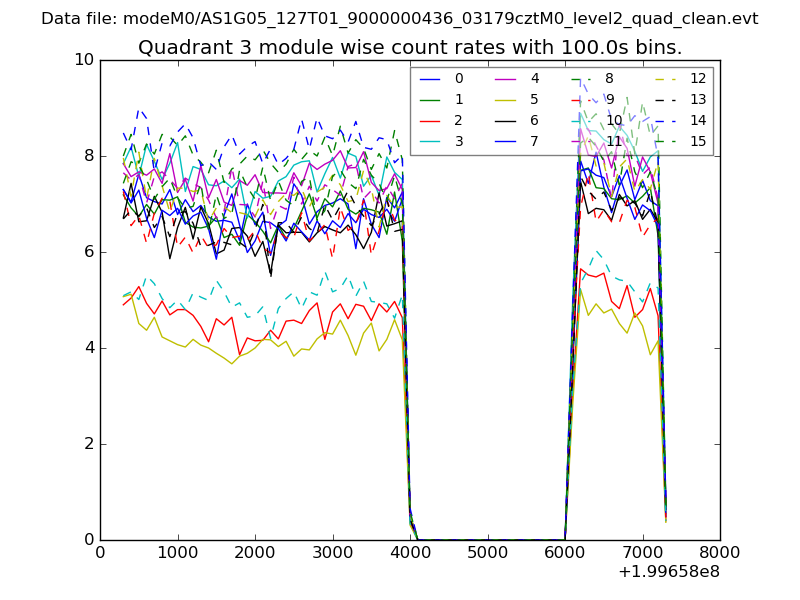
| Module-wise count rates for Quadrant C Data is divided into 100 sec bins |
 |
 |
| Module-wise count rates for Quadrant D Data is divided into 100 sec bins |
 |
 |
| Parameter | Plot |
|---|---|
| CZT HV Monitor | 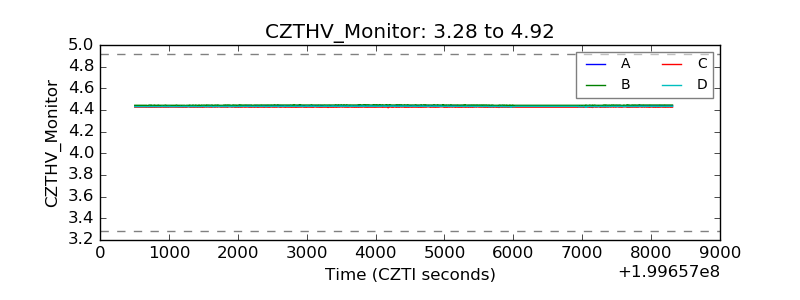 |
| D_VDD | 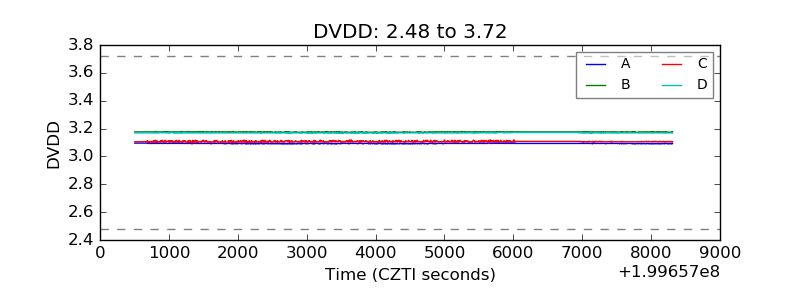 |
| Temperature 1 |  |
| Veto HV Monitor | 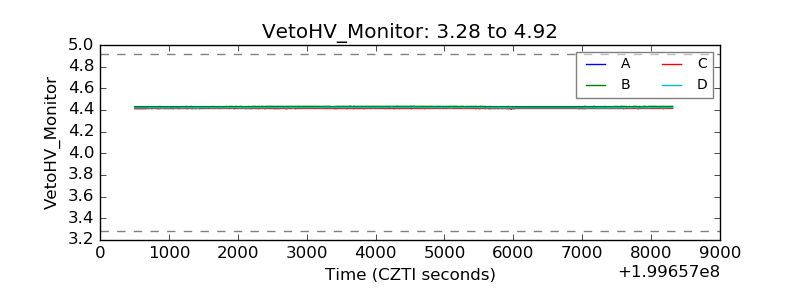 |
| Veto LLD | 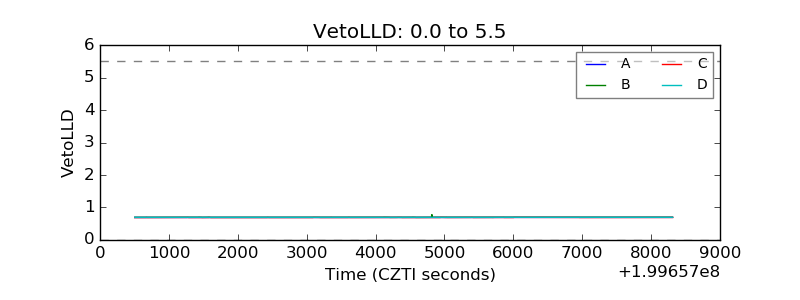 |
| Alpha Counter | 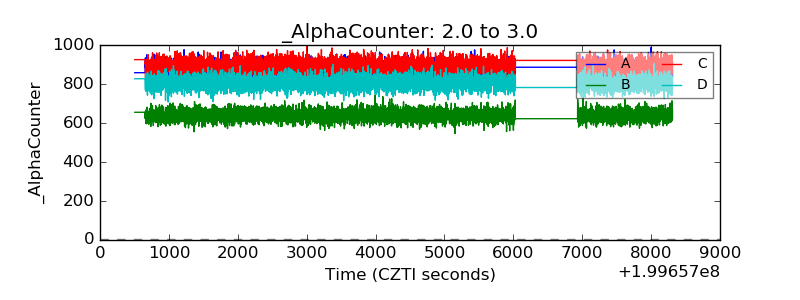 |
| _CPM_Rate | 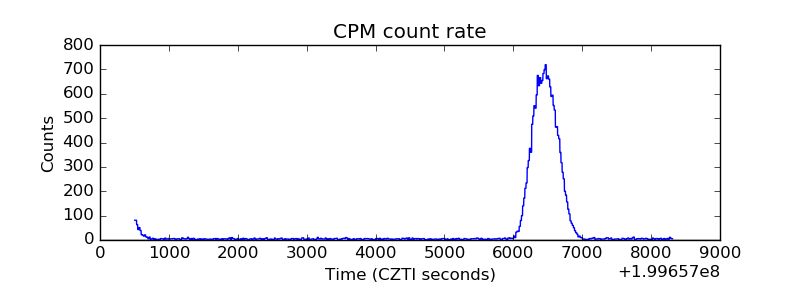 |
| CZT Counter | 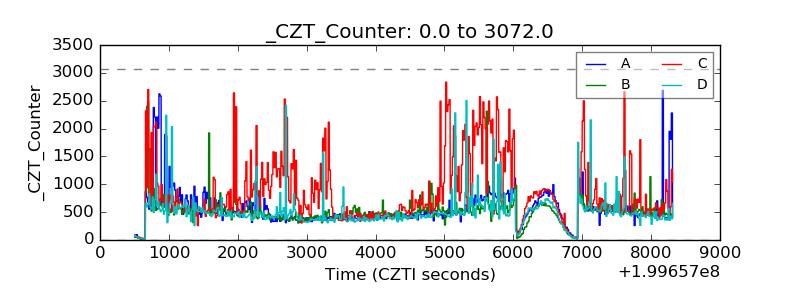 |
| +2.5 Volts monitor |  |
| +5 Volts monitor |  |
| Veto Counter | 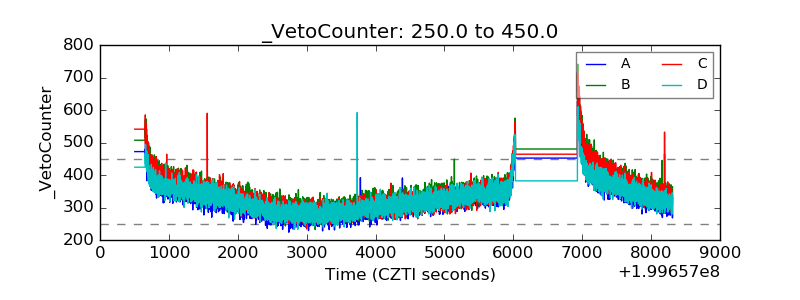 |