| Param | Original file | Final file |
|---|---|---|
| Filename | modeM0/AS1G05_127T01_9000000436_03181cztM0_level2.evt | modeM0/AS1G05_127T01_9000000436_03181cztM0_level2_quad_clean.evt |
| Size (bytes) | 613,111,680 | 88,156,800 |
| Size | 584.7 MB | 84.1 MB |
| Events in quadrant A | 3,716,054 | 569,247 |
| Events in quadrant B | 3,340,445 | 596,318 |
| Events in quadrant C | 7,675,510 | 478,681 |
| Events in quadrant D | 3,387,396 | 563,156 |
| Mode M9 | |||
|---|---|---|---|
| Quadrant | BADHDUFLAG | Total packets | Discarded packets |
| A | 0 | 20 | 0 |
| B | 0 | 20 | 0 |
| C | 0 | 20 | 0 |
| D | 0 | 20 | 0 |
| Mode SS | |||
|---|---|---|---|
| Quadrant | BADHDUFLAG | Total packets | Discarded packets |
| A | 0 | 136 | 0 |
| B | 0 | 136 | 0 |
| C | 0 | 136 | 0 |
| D | 0 | 136 | 0 |
| Mode M0 | |||
|---|---|---|---|
| Quadrant | BADHDUFLAG | Total packets | Discarded packets |
| A | 0 | 15513 | 3 |
| B | 0 | 14455 | 2 |
| C | 0 | 27409 | 2 |
| D | 0 | 14893 | 2 |
| Quadrant | Total seconds | Saturated seconds | Saturation percentage |
|---|---|---|---|
| A | 6619 | 290 | 4.381326% |
| B | 6619 | 91 | 1.374830% |
| C | 6619 | 1837 | 27.753437% |
| D | 6619 | 110 | 1.661882% |
Noise dominated data is calculated using 1-second bins in cleaned event files. If a bin has >2000 counts, and if more than 50% of those come from <1% of pixels, then it is considered to be noise-dominated and hence unusable.
| Quadrant | # 1 sec bins | Bins with >0 counts | Bins with >2000 counts | High rate bins dominated by noise | Noise dominated (total time) | Noise dominated (detector-on time) | Marked lightcurve |
|---|---|---|---|---|---|---|---|
| A | 8599 | 6621 | 180 | 180 | 2.09% | 2.72% | 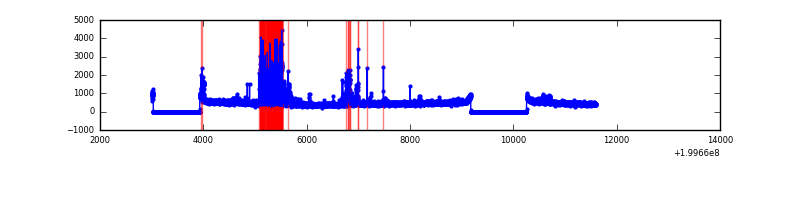 |
| B | 8599 | 6619 | 9 | 9 | 0.10% | 0.14% | 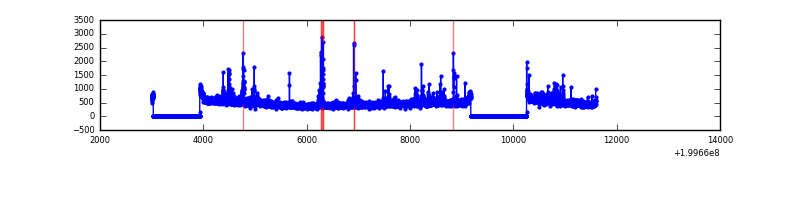 |
| C | 8598 | 6618 | 1511 | 1511 | 17.57% | 22.83% | 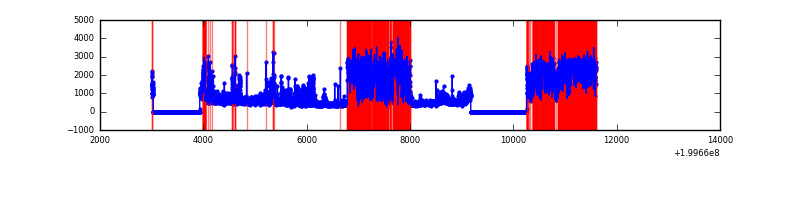 |
| D | 8599 | 6620 | 61 | 61 | 0.71% | 0.92% | 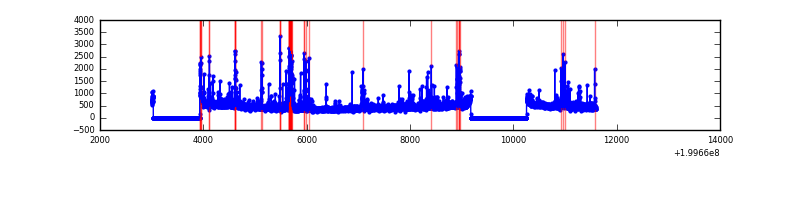 |
Top three noisy pixels from each quadrant. If the there are fewer than three noisy pixels in the level2.evt file, extra rows are filled as -1
| Pixel properties | Quadrant properties | ||||||
|---|---|---|---|---|---|---|---|
| Quadrant | DetID | PixID | Counts | Sigma | Mean | Median | Sigma |
| A | 14 | 249 | 700762 | 4464.46 | 763 | 749 | 156.8 |
| A | 8 | 15 | 63302 | 398.94 | 763 | 749 | 156.8 |
| A | 12 | 194 | 8188 | 47.44 | 763 | 749 | 156.8 |
| B | 4 | 80 | 113988 | 740.92 | 798 | 781 | 152.8 |
| B | 15 | 85 | 52616 | 339.25 | 798 | 781 | 152.8 |
| B | 2 | 249 | 33365 | 213.25 | 798 | 781 | 152.8 |
| C | 12 | 206 | 4402509 | 28251.18 | 665 | 670 | 155.8 |
| C | 1 | 192 | 429224 | 2750.48 | 665 | 670 | 155.8 |
| C | 14 | 223 | 151647 | 968.98 | 665 | 670 | 155.8 |
| D | 13 | 120 | 174128 | 947.28 | 752 | 731 | 183.0 |
| D | 5 | 233 | 123062 | 668.3 | 752 | 731 | 183.0 |
| D | 12 | 233 | 71702 | 387.72 | 752 | 731 | 183.0 |
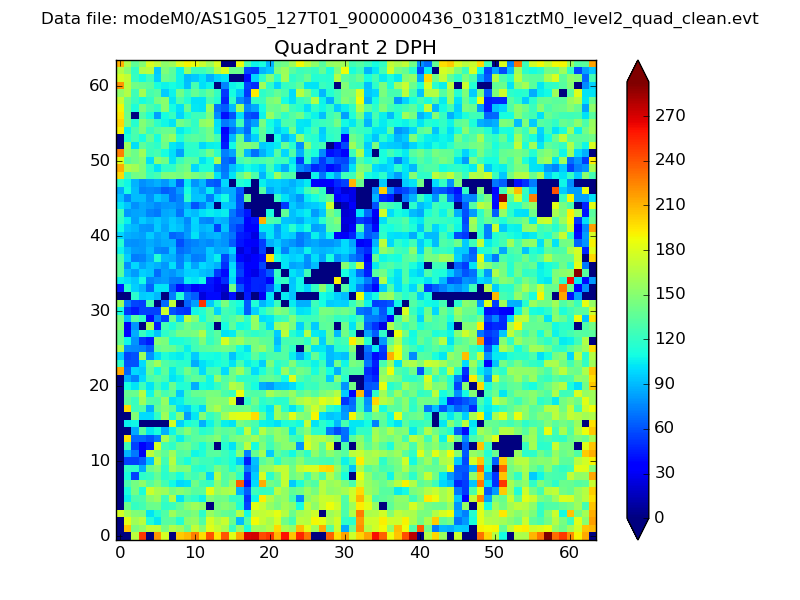
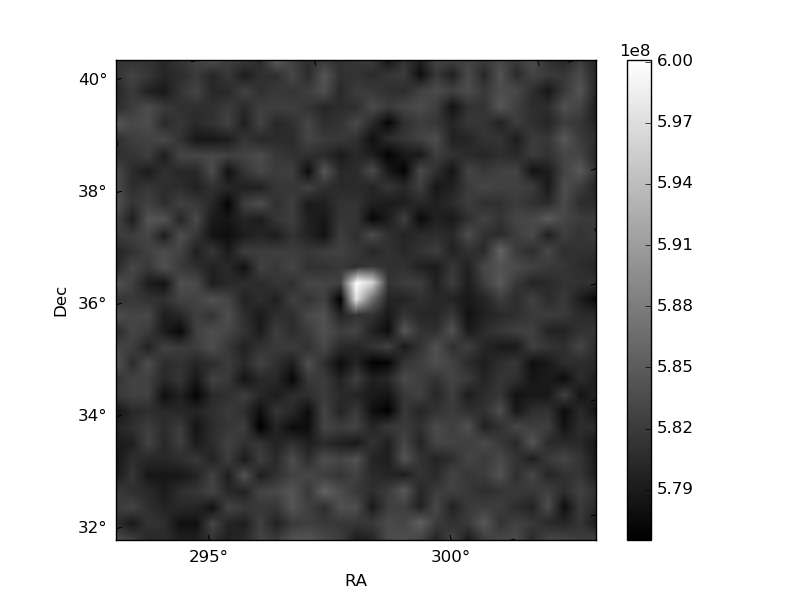
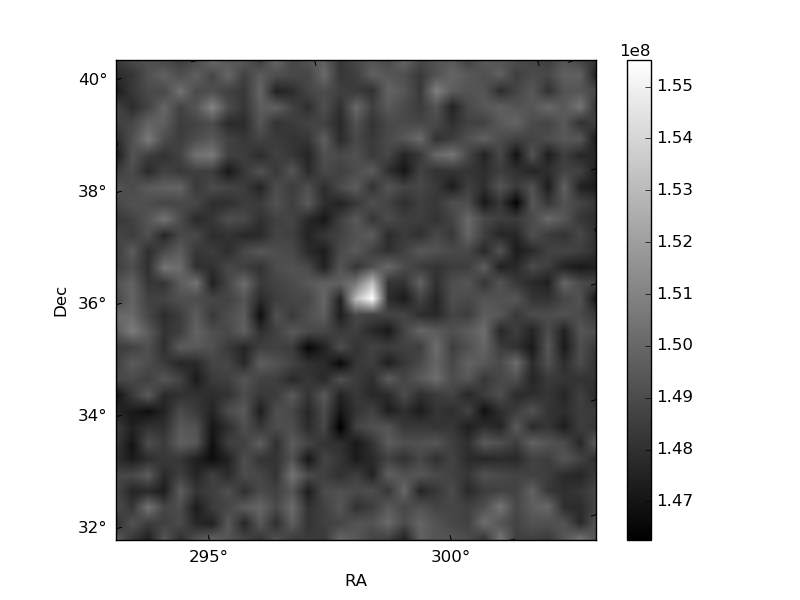
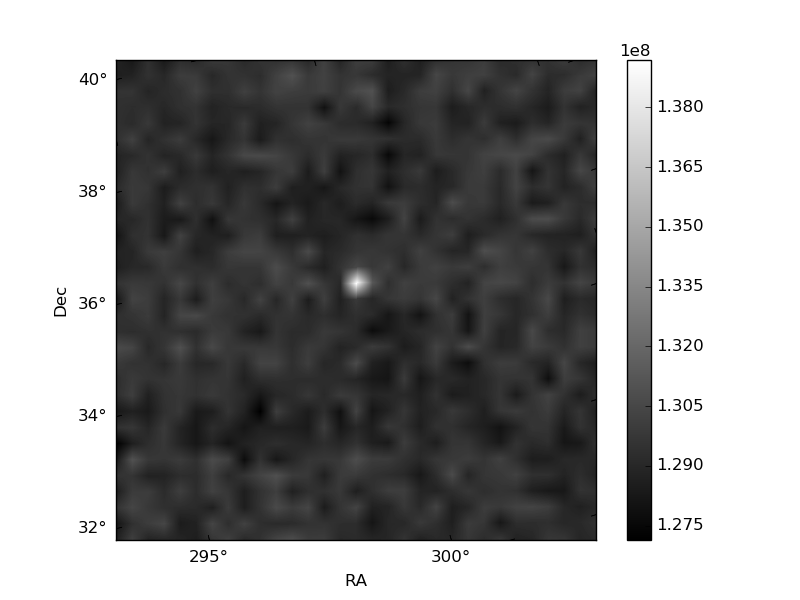
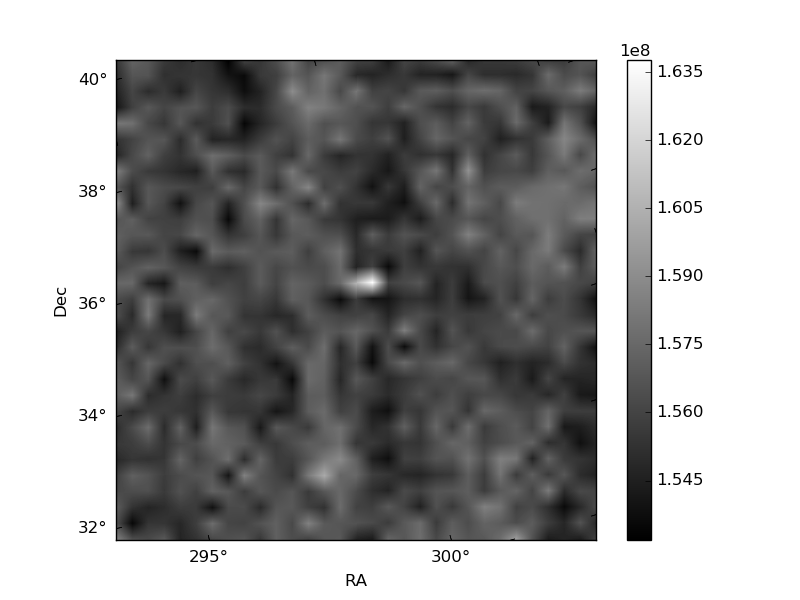
Histogram calculated using DETX and DETY for each event in the final _common_clean file
| Quadrant A | 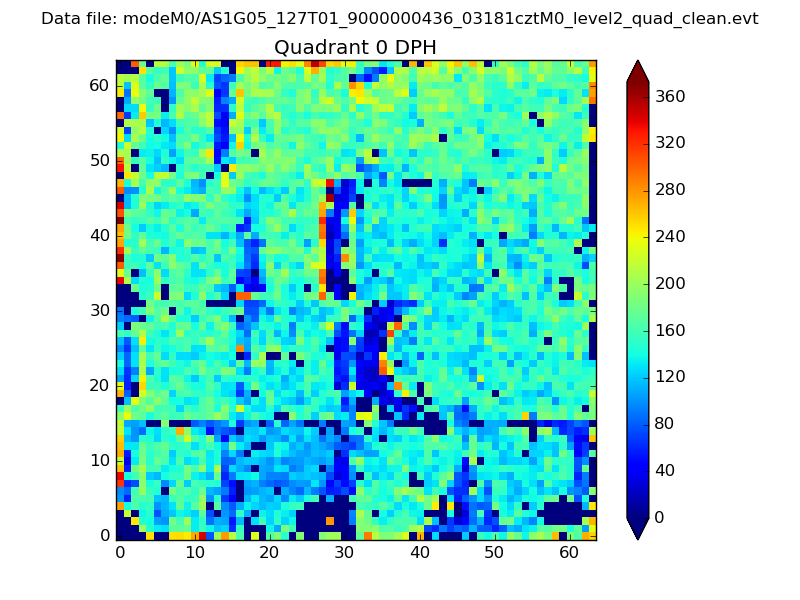 |
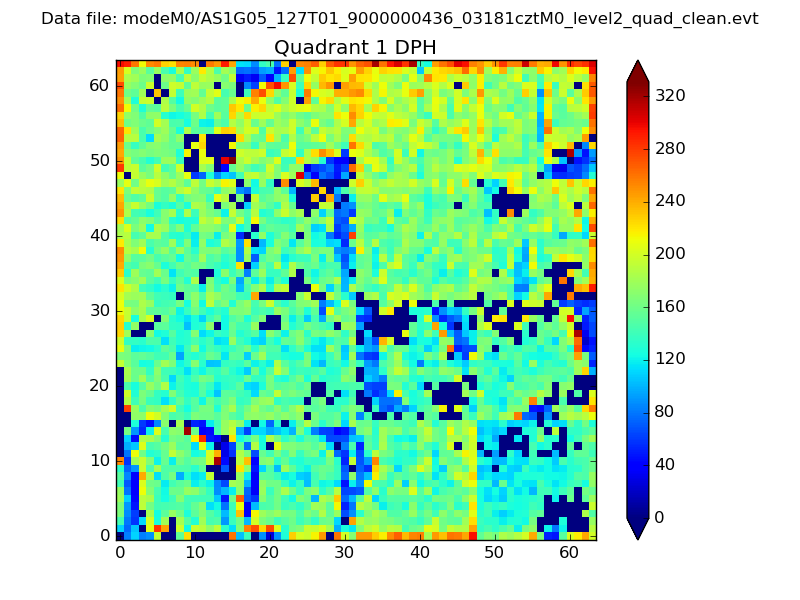 |
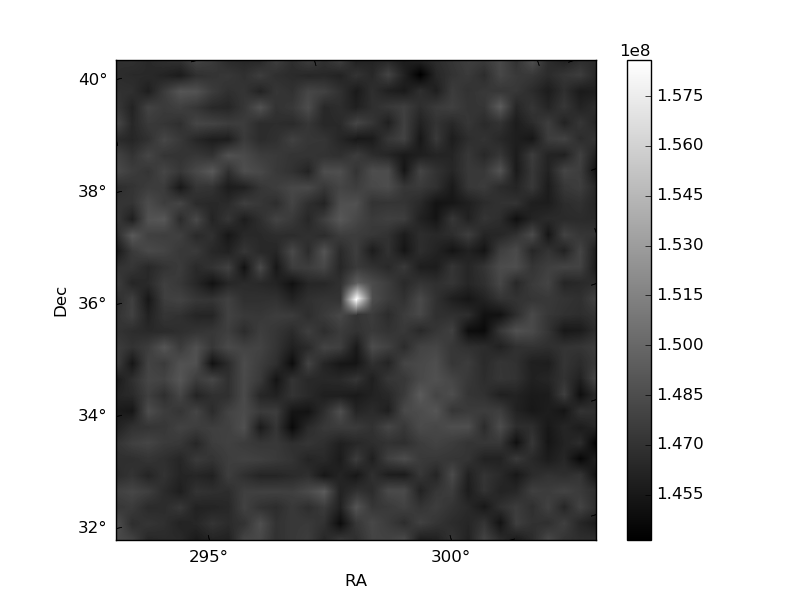
Quadrant B |
|---|---|---|---|
| Quadrant D | 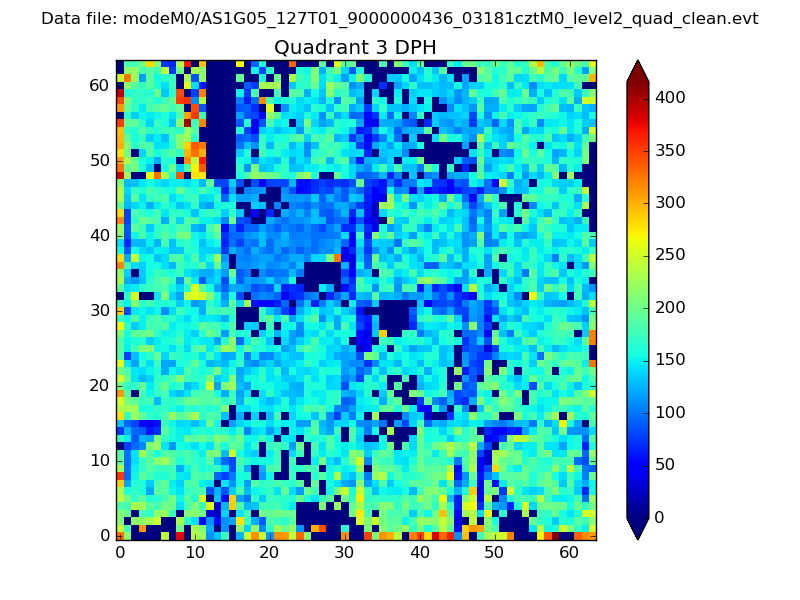 |
 |
Quadrant C |
| Plot type | Count rate plots | Images |
|---|---|---|
| Comparison with Poisson distribution Blue bars denote a histogram of data divided into 1 sec bins. Red curve is a Poisson curve with rate = median count rate of data. |
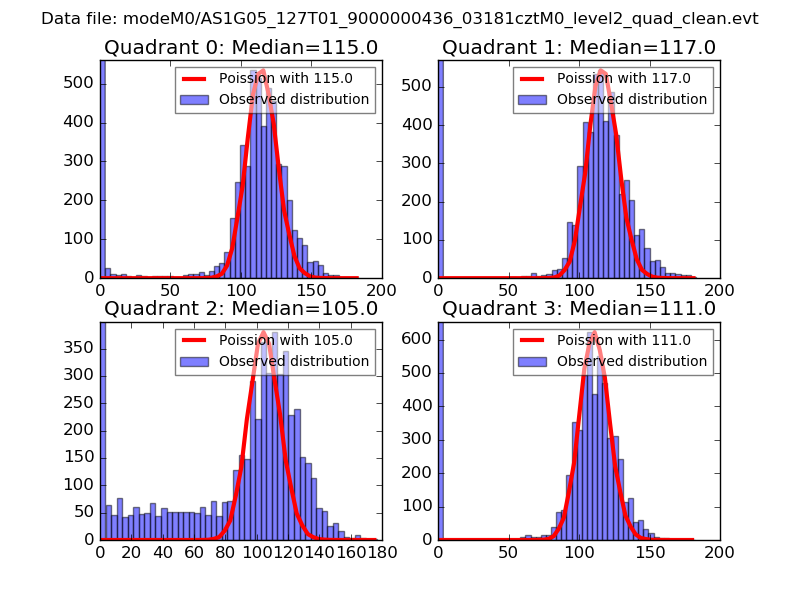 |
 |
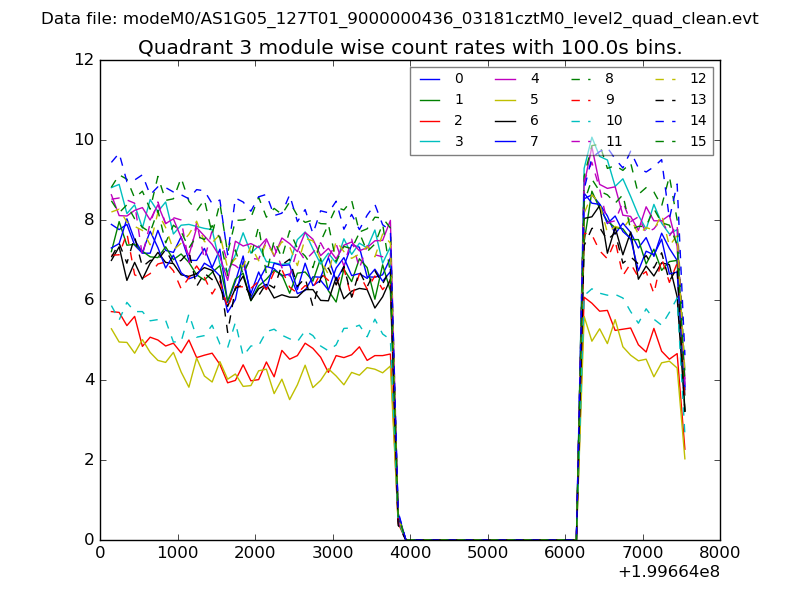
| Quadrant-wise count rates Data is divided into 100 sec bins |
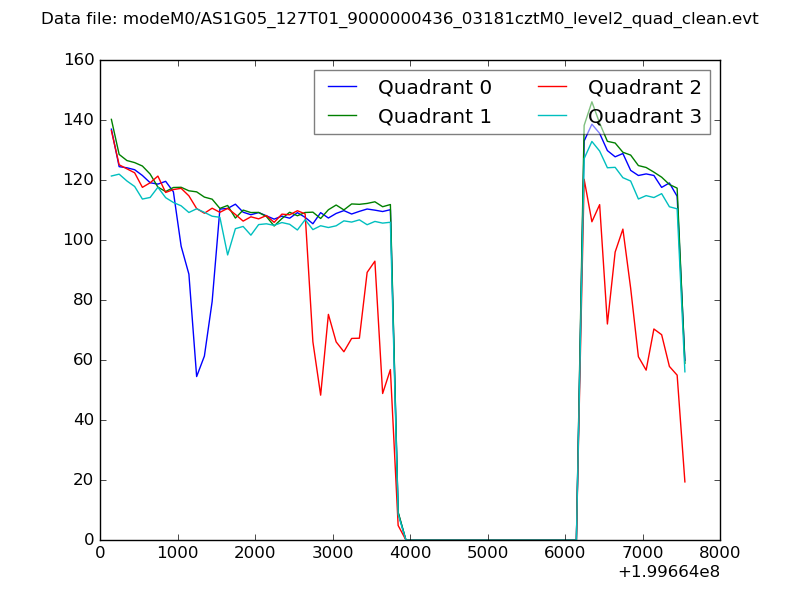 |
|
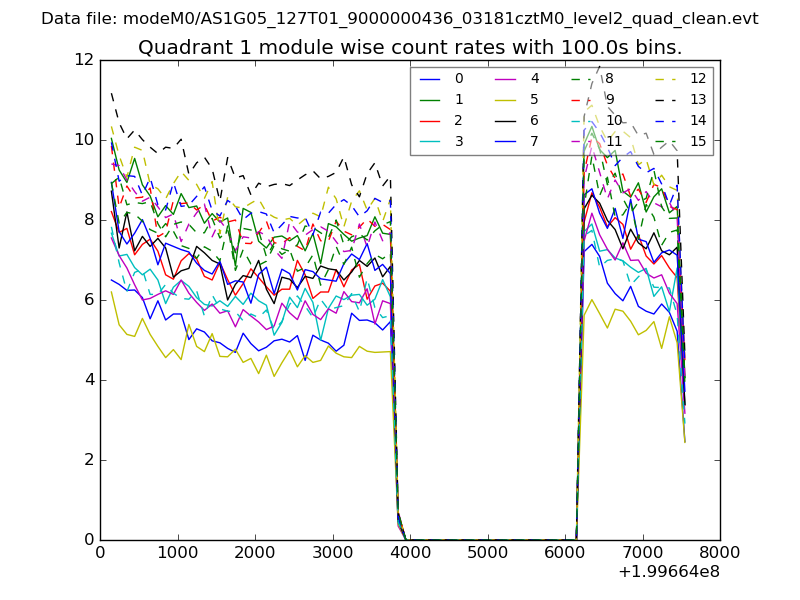
| Module-wise count rates for Quadrant A Data is divided into 100 sec bins |
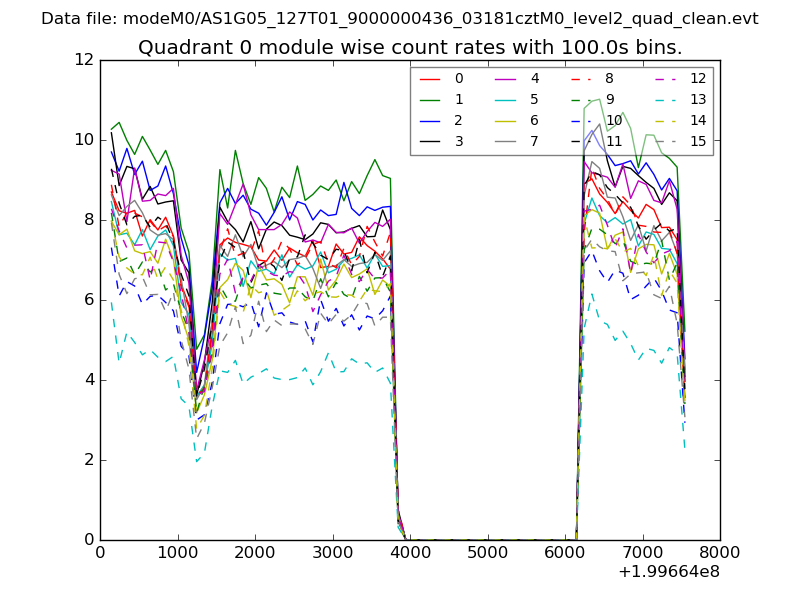 |
 |
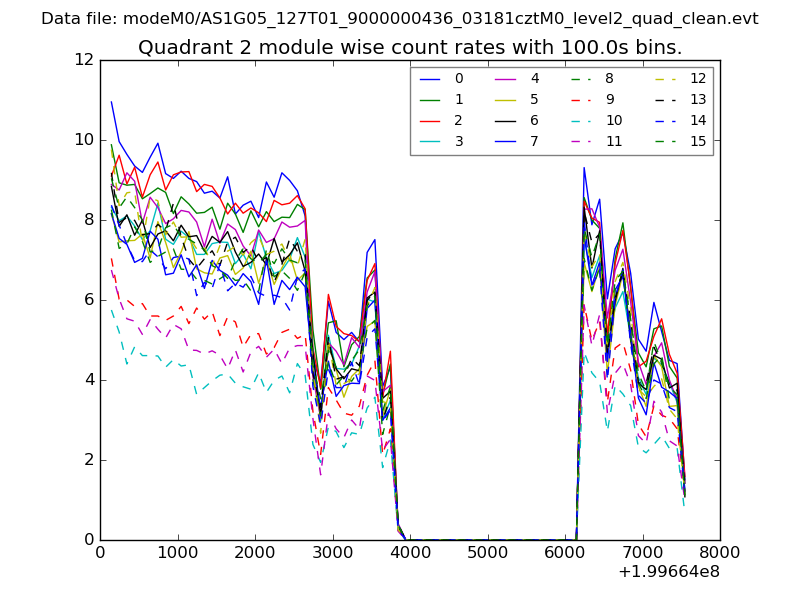
| Module-wise count rates for Quadrant B Data is divided into 100 sec bins |
 |
 |
| Module-wise count rates for Quadrant C Data is divided into 100 sec bins |
 |
 |
| Module-wise count rates for Quadrant D Data is divided into 100 sec bins |
 |
 |
| Parameter | Plot |
|---|---|
| CZT HV Monitor | 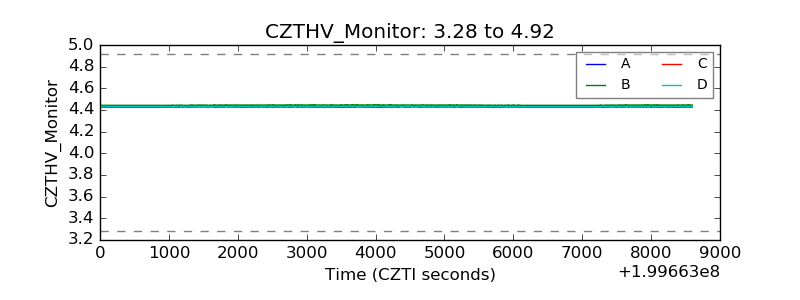 |
| D_VDD | 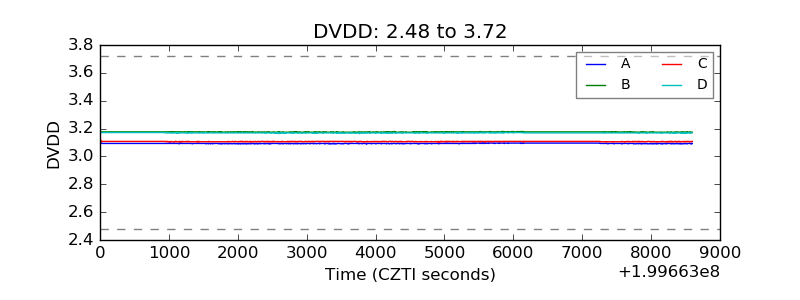 |
| Temperature 1 | 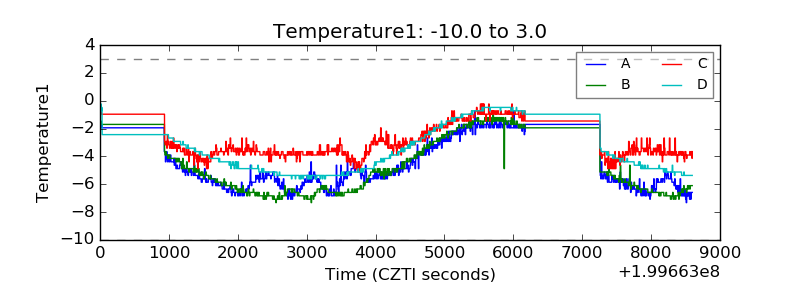 |
| Veto HV Monitor | 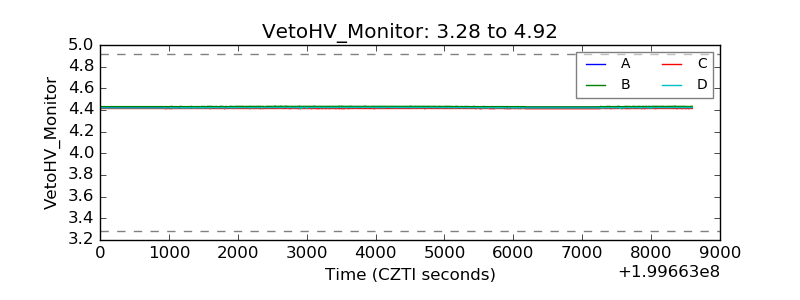 |
| Veto LLD | 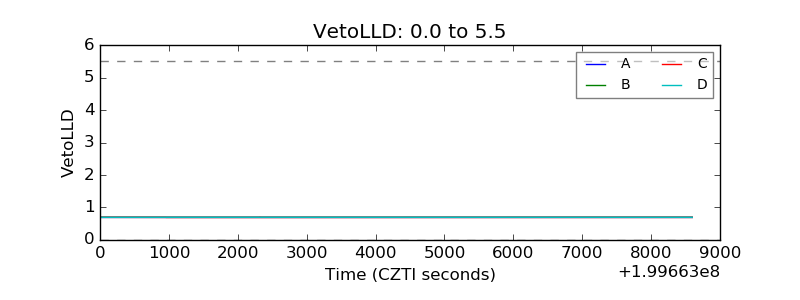 |
| Alpha Counter |  |
| _CPM_Rate |  |
| CZT Counter | 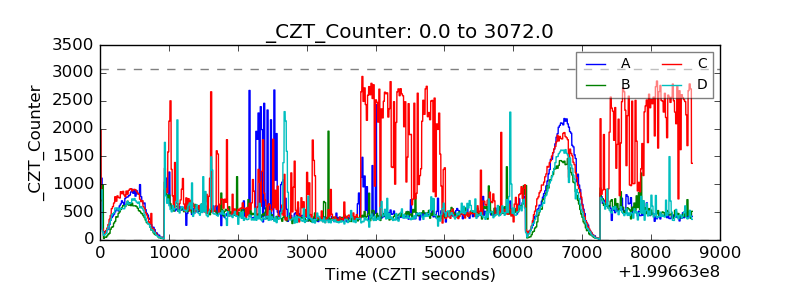 |
| +2.5 Volts monitor |  |
| +5 Volts monitor |  |
| _ROLL_ROT | 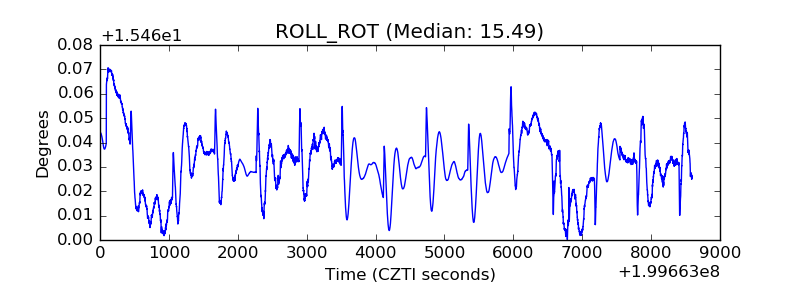 |
| _Roll_DEC | 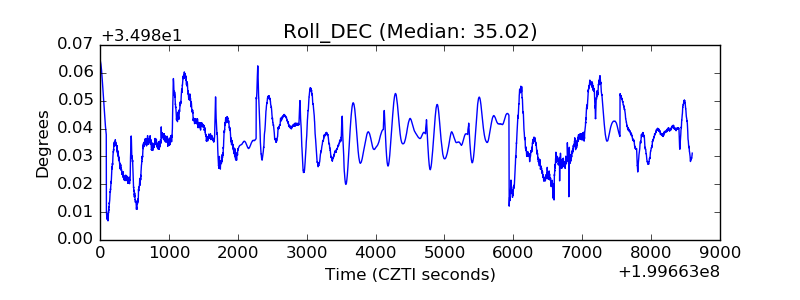 |
| _Roll_RA | 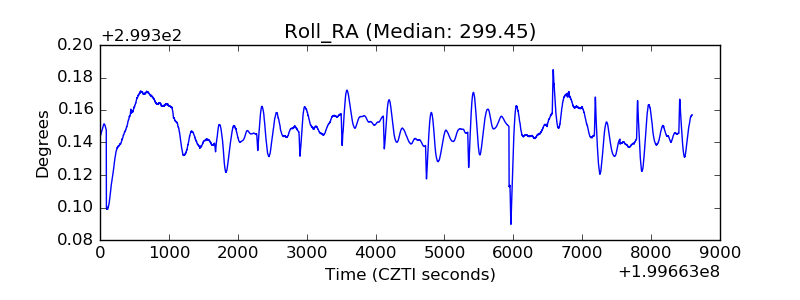 |
| Veto Counter | 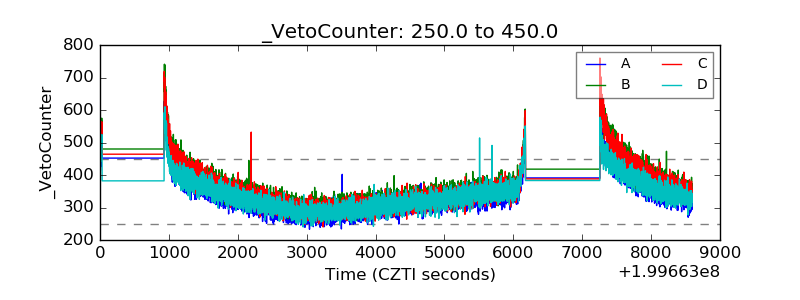 |