| Param | Original file | Final file |
|---|---|---|
| Filename | modeM0/AS1G05_127T01_9000000436_03183cztM0_level2.evt | modeM0/AS1G05_127T01_9000000436_03183cztM0_level2_quad_clean.evt |
| Size (bytes) | 643,210,560 | 87,661,440 |
| Size | 613.4 MB | 83.6 MB |
| Events in quadrant A | 3,110,261 | 591,413 |
| Events in quadrant B | 3,370,569 | 602,889 |
| Events in quadrant C | 9,293,604 | 436,913 |
| Events in quadrant D | 3,253,182 | 557,577 |
| Mode M9 | |||
|---|---|---|---|
| Quadrant | BADHDUFLAG | Total packets | Discarded packets |
| A | 0 | 18 | 0 |
| B | 0 | 18 | 0 |
| C | 0 | 18 | 0 |
| D | 0 | 19 | 0 |
| Mode SS | |||
|---|---|---|---|
| Quadrant | BADHDUFLAG | Total packets | Discarded packets |
| A | 0 | 134 | 0 |
| B | 0 | 134 | 0 |
| C | 0 | 134 | 0 |
| D | 0 | 134 | 0 |
| Mode M0 | |||
|---|---|---|---|
| Quadrant | BADHDUFLAG | Total packets | Discarded packets |
| A | 0 | 13741 | 3 |
| B | 0 | 14402 | 2 |
| C | 0 | 32231 | 2 |
| D | 0 | 14460 | 2 |
| Quadrant | Total seconds | Saturated seconds | Saturation percentage |
|---|---|---|---|
| A | 6675 | 25 | 0.374532% |
| B | 6675 | 47 | 0.704120% |
| C | 6675 | 2151 | 32.224719% |
| D | 6675 | 47 | 0.704120% |
Noise dominated data is calculated using 1-second bins in cleaned event files. If a bin has >2000 counts, and if more than 50% of those come from <1% of pixels, then it is considered to be noise-dominated and hence unusable.
| Quadrant | # 1 sec bins | Bins with >0 counts | Bins with >2000 counts | High rate bins dominated by noise | Noise dominated (total time) | Noise dominated (detector-on time) | Marked lightcurve |
|---|---|---|---|---|---|---|---|
| A | 7940 | 6676 | 0 | 0 | 0.00% | 0.00% | 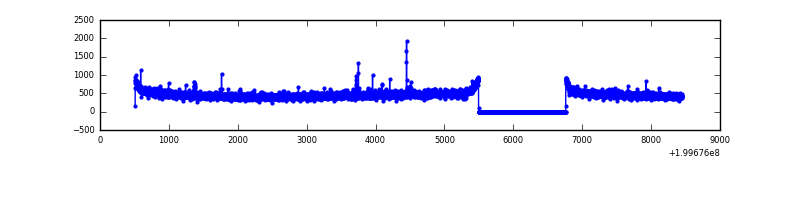 |
| B | 7940 | 6676 | 8 | 8 | 0.10% | 0.12% | 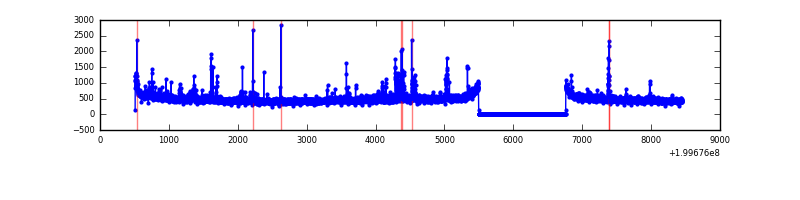 |
| C | 7940 | 6675 | 1963 | 1963 | 24.72% | 29.41% | 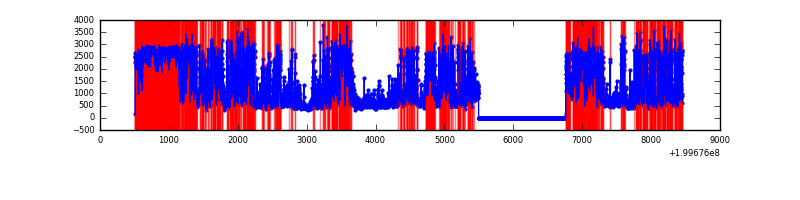 |
| D | 7940 | 6676 | 29 | 29 | 0.37% | 0.43% | 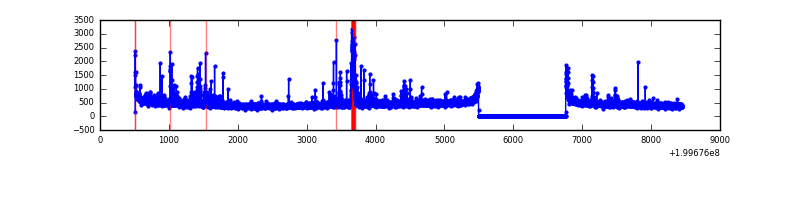 |
Top three noisy pixels from each quadrant. If the there are fewer than three noisy pixels in the level2.evt file, extra rows are filled as -1
| Pixel properties | Quadrant properties | ||||||
|---|---|---|---|---|---|---|---|
| Quadrant | DetID | PixID | Counts | Sigma | Mean | Median | Sigma |
| A | 7 | 16 | 10030 | 56.89 | 800 | 785 | 162.5 |
| A | 12 | 194 | 8459 | 47.22 | 800 | 785 | 162.5 |
| A | 0 | 226 | 8238 | 45.86 | 800 | 785 | 162.5 |
| B | 4 | 81 | 61167 | 385.91 | 819 | 801 | 156.4 |
| B | 4 | 80 | 55268 | 348.2 | 819 | 801 | 156.4 |
| B | 2 | 249 | 47356 | 297.62 | 819 | 801 | 156.4 |
| C | 12 | 206 | 6653729 | 45855.9 | 626 | 630 | 145.1 |
| C | 1 | 192 | 101059 | 692.2 | 626 | 630 | 145.1 |
| C | 6 | 80 | 38651 | 262.06 | 626 | 630 | 145.1 |
| D | 12 | 233 | 153493 | 831.76 | 764 | 745 | 183.6 |
| D | 13 | 120 | 78445 | 423.1 | 764 | 745 | 183.6 |
| D | 13 | 223 | 41745 | 223.26 | 764 | 745 | 183.6 |
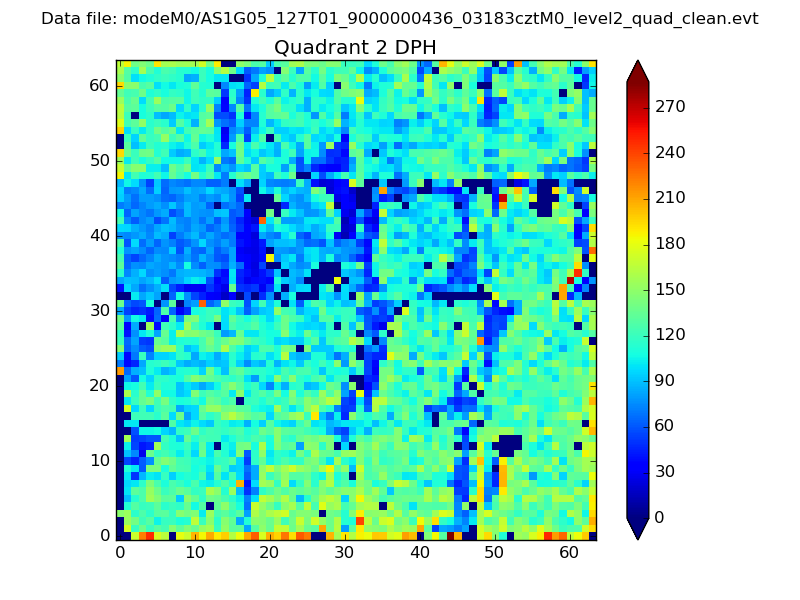
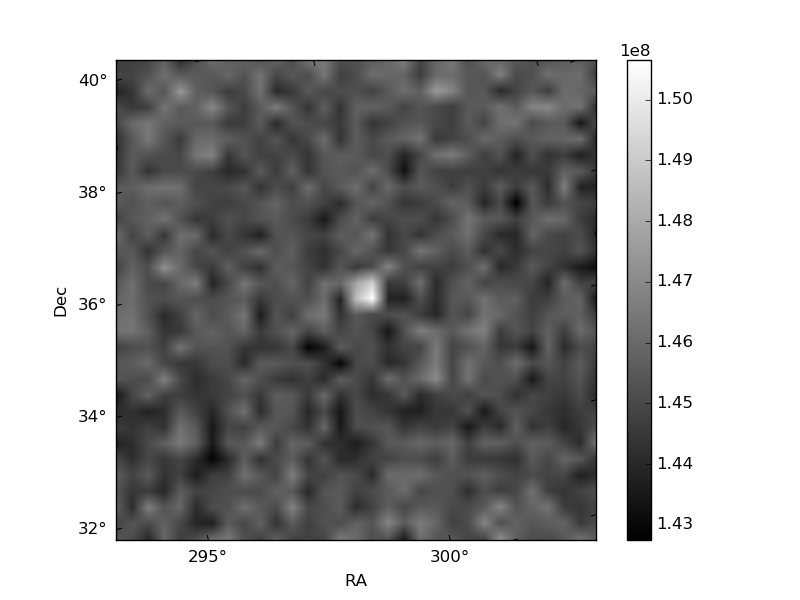
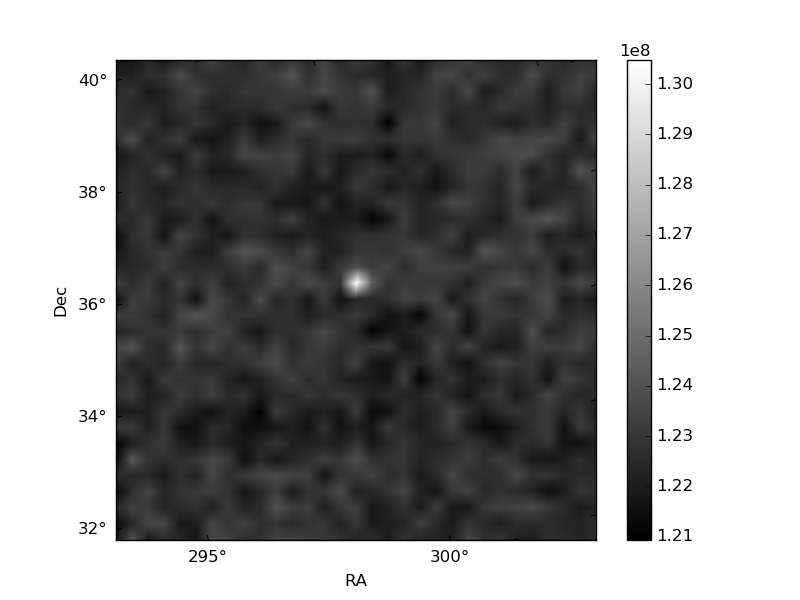
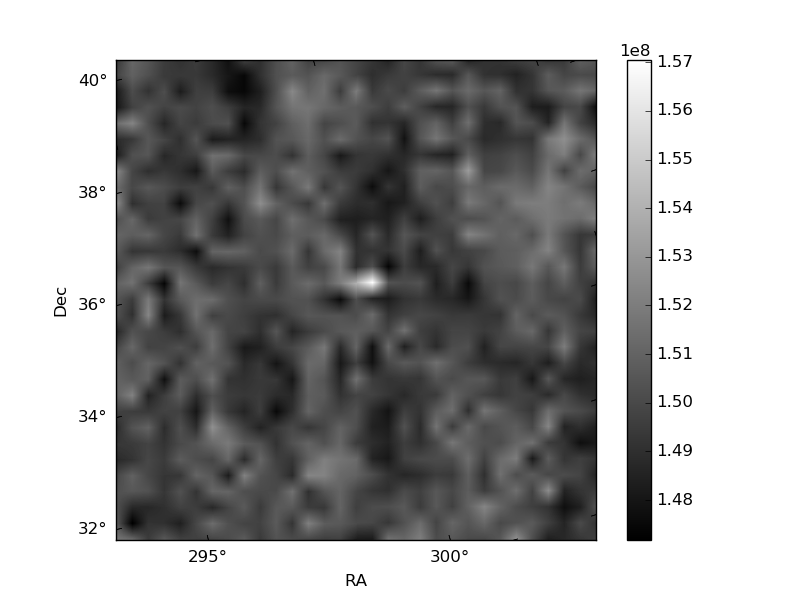
Histogram calculated using DETX and DETY for each event in the final _common_clean file
| Quadrant A | 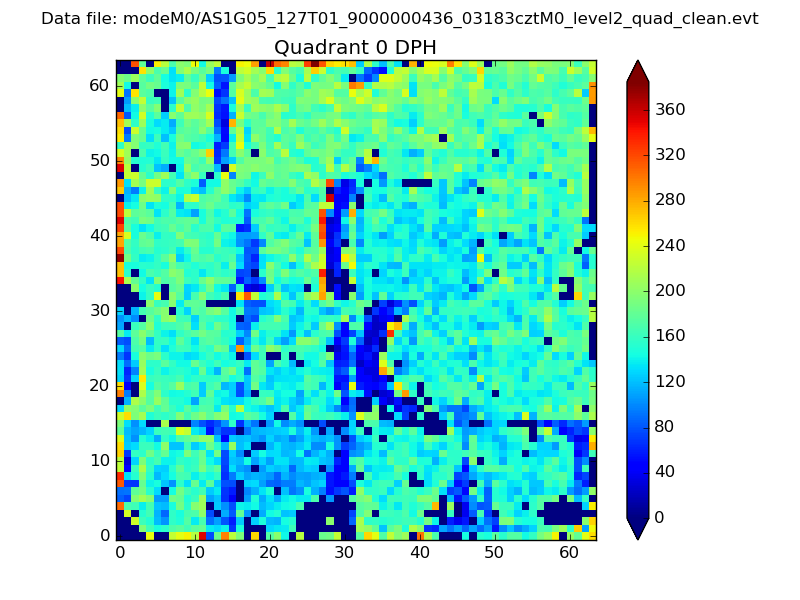 |
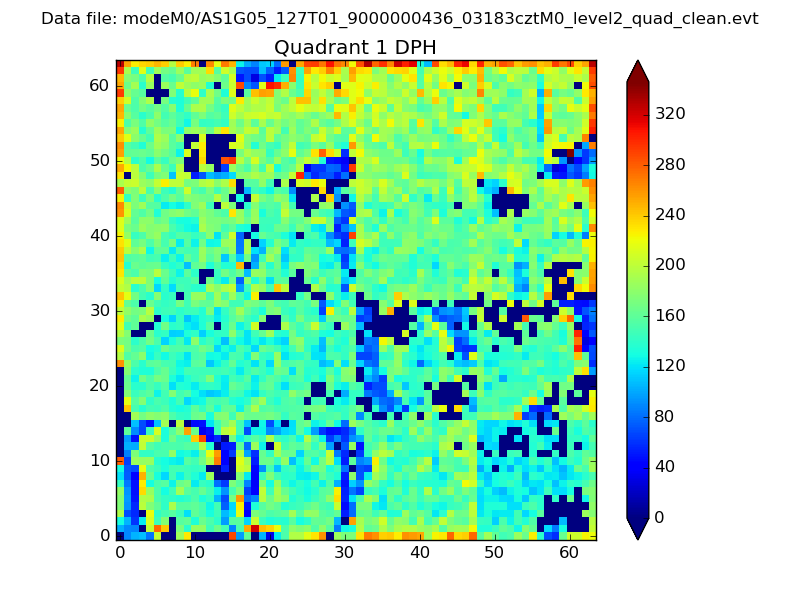 |
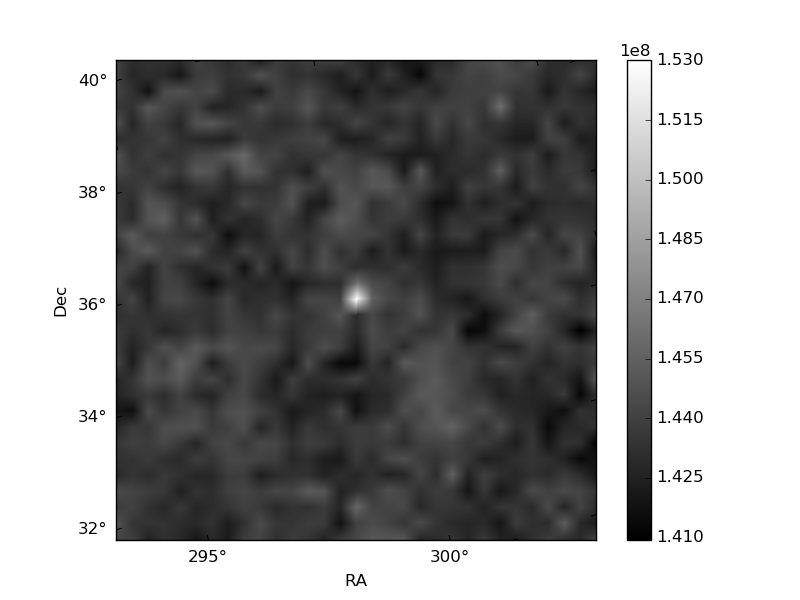
Quadrant B |
|---|---|---|---|
| Quadrant D | 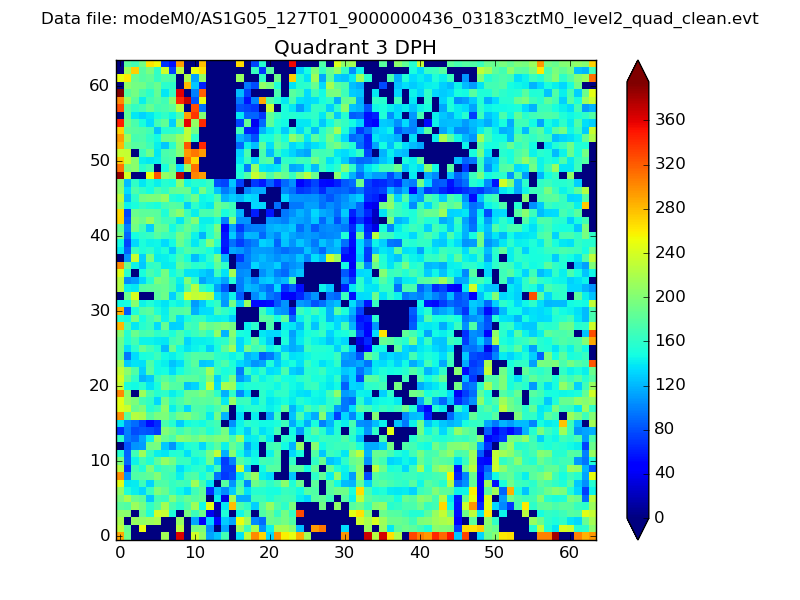 |
 |
Quadrant C |
| Plot type | Count rate plots | Images |
|---|---|---|
| Comparison with Poisson distribution Blue bars denote a histogram of data divided into 1 sec bins. Red curve is a Poisson curve with rate = median count rate of data. |
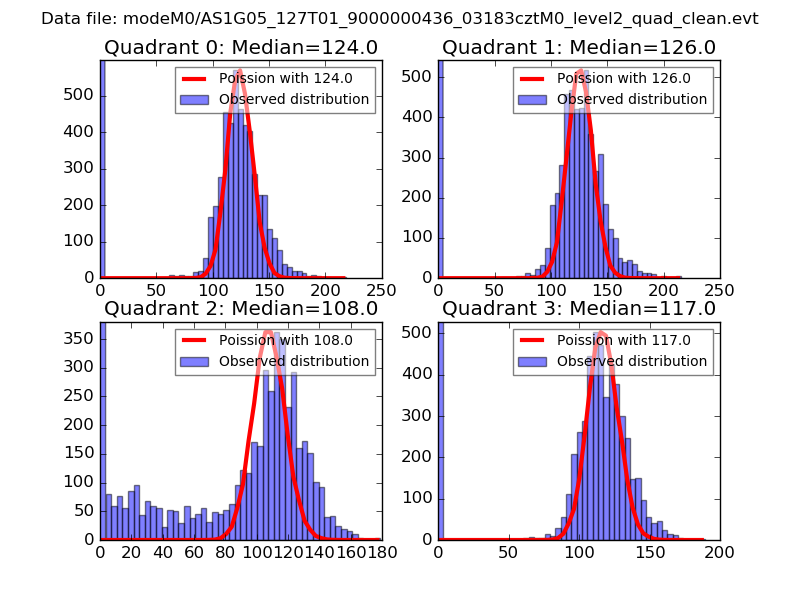 |
 |
| Quadrant-wise count rates Data is divided into 100 sec bins |
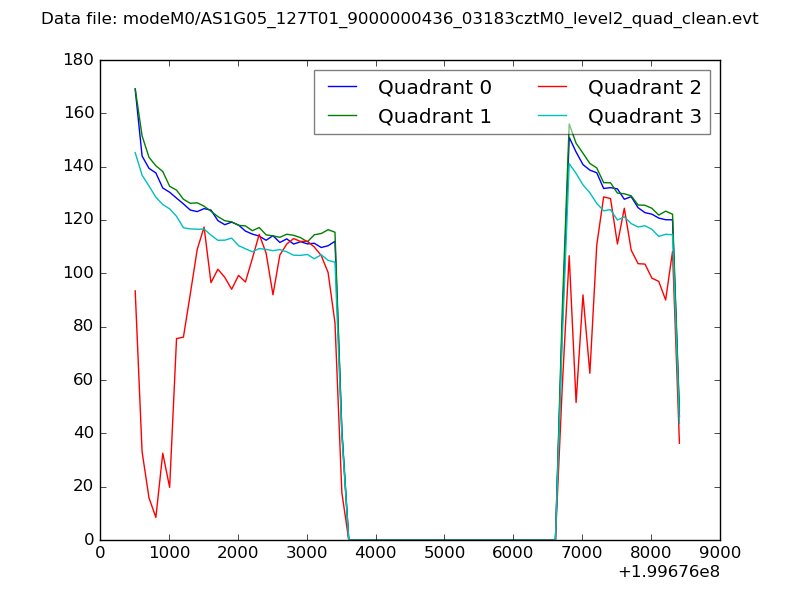 |
|
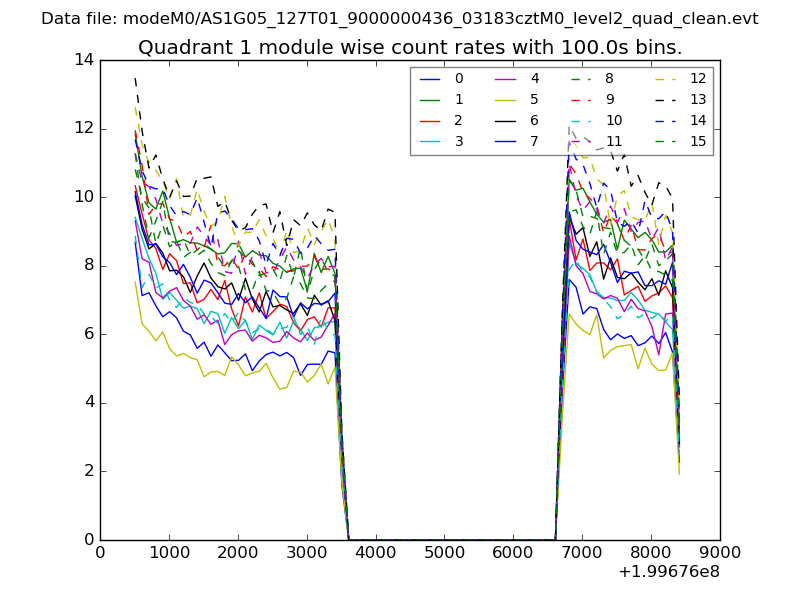
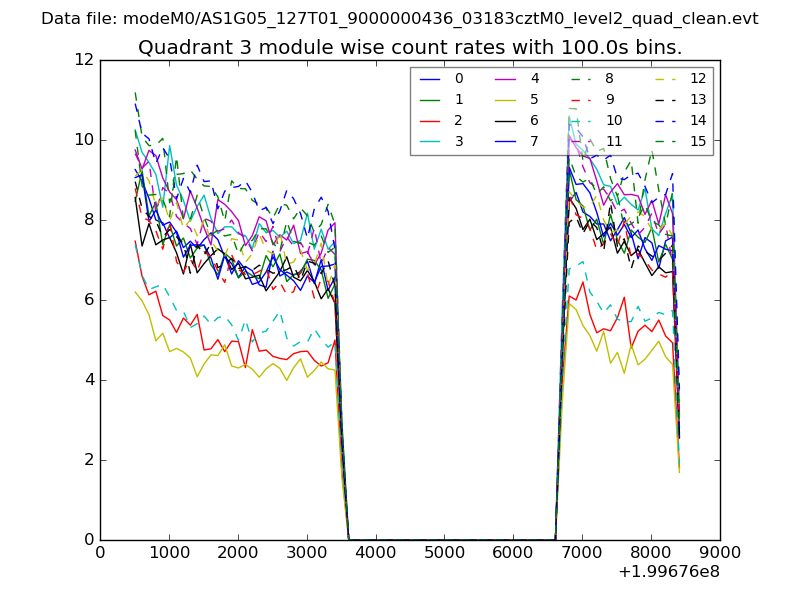
| Module-wise count rates for Quadrant A Data is divided into 100 sec bins |
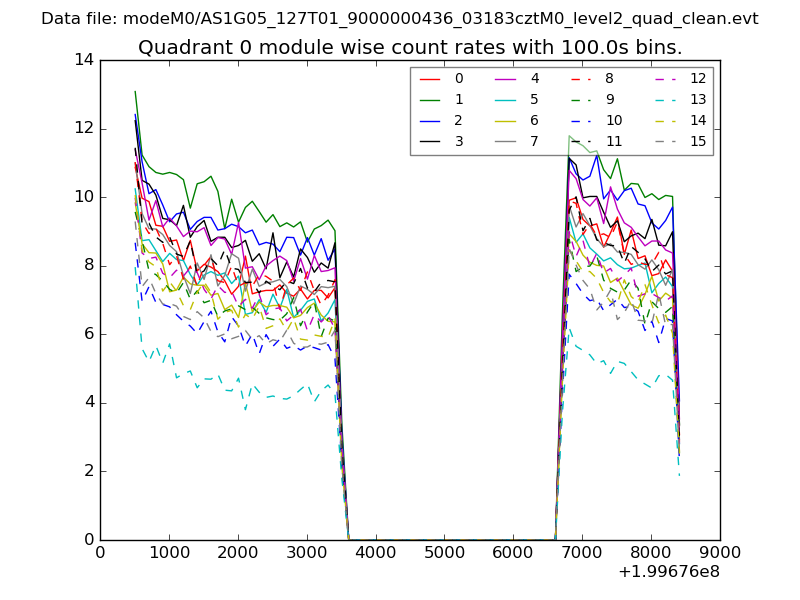 |
 |
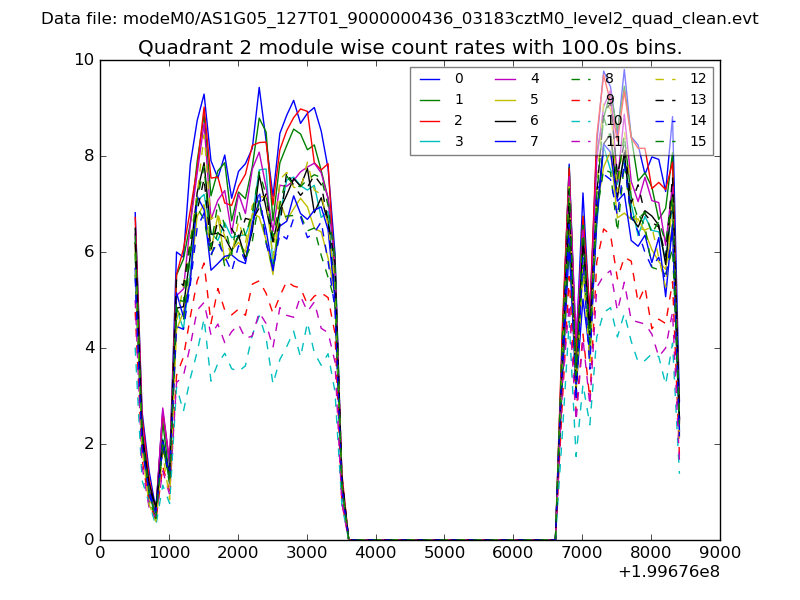
| Module-wise count rates for Quadrant B Data is divided into 100 sec bins |
 |
 |
| Module-wise count rates for Quadrant C Data is divided into 100 sec bins |
 |
 |
| Module-wise count rates for Quadrant D Data is divided into 100 sec bins |
 |
 |
| Parameter | Plot |
|---|---|
| CZT HV Monitor | 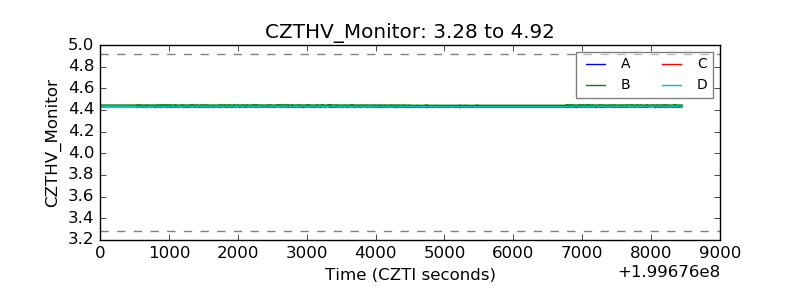 |
| D_VDD | 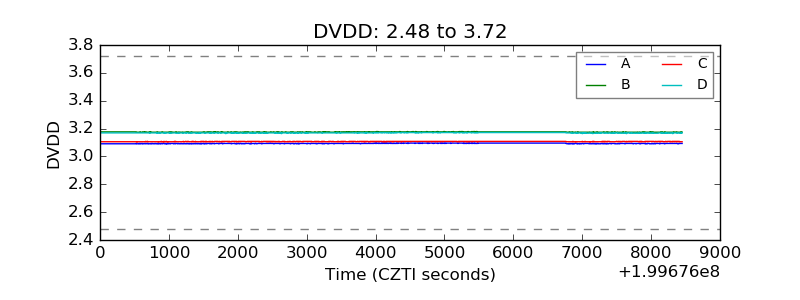 |
| Temperature 1 | 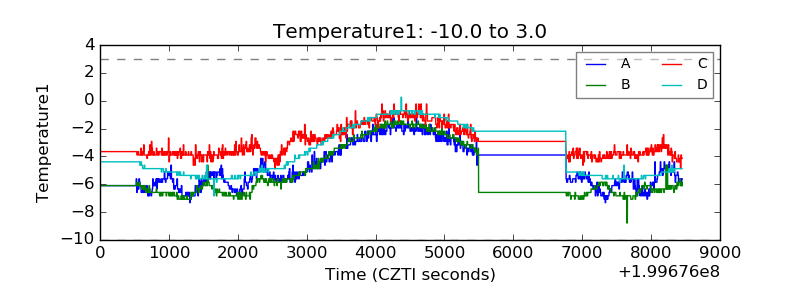 |
| Veto HV Monitor | 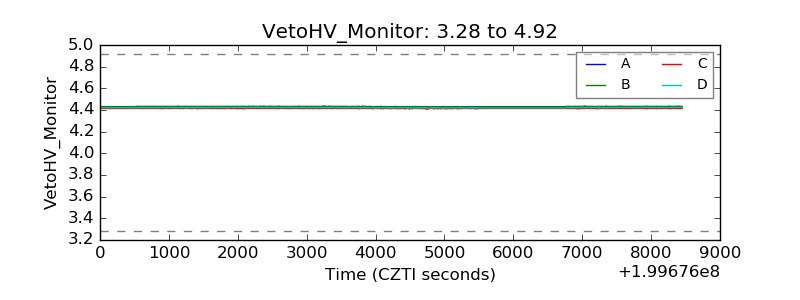 |
| Veto LLD | 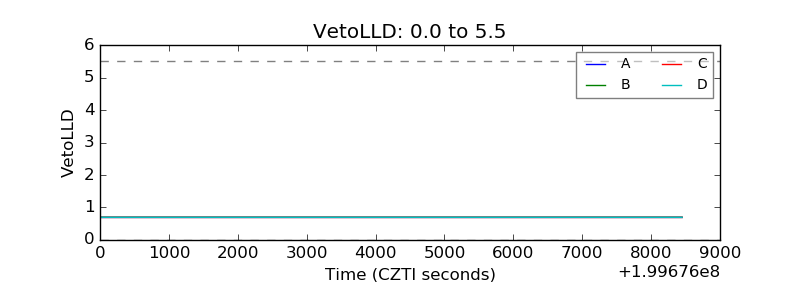 |
| Alpha Counter | 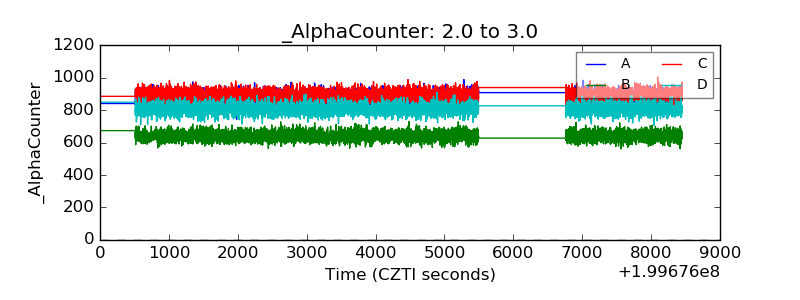 |
| _CPM_Rate | 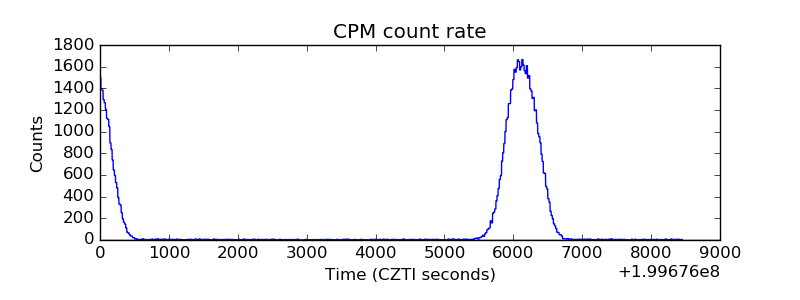 |
| CZT Counter | 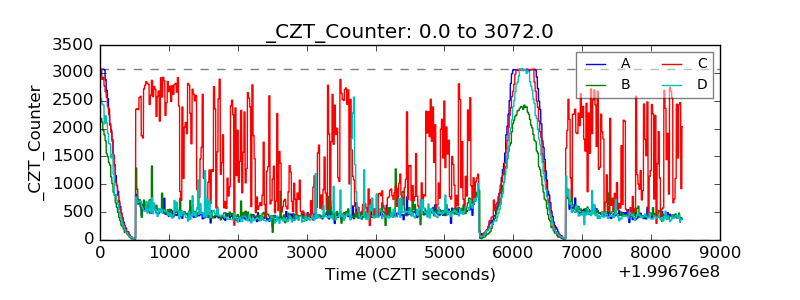 |
| +2.5 Volts monitor |  |
| +5 Volts monitor |  |
| _ROLL_ROT | 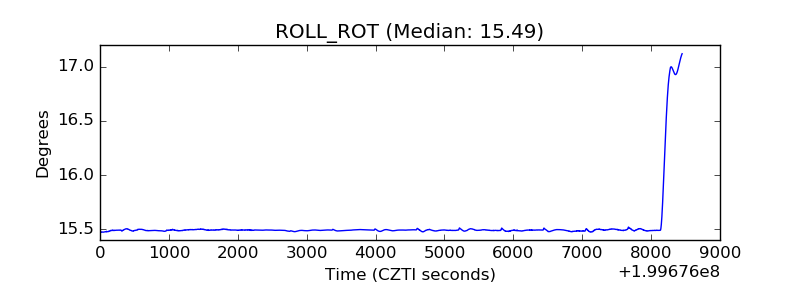 |
| _Roll_DEC | 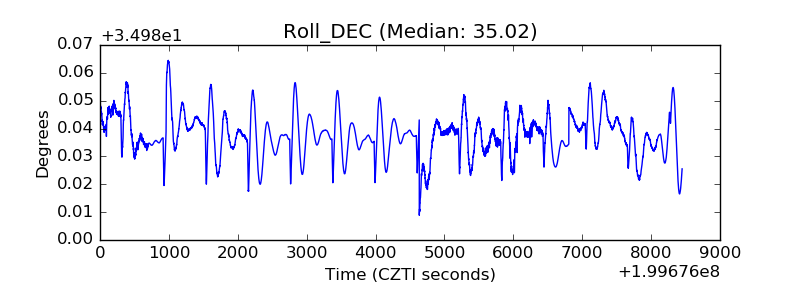 |
| _Roll_RA | 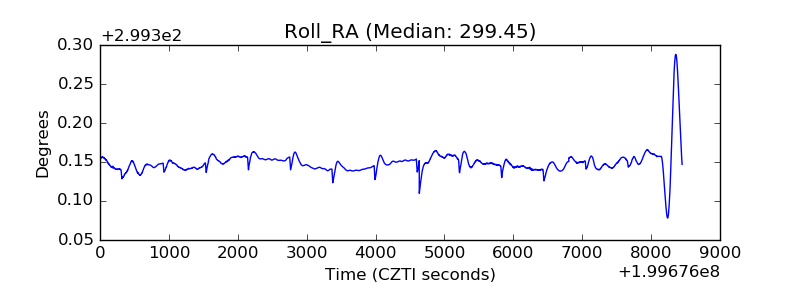 |
| Veto Counter | 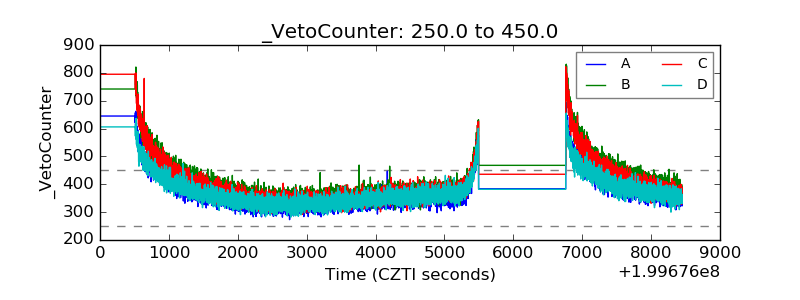 |