| Param | Original file | Final file |
|---|---|---|
| Filename | modeM0/AS1G05_127T01_9000000436_03184cztM0_level2.evt | modeM0/AS1G05_127T01_9000000436_03184cztM0_level2_quad_clean.evt |
| Size (bytes) | 550,635,840 | 64,535,040 |
| Size | 525.1 MB | 61.5 MB |
| Events in quadrant A | 2,572,659 | 425,553 |
| Events in quadrant B | 2,755,293 | 432,067 |
| Events in quadrant C | 8,386,809 | 309,007 |
| Events in quadrant D | 2,587,722 | 401,562 |
| Mode M9 | |||
|---|---|---|---|
| Quadrant | BADHDUFLAG | Total packets | Discarded packets |
| A | 0 | 14 | 0 |
| B | 0 | 14 | 0 |
| C | 0 | 14 | 0 |
| D | 0 | 14 | 0 |
| Mode SS | |||
|---|---|---|---|
| Quadrant | BADHDUFLAG | Total packets | Discarded packets |
| A | 0 | 110 | 0 |
| B | 0 | 110 | 0 |
| C | 0 | 110 | 0 |
| D | 0 | 110 | 0 |
| Mode M0 | |||
|---|---|---|---|
| Quadrant | BADHDUFLAG | Total packets | Discarded packets |
| A | 0 | 11312 | 2 |
| B | 0 | 11768 | 1 |
| C | 0 | 28737 | 1 |
| D | 0 | 11688 | 1 |
| Quadrant | Total seconds | Saturated seconds | Saturation percentage |
|---|---|---|---|
| A | 5510 | 21 | 0.381125% |
| B | 5510 | 38 | 0.689655% |
| C | 5510 | 2288 | 41.524501% |
| D | 5510 | 42 | 0.762250% |
Noise dominated data is calculated using 1-second bins in cleaned event files. If a bin has >2000 counts, and if more than 50% of those come from <1% of pixels, then it is considered to be noise-dominated and hence unusable.
| Quadrant | # 1 sec bins | Bins with >0 counts | Bins with >2000 counts | High rate bins dominated by noise | Noise dominated (total time) | Noise dominated (detector-on time) | Marked lightcurve |
|---|---|---|---|---|---|---|---|
| A | 6825 | 5511 | 0 | 0 | 0.00% | 0.00% | 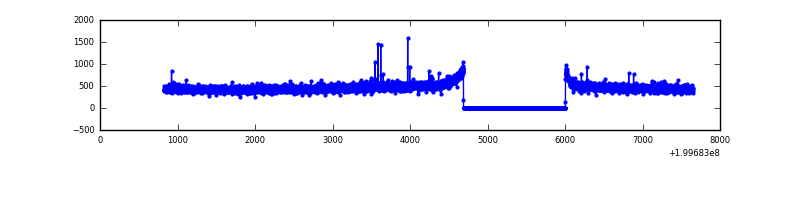 |
| B | 6825 | 5511 | 3 | 3 | 0.04% | 0.05% | 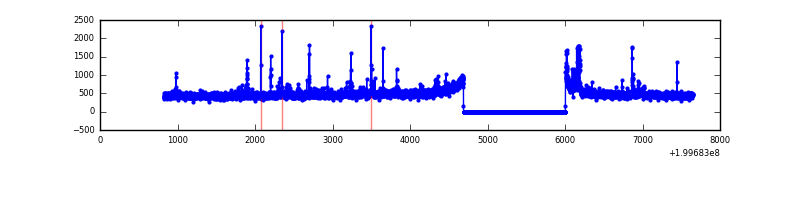 |
| C | 6825 | 5510 | 1950 | 1950 | 28.57% | 35.39% | 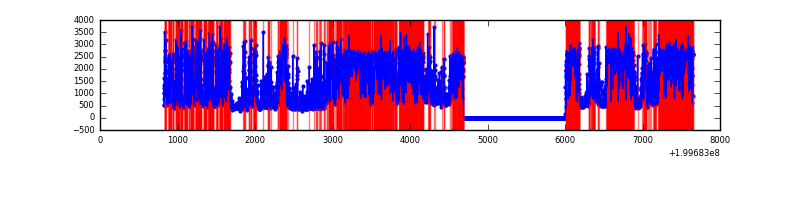 |
| D | 6825 | 5511 | 23 | 23 | 0.34% | 0.42% | 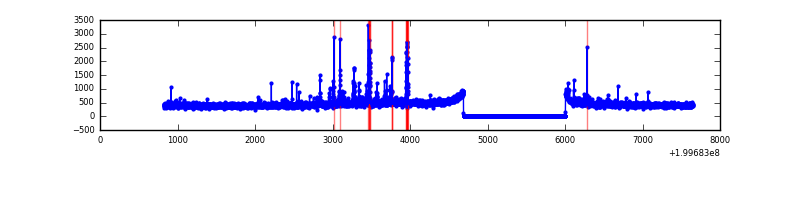 |
Top three noisy pixels from each quadrant. If the there are fewer than three noisy pixels in the level2.evt file, extra rows are filled as -1
| Pixel properties | Quadrant properties | ||||||
|---|---|---|---|---|---|---|---|
| Quadrant | DetID | PixID | Counts | Sigma | Mean | Median | Sigma |
| A | 12 | 247 | 9001 | 62.04 | 663 | 650 | 134.6 |
| A | 0 | 226 | 7066 | 47.67 | 663 | 650 | 134.6 |
| A | 12 | 194 | 7052 | 47.56 | 663 | 650 | 134.6 |
| B | 4 | 81 | 112368 | 867.54 | 672 | 658 | 128.8 |
| B | 15 | 85 | 14961 | 111.08 | 672 | 658 | 128.8 |
| B | 4 | 200 | 13756 | 101.72 | 672 | 658 | 128.8 |
| C | 12 | 206 | 5755497 | 52319.81 | 470 | 474 | 110.0 |
| C | 1 | 192 | 704936 | 6404.37 | 470 | 474 | 110.0 |
| C | 6 | 80 | 54176 | 488.21 | 470 | 474 | 110.0 |
| D | 13 | 120 | 79667 | 515.33 | 631 | 613 | 153.4 |
| D | 2 | 248 | 58509 | 377.4 | 631 | 613 | 153.4 |
| D | 13 | 223 | 26845 | 171.0 | 631 | 613 | 153.4 |
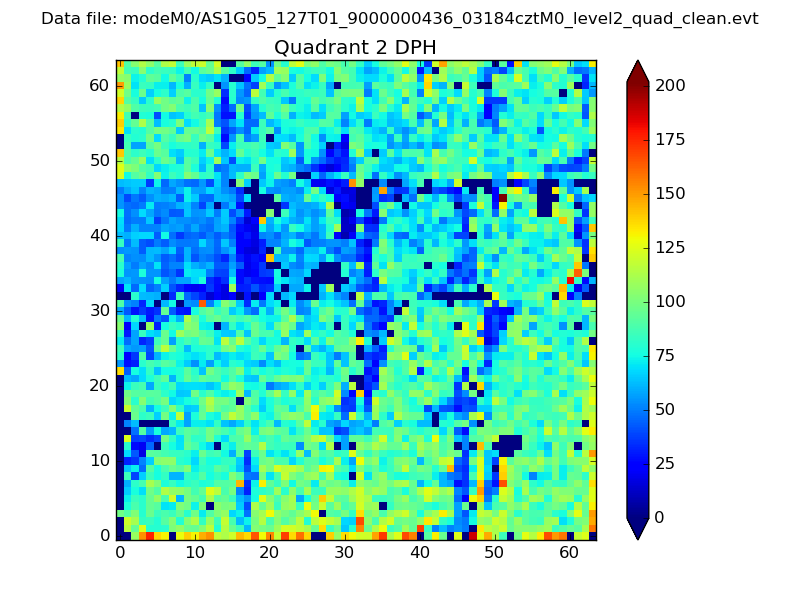
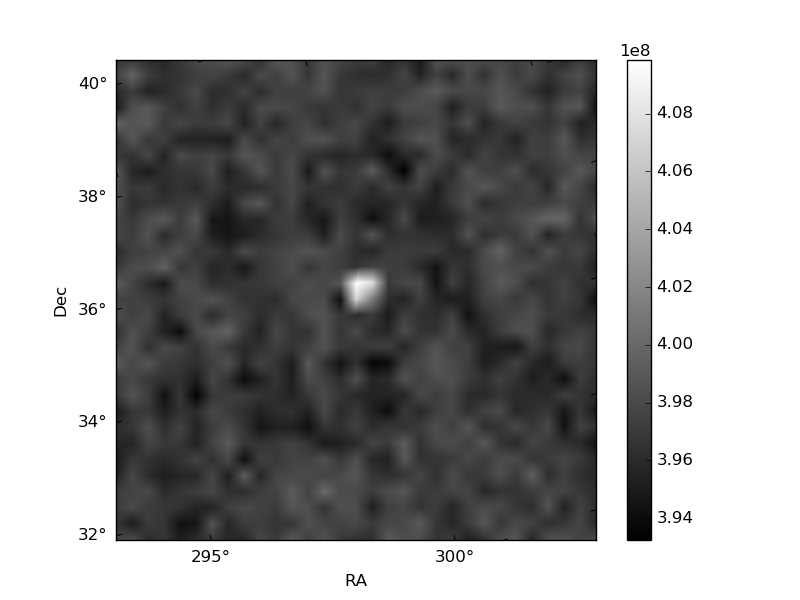
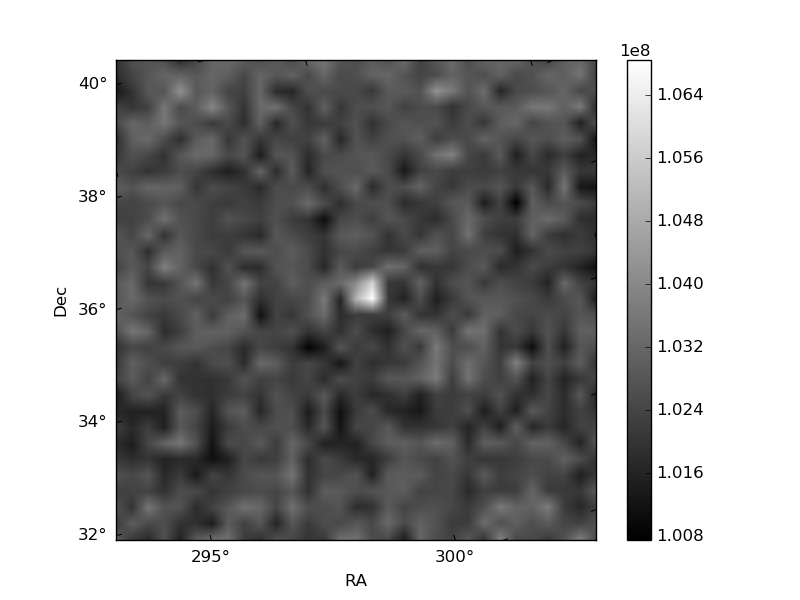
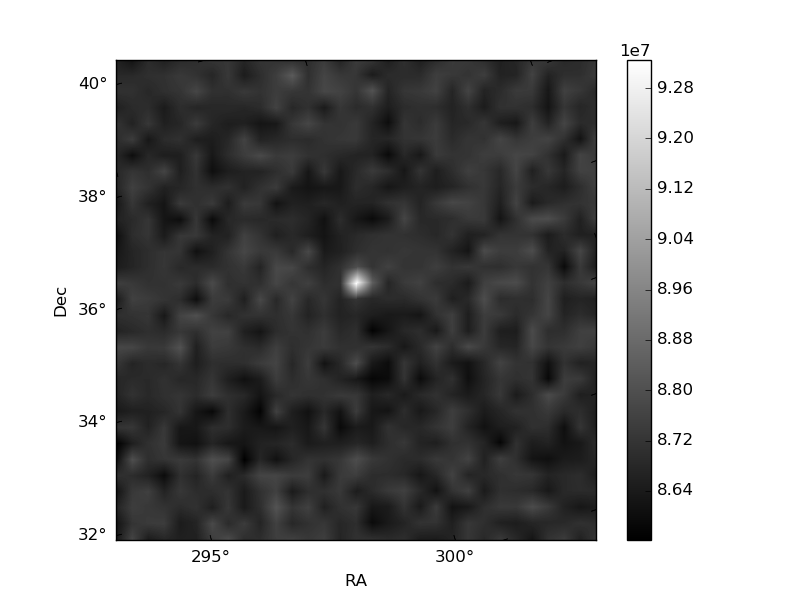
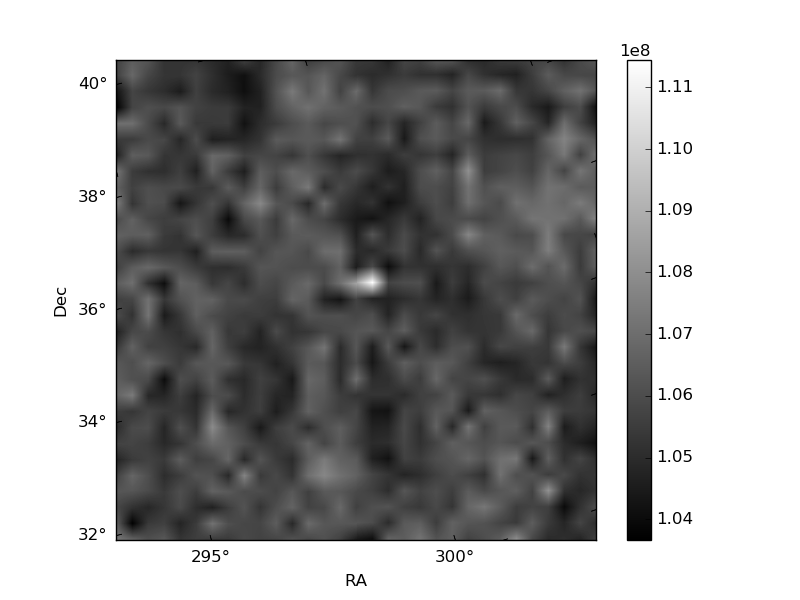
Histogram calculated using DETX and DETY for each event in the final _common_clean file
| Quadrant A | 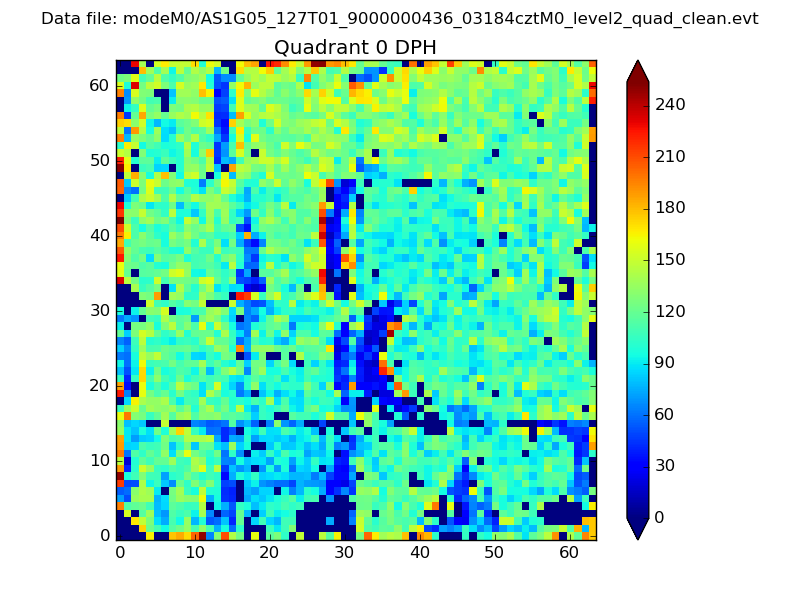 |
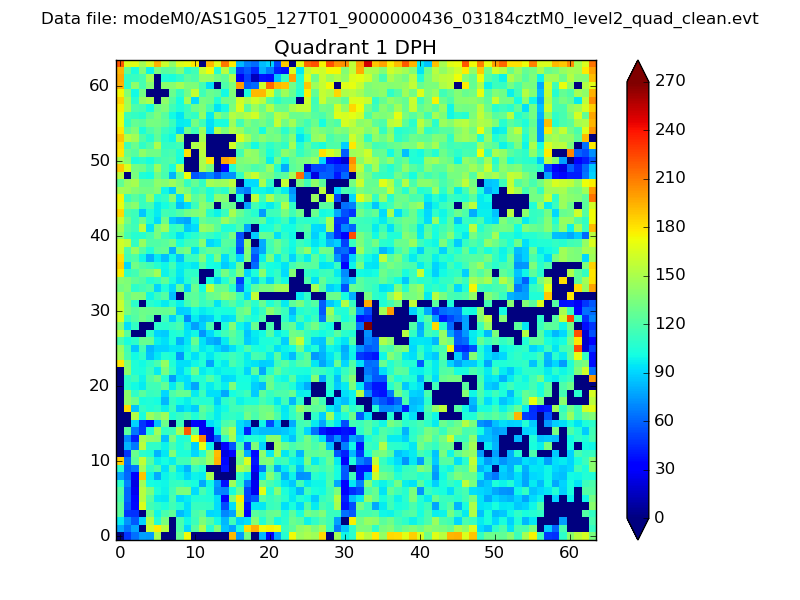 |
Quadrant B |
|---|---|---|---|
| Quadrant D | 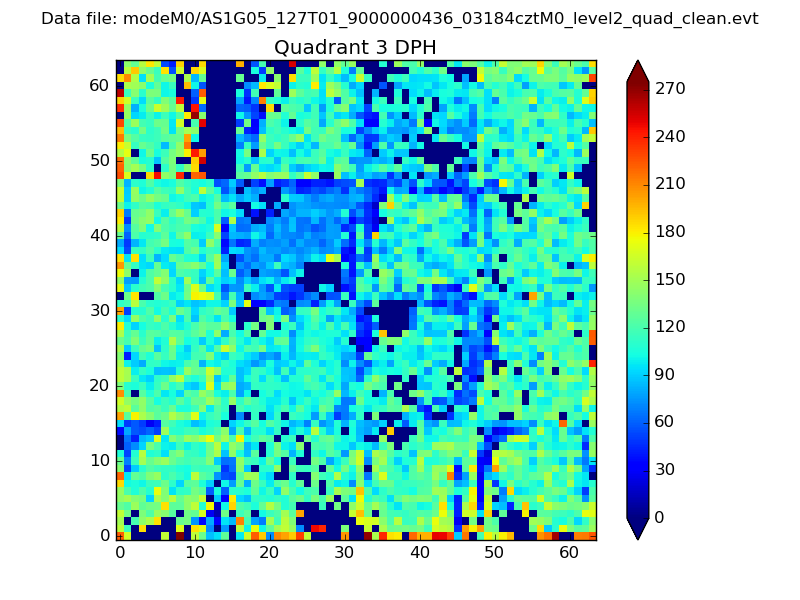 |
 |
Quadrant C |
| Plot type | Count rate plots | Images |
|---|---|---|
| Comparison with Poisson distribution Blue bars denote a histogram of data divided into 1 sec bins. Red curve is a Poisson curve with rate = median count rate of data. |
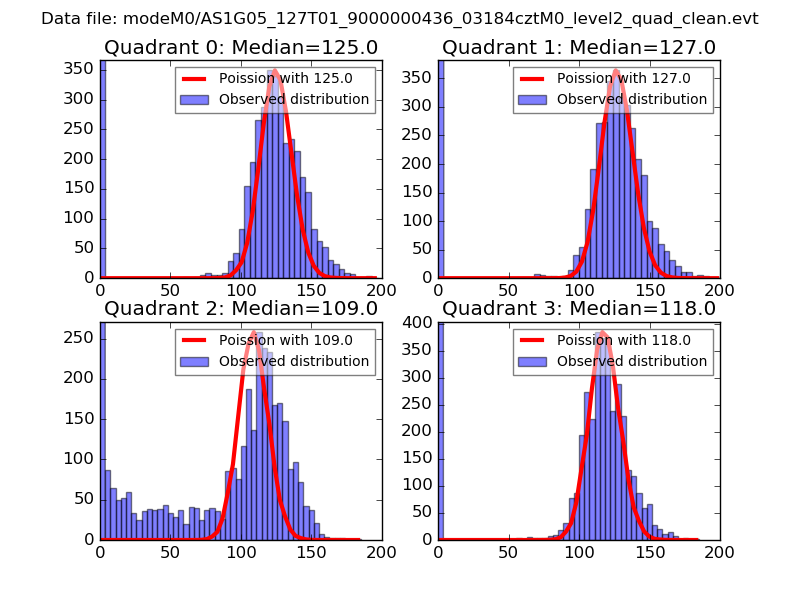 |
 |
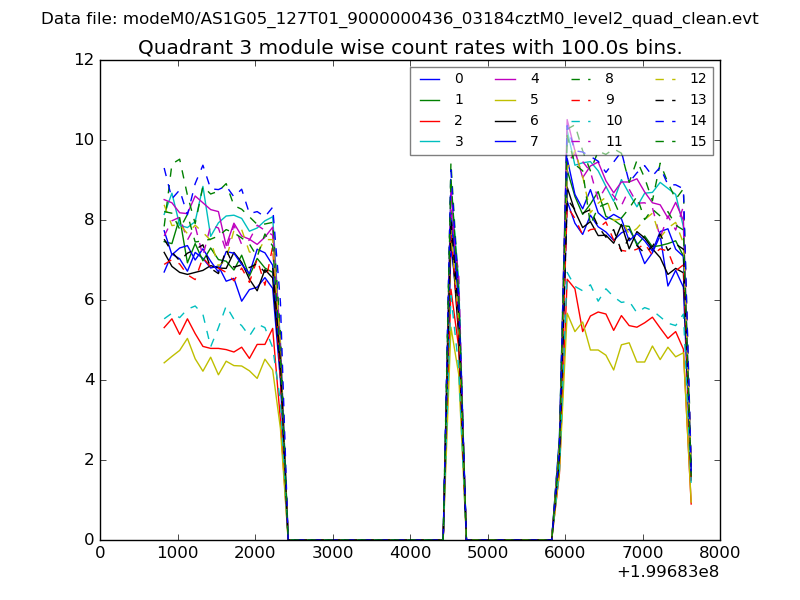
| Quadrant-wise count rates Data is divided into 100 sec bins |
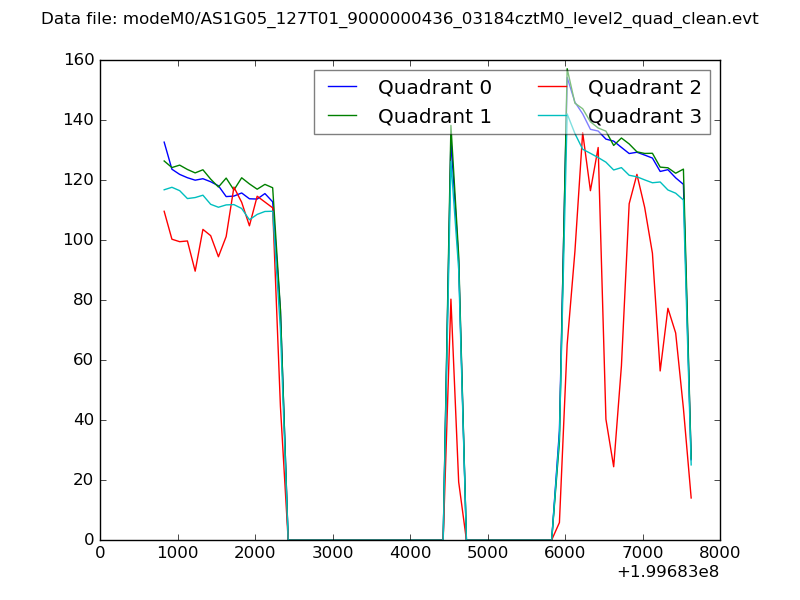 |
|
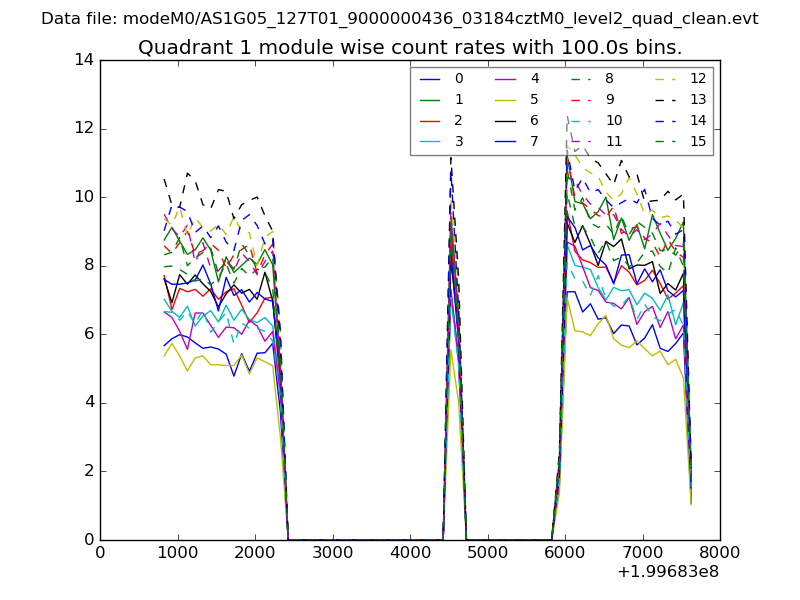
| Module-wise count rates for Quadrant A Data is divided into 100 sec bins |
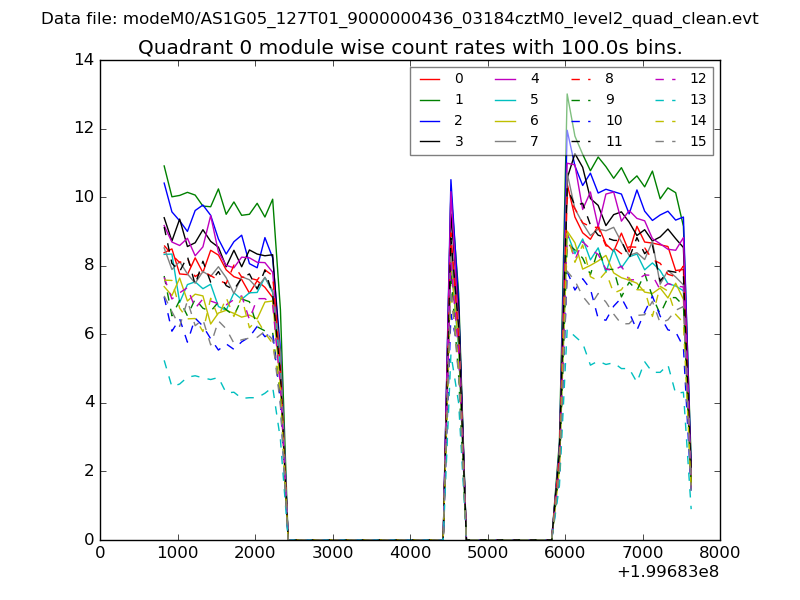 |
 |
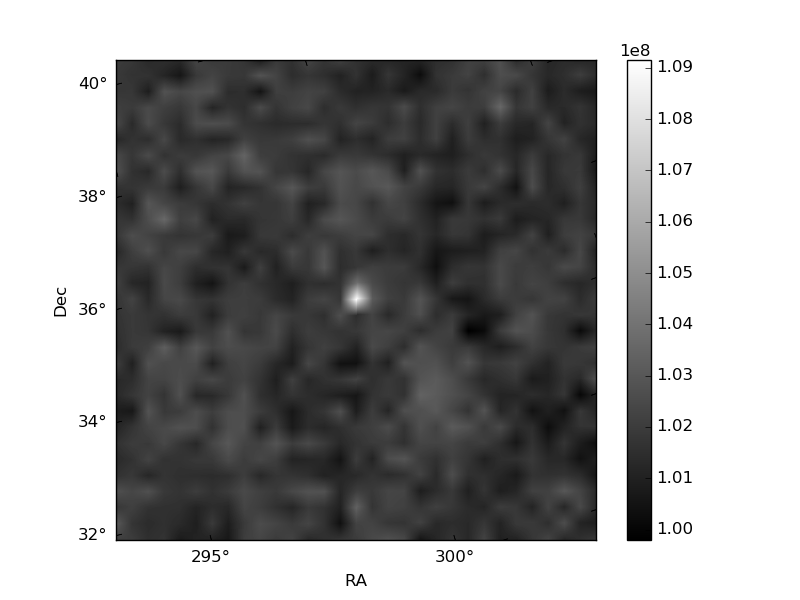
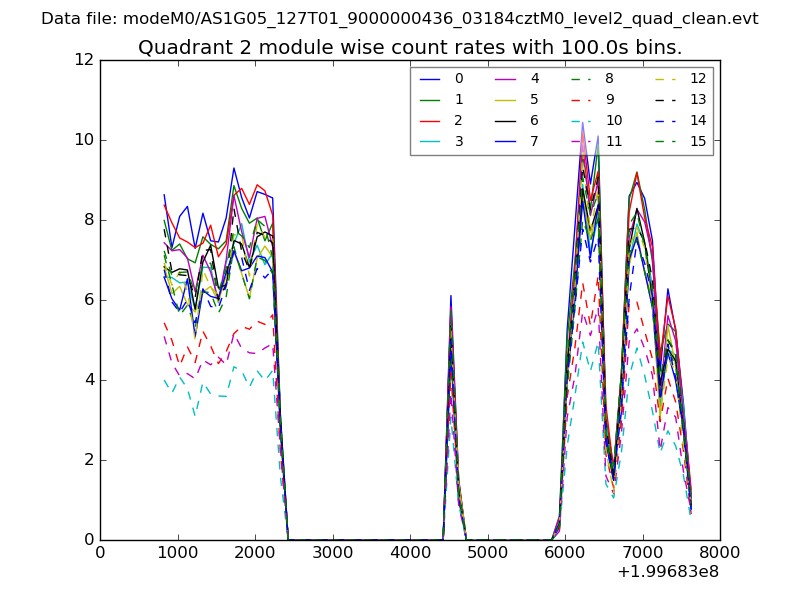
| Module-wise count rates for Quadrant B Data is divided into 100 sec bins |
 |
 |
| Module-wise count rates for Quadrant C Data is divided into 100 sec bins |
 |
 |
| Module-wise count rates for Quadrant D Data is divided into 100 sec bins |
 |
 |
| Parameter | Plot |
|---|---|
| CZT HV Monitor | 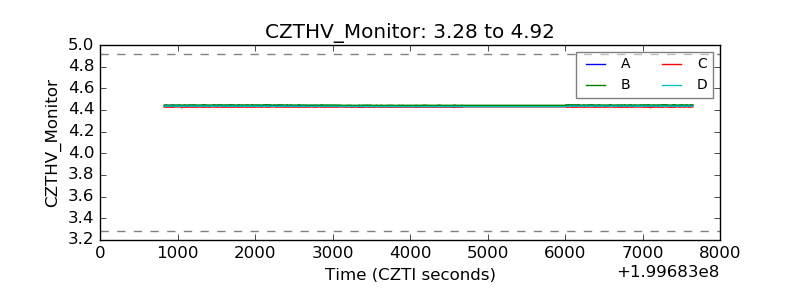 |
| D_VDD | 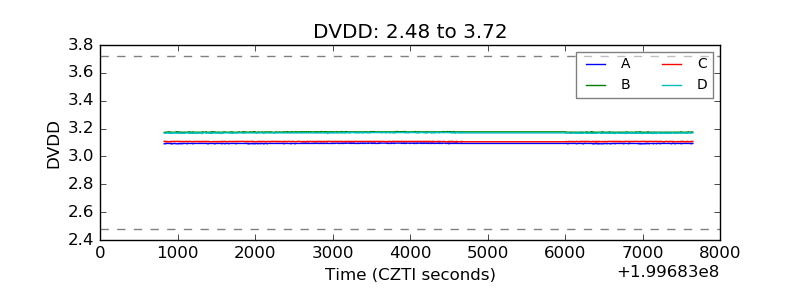 |
| Temperature 1 | 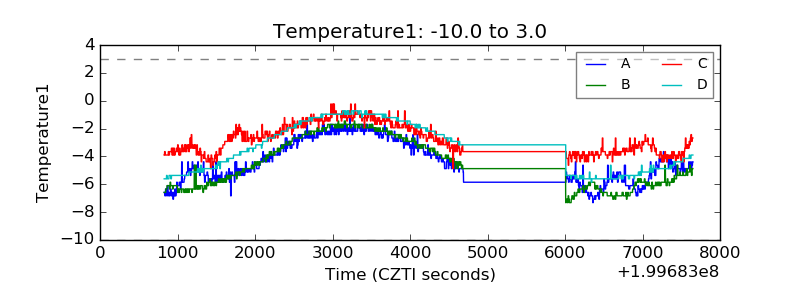 |
| Veto HV Monitor | 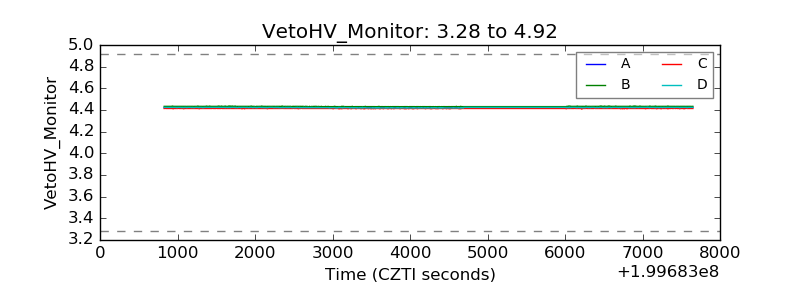 |
| Veto LLD | 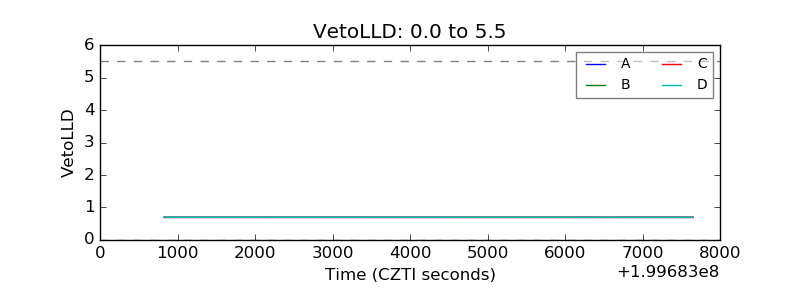 |
| Alpha Counter | 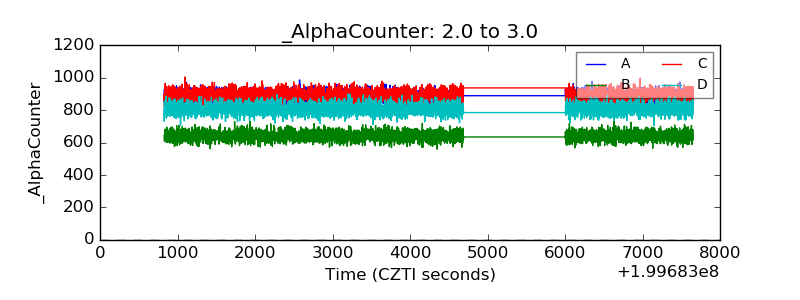 |
| _CPM_Rate | 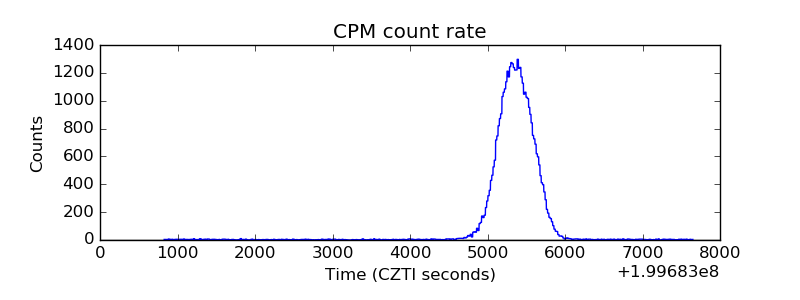 |
| CZT Counter | 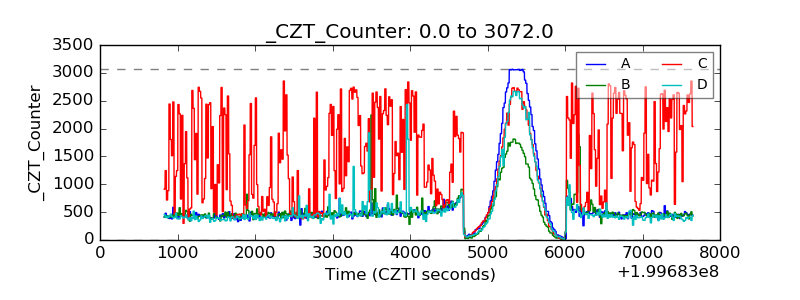 |
| +2.5 Volts monitor |  |
| +5 Volts monitor |  |
| _ROLL_ROT |  |
| _Roll_DEC | 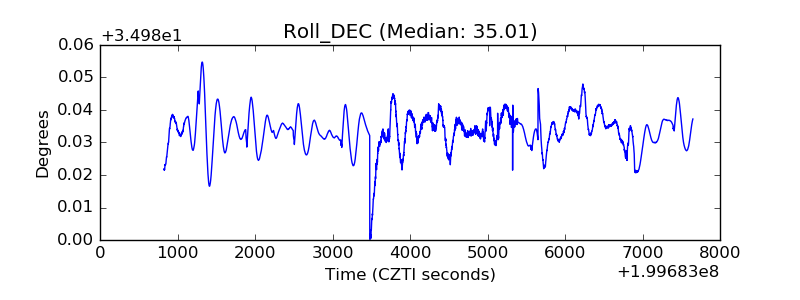 |
| _Roll_RA | 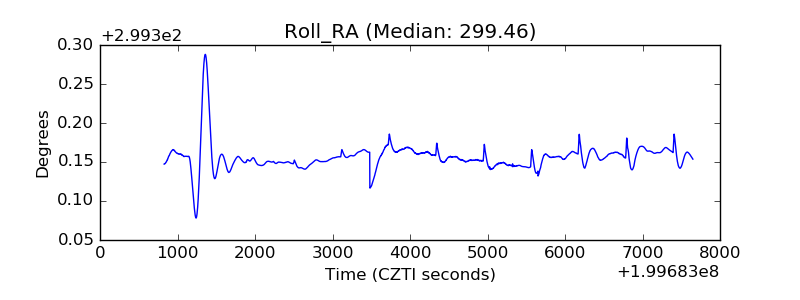 |
| Veto Counter | 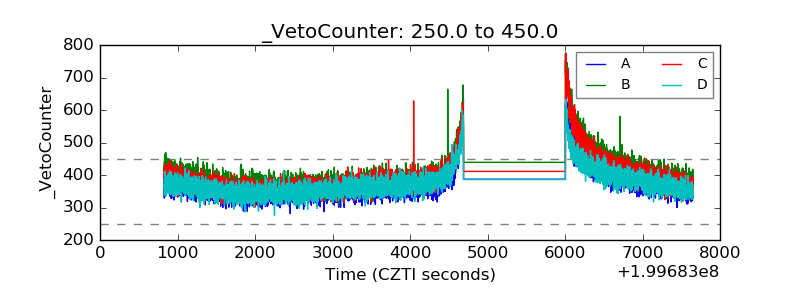 |